. 2023 Jul 21;9(1):257.
doi: 10.1038/s41420-023-01552-5.

CAMK2D: a novel molecular target for BAP1-deficient malignant mesothelioma

Affiliations

CAMK2D: a novel molecular target for BAP1-deficient malignant mesothelioma

Sivasundaram Karnan et al. Cell Death Discov. .

Abstract

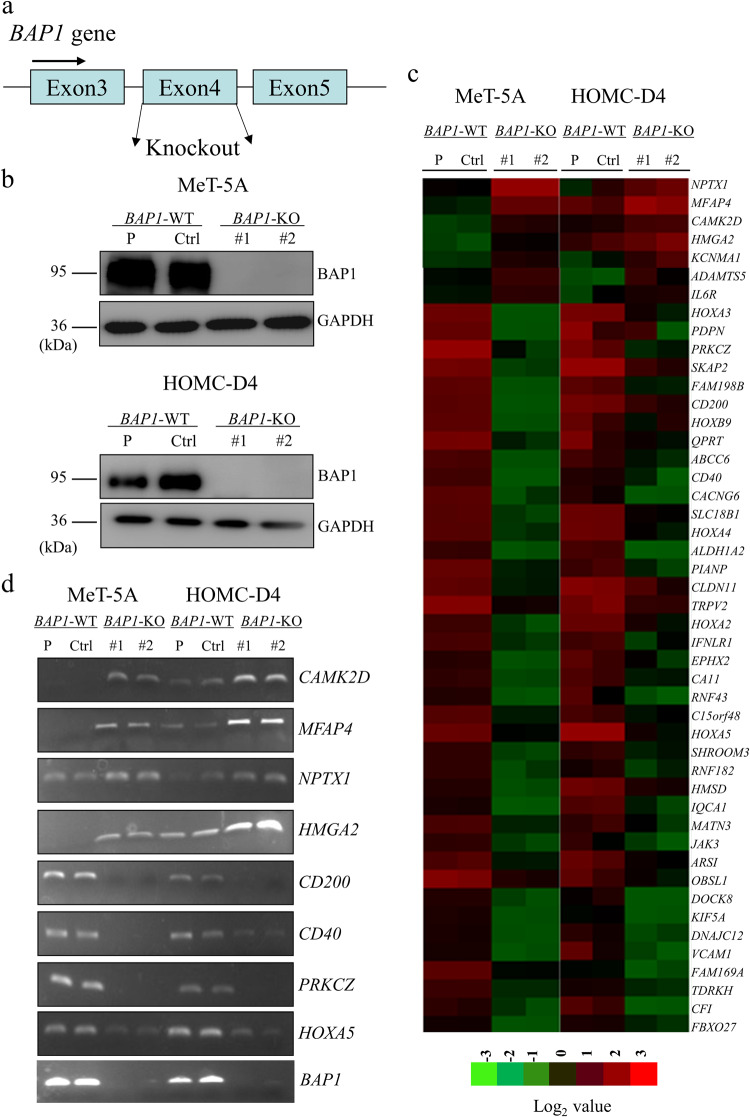
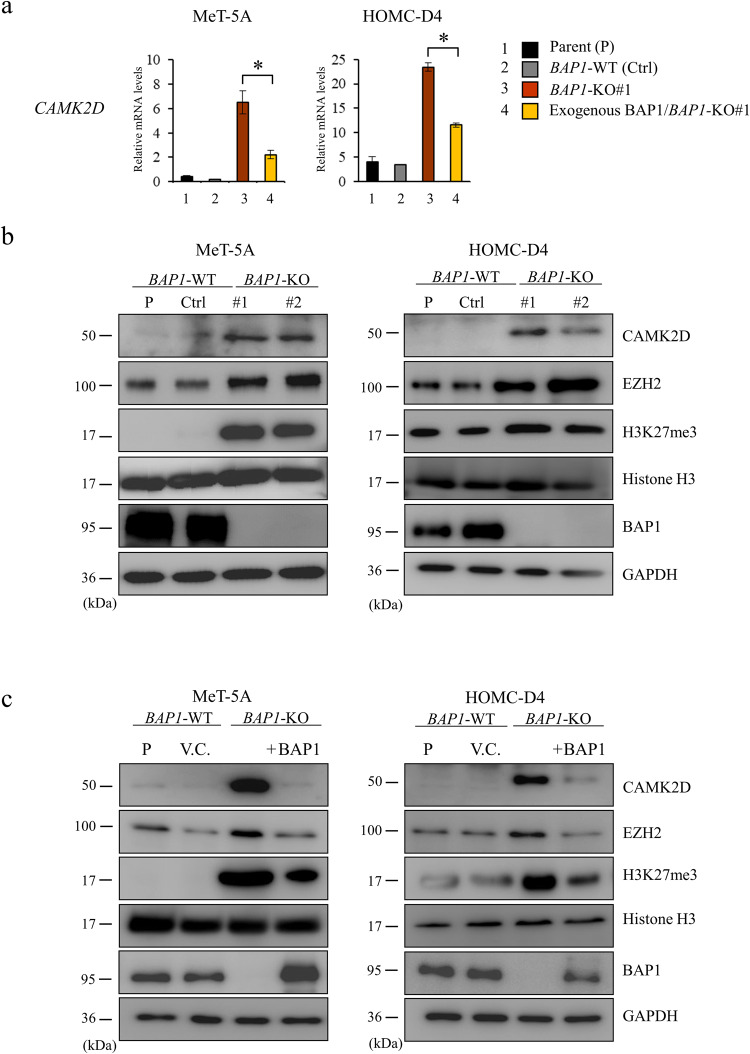
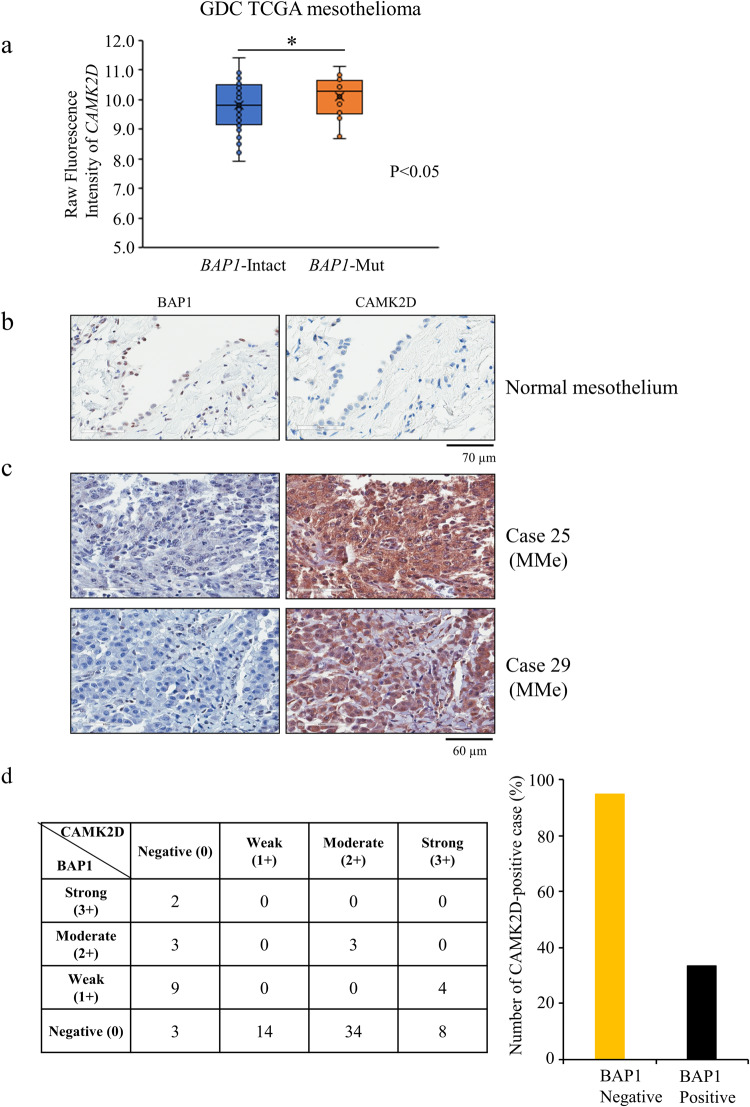
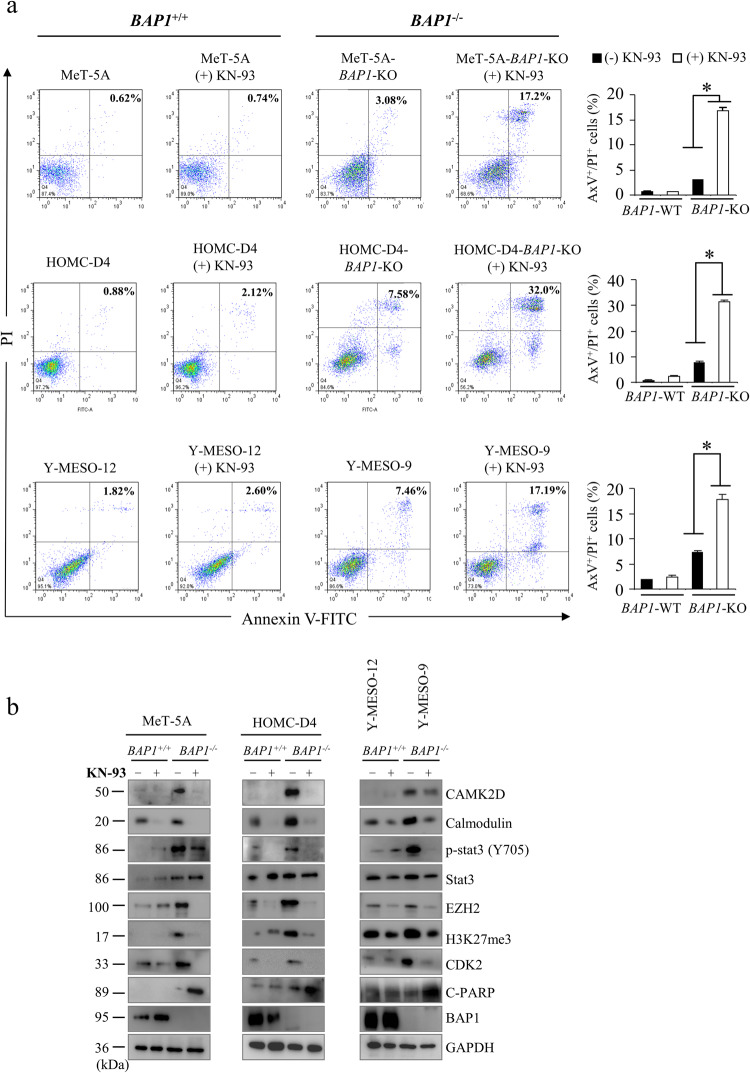
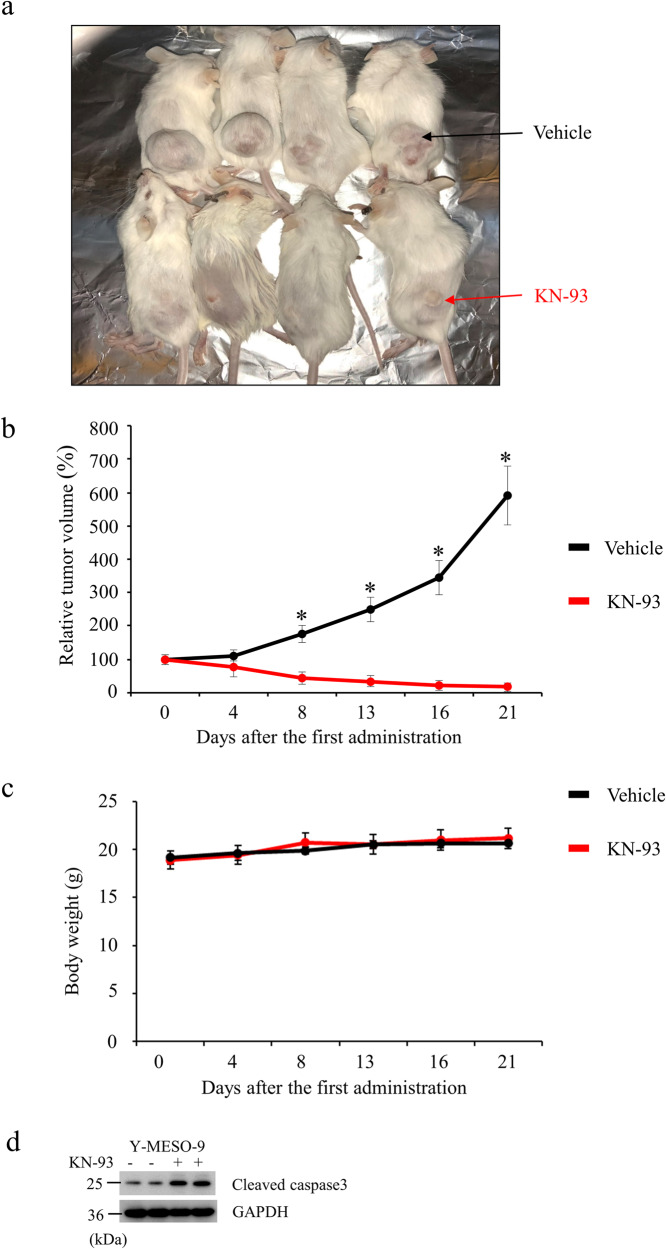
Malignant mesothelioma (MMe) is a rare but aggressive malignancy. Although the molecular genetics of MMe is known, including BRCA1-associated protein-1 (BAP1) gene alterations, the prognosis of MMe patients remains poor. Here, we generated BAP1 knockout (BAP1-KO) human mesothelial cell clones to develop molecular-targeted therapeutics based on genetic alterations in MMe. cDNA microarray and quantitative RT-PCR (qRT-PCR) analyses revealed high expression of a calcium/calmodulin-dependent protein kinase type II subunit delta (CAMK2D) gene in the BAP1-KO cells. CAMK2D was highly expressed in 70% of the human MMe tissues (56/80) and correlated with the loss of BAP1 expression, making it a potential diagnostic and therapeutic target for BAP1-deficient MMe. We screened an anticancer drugs library using BAP1-KO cells and successfully identified a CaMKII inhibitor, KN-93, which displayed a more potent and selective antiproliferative effect against BAP1-deficient cells than cisplatin or pemetrexed. KN-93 significantly suppressed the tumor growth in mice xenografted with BAP1-deficient MMe cells. This study is the first to provide a potential molecular-targeted therapeutic approach for BAP1-deficient MMe.


Conflict of interest statement

The authors declare no competing interests.

Figures

Fig. 1
Fig. 1. Generation of BAP1-KO cell clones and effect of BAP1 loss on the gene expression in human mesothelial cells.
a Generation of BAP1‐KO cell lines using the CRISPR/Cas9 system using a single guide RNA sequence against exon 4 of the BAP1 gene locus. b Establishment of BAP1-KO cell clones using human mesothelial cell lines, MeT‐5A and HOMC-D4. BAP1 protein expression was determined by Western blot analysis using GAPDH as the internal control. c Gene expression analysis represented by heatmap of upregulated (seven genes; fold change, >3) and downregulated (40 genes, fold change, <0.1) genes in BAP1‐KO cells (#1 and #2) compared with parental (P) and BAP1-WT (Ctrl) cells. The heatmap was constructed based on the normalized values of all samples using TreeView (Cluster 3.0) http://jtreeview (http://jtreeview.sourceforge.net). The corresponding upregulated or downregulated genes in the heatmap are shown on the right side. d RT-PCR analysis for mRNA expression levels of upregulated or downregulated genes in the MeT-5A and HOMC-D4 cells. Representative agarose gels for the RT-PCR products from the parental cells (P), BAP1-WT cells (Ctrl), and BAP1-KO cell lines (#1 and #2) are shown.
Fig. 2
Fig. 2. Upregulation of CAMK2D in BAP1-KO MMe cells.
a qRT-PCR analysis of CAMK2D using SYBR Green-based method showing the relative gene expression levels after normalization to GAPDH expression. The relative transcript levels were calculated by comparing the mean values with those from parental cells. Data are expressed as mean ± SE (n = 3). Asterisks indicate significant differences between BAP1-KO#1 and exogenous BAP1/BAP1-KO#1 cells (*p < 0.05). b Western blot analysis for CAMK2D, EZH2, H3K27me3, and BAP1 protein expression in parental (P) and BAP1-WT (Ctrl) and BAP1‐KO (#1 and #2) cells. c Effect of exogenous BAP1 expression on EZH2, H3K27me3, and CAMK2D protein expression in BAP1-KO cells. V.C. indicates mock vector control.
Fig. 3
Fig. 3. Relationship between BAP1 and CAMK2D expression in MMe tissues.
a Assessment of CAMK2D mRNA expression status in MMe patients with or without BAP1 mutation using a public database. The raw fluorescence intensity representing CAMK2D expression in the specimens from BAP1-intact and BAP1-mutant MMe patients is shown. A public dataset ID (TCGA-MESO.htseq fpkm-uq.tsv) of specimens from BAP1-mutant patients was obtained, formatted, and analyzed. Box and whisker plots of the relative gene expression levels of CAMK2D in BAP1-intact (BAP1-Intact, n = 58; blue) and BAP1-mutated (BAP1-Mut, n = 23; red) MMe patients; the middle line and the error bars indicate the mean and standard deviation, respectively. Asterisks indicate significant differences between BAP1-intact and BAP1-mutated patients (*P < 0.05). b, c Representative results of immunohistochemical (IHC) analysis for BAP1 (left panels) and CAMK2D (right panels) expression in a normal mesothelial tissue (b) and MMe tissues from cases #25 and #29 (c). d Summary of IHC results for BAP1 and CAMK2D expression in MMe tissues. Immunoreactivity was independently evaluated by two investigators. Staining intensity was scored as strong (3+), moderate (2+), weak (1+), or negative (0). The bar graph represents the proportion (%) of BAP1-negative or -positive (strong, moderate, and weak) cases with CAMK2D-positive expression (strong, moderate, and weak) in MMe tissues.
Fig. 4
Fig. 4. Identification of CaMKII inhibitor KN-93 against BAP1-deficient cells and the effect of KN-93 on cell survival of MMe cell lines.
a Screening assay with the Screening Committee of Anticancer Drugs (SCADS) library. The MeT-5A cells (BAP1-KO and parental cells) were treated in the presence or absence of 363 chemical compounds (10 μM each), and the cell survival percentages were calculated after normalization to the mean optical densities in the untreated cells (arbitrarily defined as 100%). The results are shown as differential percentages of cell survival between BAP1-WT and BAP1-KO cells. The red spot indicates >50% reduction of cell viability in BAP1-KO cells compared with BAP1-WT cells. b Western blot analysis for CAMK2D and BAP1 expression in the mesothelial and MMe cell lines using GAPDH as the internal control. c The effect of a CAMKII inhibitor KN-93 on the survival of MMe cell lines. Percentages of cell survival were calculated as described above. d The effect of cisplatin, pemetrexed, and KN-93 (Cells were incubated with the indicated concentrations (20, 15, 10, 7.5, 5, 2.5, 1.25, 0.625, and 0 μM) of each drug for 72 h) on the survival of MeT-5A, HOMC-D4, Y-MESO-12, Y-MESO-14, NCI-H2452, ACC-MESO-4, MeT-5A-BAP1-KO, HOMC-D4-BAP1-KO, and Y-MESO-9 cells. MTT assays were performed according to the manufacturer’s instructions. The absorbance was measured at 595 nm using a spectrophotometer. The cell survival percentages were calculated as described above. Black, red, and blue lines indicate cisplatin, pemetrexed, and KN-93, respectively. Data are expressed as the mean ± SE (n = 3). Asterisks indicate significant differences in the efficacy between cisplatin/pemetrexed and KN-93. *p < 0.05.
Fig. 5
Fig. 5. Effect of KN-93 on apoptosis in BAP1-deficient MMe cells.
a Flow cytometry analysis. The representative results of AxV-PI-based staining-based FACS analysis are shown on the left. The graphs on the right show the percentages of AxV+/PI+ apoptotic cells after treating the cells with KN-93 (7.5 µM) for 48 h, measured using FACS CantoII. Data are expressed as the mean ± SE (n = 3). Asterisks indicate significant differences between BAP1-deficient cells (BAP1-KO Met-5A and HOMC-D4 cells and Y-MESO-9 cells). *p < 0.05. b Western blot analysis for BAP1, CAMK2D, calmodulin, p-STAT3, STAT3, EZH2, H3k27me3, CDK2, and c-PARP protein expression in MeT-5A, MeT-5A-BAP1-KO, HOMC-D4, HOMC-D4-BAP1-KO, Y-MESO-12, and Y-MESO-9 cells treated with KN-93 (7.5 µM) for 48 h.
Fig. 6
Fig. 6. Effect of KN-93 on the tumor growth of Y-MESO-9 cells in vivo.
Y-MESO-9 cells (BAP1−/−, 1 × 107 cells/mouse) were subcutaneously xenografted into SCID mice. After the tumor volume reached 100 mm3 (day 0), KN-93 (15 mg/kg body weight) or vehicle (PBS) was intraperitoneally administered on days 0, 4, 8,13, and 16 into xenografted mice. a A representative picture of tumor-bearing xenografted mice in each group is shown. b, c Line graphs show (b) the relative tumor volume and (c) the body weight of mice during the treatment with KN-93. The tumor volume is expressed relative to the tumor size at day 0, arbitrarily defined as 100%. Data are expressed as the mean ± SE (n = 4).). *p < 0.05. d Western blot analysis using cleaved caspase3 showing the efficacy of KN-93 in tumor.

References

    1. Carbone M, Baris YI, Bertino P, Brass B, Comertpay S, Dogan AU, et al. Erionite exposure in North Dakota and Turkish villages with mesothelioma. Proc Natl Acad Sci USA. 2011;108:13618–23. doi: 10.1073/pnas.1105887108. - DOI - PMC - PubMed
    1. Carbone M, Yang H. Molecular pathways: targeting mechanisms of asbestos and erionite carcinogenesis in mesothelioma. Clin Cancer Res. 2012;18:598–604. doi: 10.1158/1078-0432.CCR-11-2259. - DOI - PMC - PubMed
    1. Kukuyan A-M, Sementino E, Kadariya Y, Menges CW, Cheung M, Tan Y, et al. Inactivation of Bap1 cooperates with losses of Nf2 and Cdkn2a to drive the development of pleural malignant mesothelioma in conditional mouse models. Cancer Res. 2019;79:4113–23.. doi: 10.1158/0008-5472.CAN-18-4093. - DOI - PMC - PubMed
    1. Carbone M, Adusumilli PS, Alexander HR, Jr, Baas P, Bardelli F, Bononi A, et al. Mesothelioma: scientific clues for prevention, diagnosis, and therapy. CA: A Cancer J Clin. 2019;69:402–29.. - PMC - PubMed
    1. Driscoll T, Nelson DI, Steenland K, Leigh J, Concha-Barrientos M, Fingerhut M, et al. The global burden of disease due to occupational carcinogens. Am J Ind Med. 2005;48:419–31. doi: 10.1002/ajim.20209. - DOI - PubMed