. 2023 Jul 21;14(1):4416.
doi: 10.1038/s41467-023-39934-z.

Elastin stabilization prevents impaired biomechanics in human pulmonary arteries and pulmonary hypertension in rats with left heart disease

Affiliations

Elastin stabilization prevents impaired biomechanics in human pulmonary arteries and pulmonary hypertension in rats with left heart disease

Mariya M Kucherenko et al. Nat Commun. .

Abstract

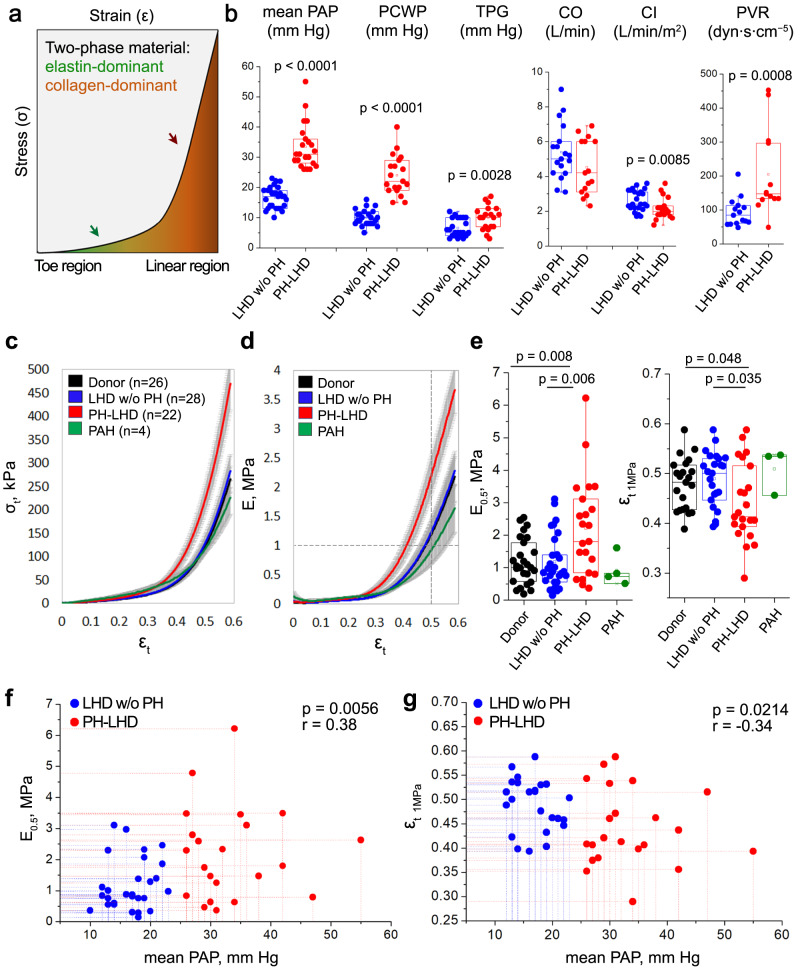
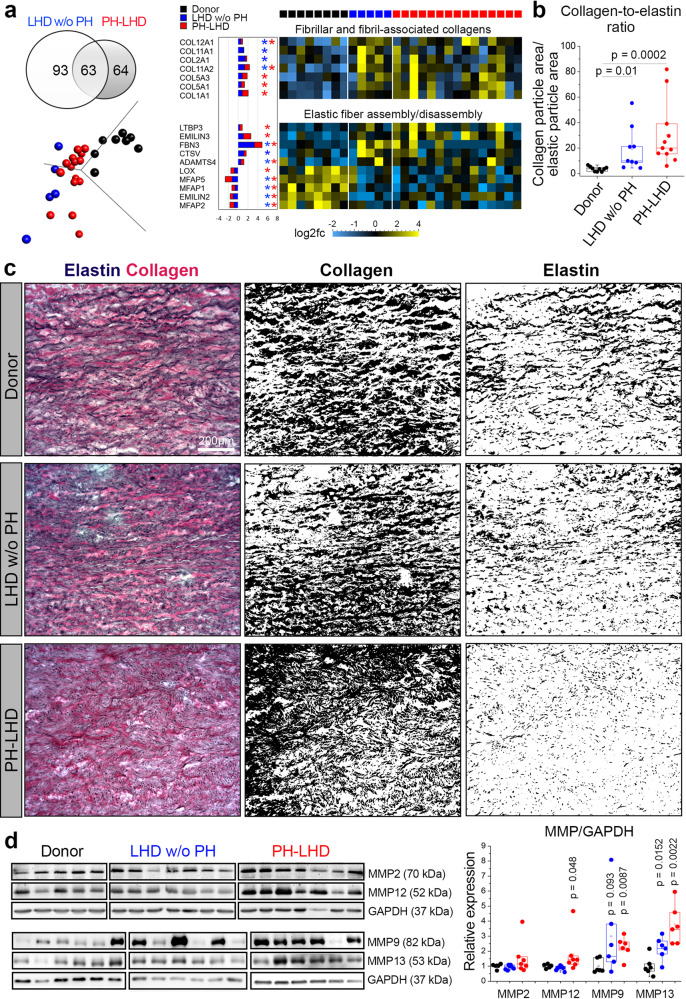
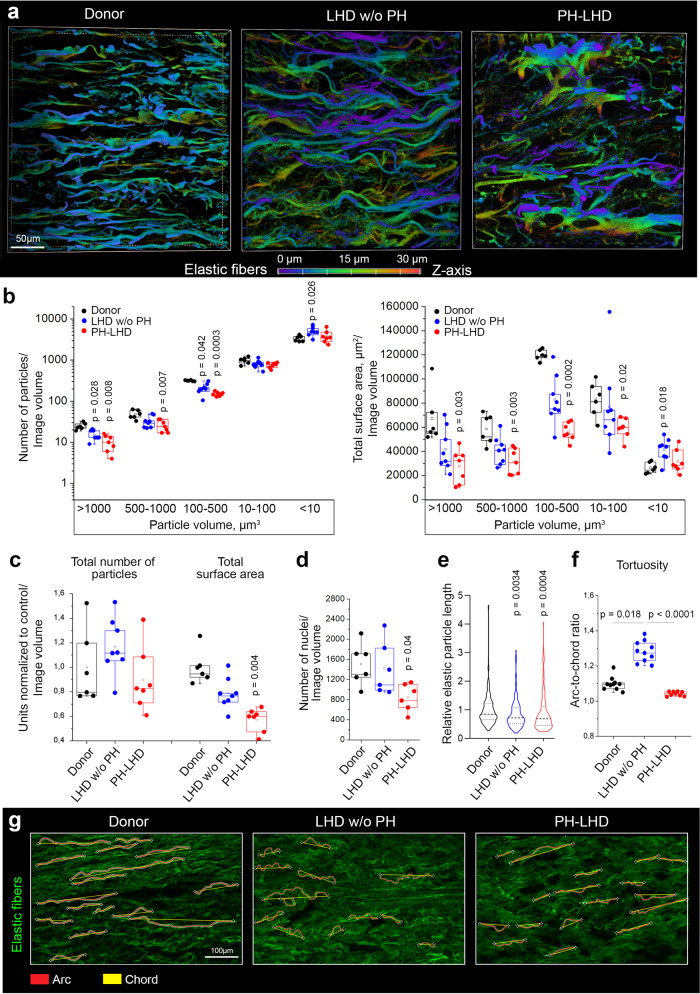
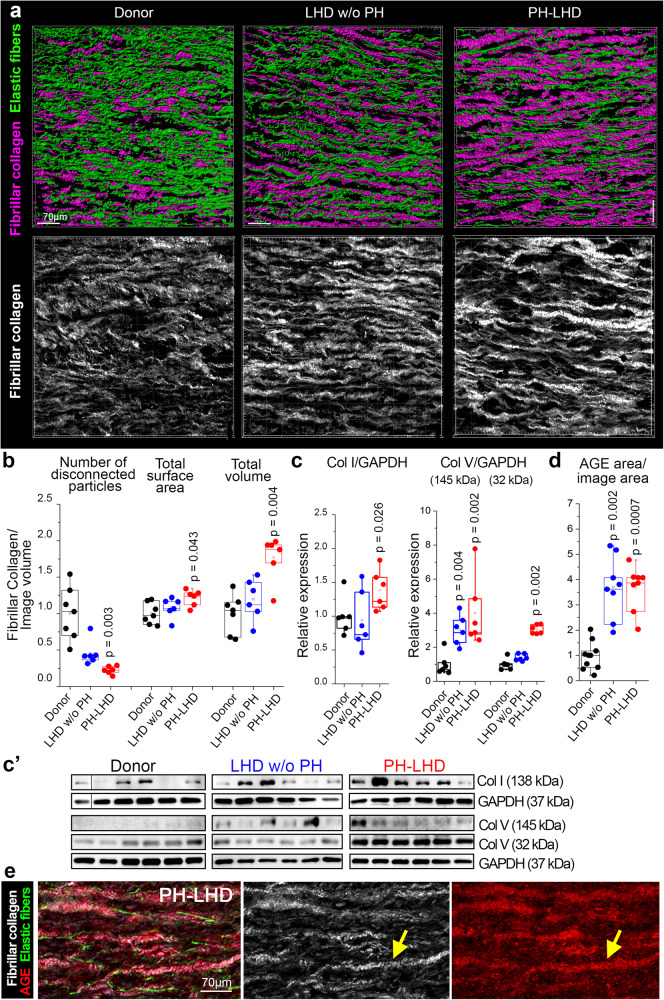
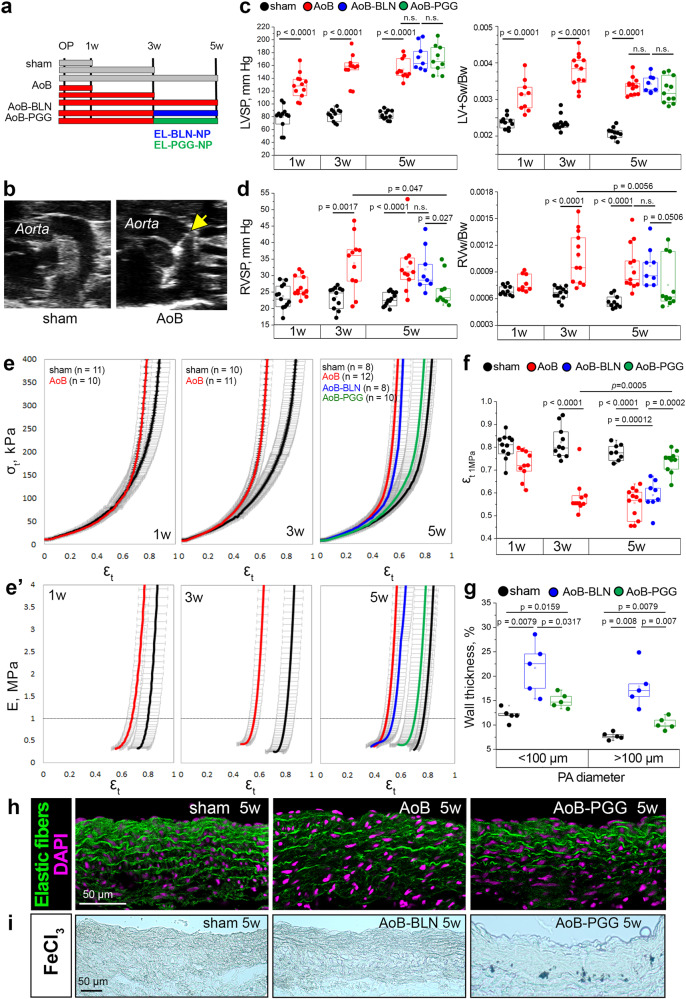
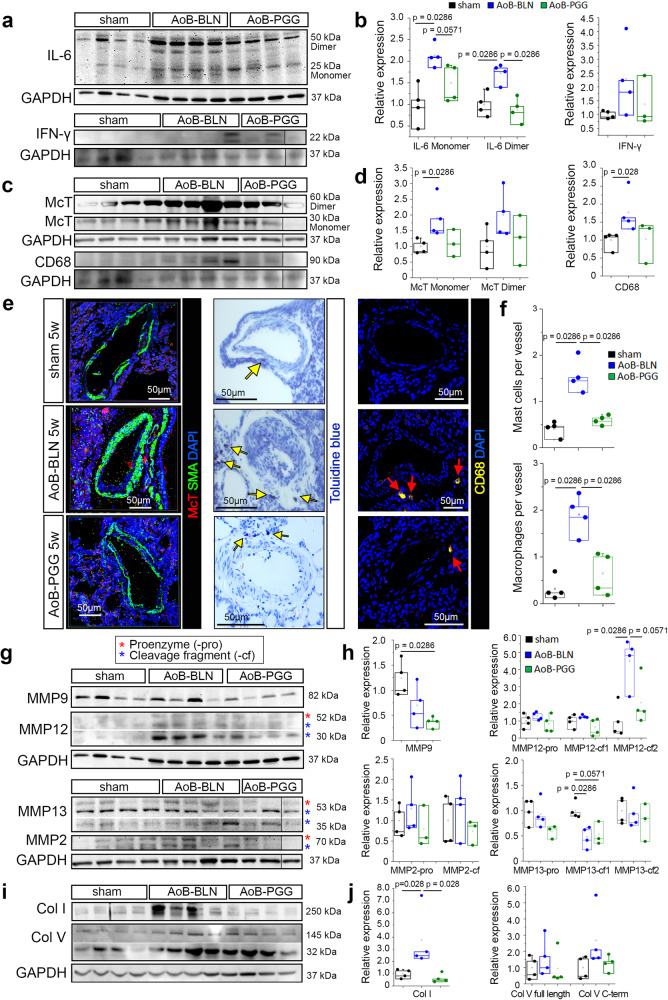
Pulmonary hypertension worsens outcome in left heart disease. Stiffening of the pulmonary artery may drive this pathology by increasing right ventricular dysfunction and lung vascular remodeling. Here we show increased stiffness of pulmonary arteries from patients with left heart disease that correlates with impaired pulmonary hemodynamics. Extracellular matrix remodeling in the pulmonary arterial wall, manifested by dysregulated genes implicated in elastin degradation, precedes the onset of pulmonary hypertension. The resulting degradation of elastic fibers is paralleled by an accumulation of fibrillar collagens. Pentagalloyl glucose preserves arterial elastic fibers from elastolysis, reduces inflammation and collagen accumulation, improves pulmonary artery biomechanics, and normalizes right ventricular and pulmonary hemodynamics in a rat model of pulmonary hypertension due to left heart disease. Thus, targeting extracellular matrix remodeling may present a therapeutic approach for pulmonary hypertension due to left heart disease.


Conflict of interest statement

N.R.V. holds significant equity in Elastrin Therapeutics Inc. which has licensed elastin-targeted nanoparticle therapy for cardiovascular and pulmonary conditions. V.F. receives remuneration, consultancy fees, and/or travel support outside the submitted work from Abbott GmbH & Co. KG, Novartis Pharma GmbH, Medtronic GmbH, Biotronic SE &Co., Boston Scientific, Edwards Lifesciences, Berlin Heart, JOTEC GmbH, Zurich Heart. M.M.K., W.M.K., and C.K. have filed a European Patent application (P30606WO) on “Pentagalloyl glucose (PGG) for use in the treatment of pulmonary hypertension”. The remaining authors declare no competing interests.

Figures

Fig. 1
Fig. 1. Conduit pulmonary arteries are stiffened in PH-LHD.
a Schematic illustration depicting the typical stress/strain curve of a conduit artery undergoing a uniaxial tensile test. The toe region (green) reflects the tensile properties of primarily elastin-enriched material, while the linear region (brown) is dominated by collagen-enriched material. b Box-and-whisker plots show pulmonary hemodynamics and cardiac function in patients with LHD w/o PH or PH-LHD. Groups differ in mean pulmonary arterial pressure (mean PAP, p < 0.0001, LHD w/o PH n = 28, PH-LHD n = 22 patients), pulmonary capillary wedge pressure (PCWP, p < 0.0001, LHD w/o PH n = 23, PH-LHD n = 19 patients), transpulmonary gradient (TPG, p = 0.0028, LHD w/o PH n = 23, PH-LHD n = 19 patients), pulmonary vascular resistance (PVR, p = 0.0008, LHD w/o PH n = 15, PH-LHD n = 13 patients), and cardiac index (CI, p = 0.0085, LHD w/o PH n = 18, PH-LHD n = 15 patients). c Group data show σtt curves (mean ± SEM) for biologically independent PA samples from donors (n = 26), LHD w/o PH (n = 28), PH-LHD (n = 22), or PAH (n = 4) patients. d Group data show corresponding E/εt curves (mean ± SEM) for biologically independent PA samples from donors (n = 26), LHD w/o PH patients (n = 28), PH-LHD patients (n = 22), or PAH patients (n = 4). Dashed lines indicate 0.5 εt for which individual stiffness (E0.5) was derived, and 1 MPa stiffness for which corresponding individual true strain (εt 1MPa) is reported. e Box-and-whisker plots show E0.5 in biologically independent PA samples from donors (n = 26), LHD w/o PH (n = 28), PH-LHD (n = 22), or PAH (n = 4) patients (p = 0.008 for PH-LHD vs. donor and p = 0.006 for PH-LHD vs. LHD w/o PH) and εt 1MPa in biologically independent PA samples from donors (n = 22), LHD w/o PH (n = 24), PH-LHD (n = 22), and PAH (n = 4) patients (p = 0.048 for PH-LHD vs. donor and p = 0.035 for PH-LHD vs. LHD w/o PH). fg Scatter diagrams show the relationship between mean PAP and parameters of pulmonary arterial biomechanics, namely, E0.5 (n = 50 patients/biologically independent PA samples, r = 0.38, p = 0.0056, 95% CI = 0.1124 to 0.6053) and εt 1MPa (n = 46 patients/biologically independent PA samples, r = −0.34, p = 0.0214, 95% CI = −0.5784 to 0.04450). Box-and-whisker plots overlaid with dot plots (b, e) show individual data points, mean (rectangle), median (line within the box), lower and upper 25% quartiles (limits of the box), 1.5 IQR (whiskers), and outliers (if applicable). Statistics: b, e Unpaired two-tailed Mann–Whitney U-test; fg Spearman’s coefficient of correlation Rho (r) and corresponding two-tailed statistics. Source data are provided as a Source Data file.
Fig. 2
Fig. 2. Transcriptional regulation of pulmonary artery stiffening.
a Venn diagram showing the numbers of genes involved in ECM remodeling that are differentially expressed in PA samples of LHD w/o PH patients vs. PH-LHD patients. A principal component analysis (PCA) plot depicts sample clustering based on ECM gene expression profiles. Heat maps display log2-fold changes in the expression of fibrillar and fibril-associated collagens and genes involved in elastic fiber assembly/disassembly in PA samples of LHD w/o PH and PH-LHD patients relative to donor samples. b Box-and-whisker plot showing the collagen-to-elastin ratio in biologically independent PA samples from donors (n = 9), LHD w/o PH (n = 9), or PH-LHD (n = 11) patients (p = 0.01 for LHD w/o PH vs. donor, and p = 0.0002 for PH-LHD vs. donor). c Representative images of EVG-stained PA medial walls from a donor, an LHD w/o PH patient, and a PH-LHD patient (left panels). The center panels show collagen-positive area only, right panels show elastic fibers only. Notably, the combination of hematoxylin with EVG also stains cell nuclei, which are hence included in the elastin stain signal on the right panel. The presented images are derived from biologically independent PA samples from donors (n = 9), LHD w/o PH (n = 9), and PH-LHD (n = 11) patients. d Immunoblots show protein levels of MMP2 (70 kDa), MMP12 (52 kDa), and GAPDH (loading control, 37 kDa) in biologically independent PA samples from donors (n = 5), LHD w/o PH (n = 7), and PH-LHD (n = 7) patients and MMP9 (82 kDa), MMP13 (53 kDa), and GAPDH (loading control, 37 kDa) in biologically independent PA samples from donors (n = 6), LHD w/o PH (n = 6), and PH-LHD (n = 6) patients. Box-and-whisker plots show quantitative densitometric data of MMP expression normalized to GAPDH and the mean of the donor controls. MMP expression differs between groups as follows: MMP12 (p = 0.048 for PH-LHD vs. donor), MMP9 (p = 0.093 for LHD w/o PH vs. donor and p = 0.0087 for PH-LHD vs. donor), MMP13 (p = 0.0152 for LHD w/o PH vs. donor and p = 0.0022 for PH-LHD vs. donor). Box-and-whisker plots overlaid with dot plots (b, d) show individual data points, mean (rectangle), median (line within the box), lower and upper 25% quartiles (limits of the box), 1.5 IQR (whiskers), and outliers (if applicable). Statistics: b Unpaired two-tailed Kruskal-Wallis one-way ANOVA on ranks followed by pairwise multiple comparisons (Dunn’s test). d Unpaired two-tailed Mann–Whitney U test (vs. donor). Source data are provided as a Source Data file. Full scan blots are provided in Suppl. Fig. 12.
Fig. 3
Fig. 3. Progressive fragmentation and degradation of elastic fibers.
a Representative images show elastic fibers in arterial wall media as detected by autofluorescence in the PA of a donor, an LHD w/o PH patient, and a PH-LHD patient. Pseudocolors reflect the vertical depth of fibers in the z-axis (scale). b Box-and-whisker plots show the number and surface area of elastic particles classified by volume in biologically independent PA samples from donors (n = 6), LHD w/o PH (n = 8), and PH-LHD (n = 7) patients. The corresponding p-values for statistical comparisons between LHD w/o PH or PH-LHD groups vs. donors are given. c Box-and-whisker plots show the total number and total surface area of elastic fibers in biologically independent PA samples from donors (n = 6), LHD w/o PH (n = 8), and PH-LHD (n = 7) patients normalized to donor control (p = 0.004 for PH-LHD vs. donor). d Box-and-whisker plot shows numbers of nuclei as quantified by DRAQ5 staining in biologically independent PA samples from donors (n = 6), LHD w/o PH (n = 6) and PH-LHD (n = 6) patients (p = 0.04 for PH-LHD vs. donor). e Violine plot shows the distribution of elastic particle lengths in PA samples from donors (n = 195 particles examined in 4 biologically independent samples), LHD w/o PH (n = 143 particles examined in 3 biologically independent samples), and PH-LHD (n = 133 particles examined in 3 biologically independent samples) patients (p = 0.0034 for LHD w/o PH vs. donor and p = 0.0004 for PH-LHD vs. donor). f Box-and-whisker plot showing elastic fiber tortuosity measured as the arc-to-chord ratio in biologically independent PA samples from donors (n = 10), LHD w/o PH (n = 10) and PH-LHD (n = 9) patients (p = 0.018 for LHD w/o PH vs. donor, and p < 0.0001 for PH-LHD vs. LHD w/o PH). g Single-plane confocal images show elastic fibers as detected by autofluorescence with corresponding arc (red) and chord (yellow) lengths. Images are derived from biologically independent PA samples from donors (n = 10), LHD w/o PH (n = 10), and PH-LHD (n = 9) patients. Box-and-whisker plots overlaid with dot plots (bd, f) show individual data points, mean (rectangle), median (line within the box), lower and upper 25% quartiles (limits of the box), 1.5 IQR (whiskers), and outliers (if applicable); violine plot (e) shows median (dashed line) and lower and upper 25% quartiles (dotted lines).Statistics: bf Unpaired two-tailed Kruskal-Wallis one-way ANOVA on ranks followed by pairwise comparisons vs. donor. Source data are provided as a Source Data file.
Fig. 4
Fig. 4. Increased deposition of fibrillar collagen.
a Representative images show (upper panel) exemplary 3D reconstruction of fibrillar collagen and (lower panel) volume reconstructions of both fibrillar collagen and elastic fiber networks in the arterial media as detected by SHG and autofluorescence, respectively, in the PA of a donor, an LHD w/o PH patient, and a PH-LHD patient. b Box-and-whisker plots show the number of disconnected collagen particles, total surface area, and total volume of fibrillar collagen normalized to control and to image volume in the PA of a donor, an LHD w/o PH patient, and a PH-LHD patient. cc’ Immunoblots show protein levels of Col I (138 kDa), full length (145 kDa), and C-terminal truncation product (32 kDa) of Col V, and loading control GAPDH (37 kDa) in biologically independent PA samples from donors (n = 6), LHD w/o PH (n = 6), and PH-LHD (n = 6) patients. Box-and-whisker plots show quantitative densitometric data of Col I and Col V expression (normalized to GAPDH and to the mean of the donor controls) in biologically independent PA samples from donors (n = 6), LHD w/o PH (n = 6), and PH-LHD (n = 6) patients. Collagen expression differs between groups as follows: Col I (p = 0.026 for PH-LHD vs. donor), Col V 145 kDa (p = 0.004 for LHD w/o PH vs. donor, and p = 0.002 for PH-LHD vs. donor), and Col V 32 kDa (p = 0.002 for PH-LHD vs. donor). d Box-and-whisker plots show area of anti-AGE immunostaining normalized to area of the image and to donor controls in biologically independent PA samples from donors (n = 10), LHD w/o PH (n = 8), and PH-LHD (n = 8) patients (p = 0.0014 for LHD w/o PH vs. donor and p = 0.0004 for PH-LHD vs. donor). e Representative images of the arterial media in a PA sample from a PH-LHD patient show co-localization of anti-AGE immunostaining (right) with fibrillar collagen (center). Similar co-localization was confirmed in biologically independent PA samples from n = 11 LHD w/o PH or PH-LHD patients. Box-and-whisker plots overlaid with dot plots (bd) show individual data points, mean (rectangle), median (line within the box), lower and upper 25% quartiles (limits of the box), 1.5 IQR (whiskers), and outliers (if applicable). Statistics: b, d Unpaired two-tailed Kruskal–Wallis one-way ANOVA on ranks followed by pairwise multiple comparisons (Dunn’s test); c Unpaired two-tailed Mann–Whitney U test (vs. donor). Source data are provided as a Source Data file. Full scan blots are provided in Suppl. Fig. 12.
Fig. 5
Fig. 5. Targeted delivery of PGG attenuates PA stiffening and PH in a rat model of PH-LHD.
a Schematic depiction of the experimental protocol. Animals underwent sham surgery for AoB with or without PGG treatment and were analyzed after 1 week (1w; sham, AoB), 3 weeks (3w; sham, AoB), or 5 weeks (5w; sham, AoB, AoB-BLN, AoB-PGG). OP, operation (AoB or sham); blue and green bars indicate the time interval of EL-BLN-NP or EL-PGG-NP treatment. b Representative echocardiographic images show clip placement (yellow arrow) on the ascending aorta in AoB animals compared to sham rats. c, d Box-and-whisker plots show left (LVSP) and right (RVSP) ventricular systolic pressures assessed by cardiac catheterization in 1w sham (n = 12), 1w AoB (n = 12), 3w sham (n = 12), 3w AoB (n = 11), 5w sham (n = 12), 5w AoB (n = 11), 5w AoB-BLN (n = 8), and 5w AoB-PGG (n = 9) animals. Left (LV+Sw/Bw) and right (RVw/Bw) ventricular weights normalized to body weight assessed in 1w sham (n = 10), 1w AoB (n = 9), 3w sham (n = 12), 3w AoB (n = 12), 5w sham (n = 10), 5w AoB (n = 12), 5w AoB-BLN (n = 8), and 5w AoB-PGG (n = 11) animals. Parameters differ between groups as follows: LVSP and LVw+S/Bw (p < 0.0001 for 1w AoB vs. 1w sham, 3w AoB vs. 3w sham, and 5w AoB vs. 5w sham), RVSP (p = 0.0017 for 3w AoB vs. 3w sham, p < 0.0001 for 5w AoB vs. 5w sham, p = 0.027 for 5w AoB-PGG vs. 5w AoB-BLN, and p = 0.047 for 5w AoB-PGG vs. 3w AoB), RVw/Bw (p < 0.0001 for 3w AoB vs. 3w sham, p < 0.0001 for 5w AoB vs. 5w sham, p = 0.0506 for 5w AoB-PGG vs. 5w AoB-BLN, and p = 0.0056 for 5w AoB-PGG vs. 3w AoB). e Group data show σtt curves (mean ± SD) for PAs of AoB and sham animals at 1, 3, and 5 weeks after surgery, and AoB-BLN and AoB-PGG rats after 5 weeks. e’, Group data show corresponding E/εt (mean ± SD) for PAs of AoB and sham animals at 1, 3, and 5 weeks after surgery, and AoB-BLN and AoB-PGG rats after 5 weeks. Dashed lines indicate 1 MPa stiffness E for which the corresponding strain (εt 1MPa) is reported. f Box-and-whisker plots show εt 1MPa in biologically independent PA samples from 1w sham (n = 11), 1w AoB (n = 10), 3w sham (n = 10), 3w AoB (n = 11), 5w sham (n = 8), 5w AoB (n = 12), 5w AoB-BLN (n = 8), and 5w AoB-PGG (n = 10) animals (p < 0.0001 for 3w AoB vs. 3w sham and 3w AoB vs. 5w sham, p = 0.00012 for 5w AoB-BLN vs. 5w sham, p = 0.0002 for 5w AoB-PGG vs. 5w AoB-BLN, and p = 0.0005 for 5w AoB-PGG vs. 3w AoB). g Box-and-whisker plots show PA wall thickness (quantified relative to arterial diameter in %) in the lungs of sham (n = 5), AoB-BLN (n = 5), and AoB-PGG (n = 5) animals. Each dot represents the average value per animal. h Representative images show elastic fibers as visualized by autofluorescence in the PAs of sham, AoB, and AoB-PGG rats 5 weeks after surgery. Nuclei are stained by DAPI. The phenotype was confirmed in n = 3 animals per study group. i Representative bright-field microscopy images show the PA from a sham rat, an AoB rat, and an AoB-PGG rat 5 weeks post AoB. PGG was detected by FeCl3 staining in the PAs of AoB-PGG rats. Results were replicated in 2 animals per group. Box-and-whisker plots overlaid with dot plots (c-d, f, g) show individual data points, mean (rectangle), median (line within the box), lower and upper 25% quartiles (limits of the box), 1.5 IQR (whiskers) and outliers (if applicable). Statistics: c, d, f, g Unpaired two-tailed Mann–Whitney U test. Source data are provided as a Source Data file.
Fig. 6
Fig. 6. Treatment with PGG improves pulmonary arterial biomechanics and hemodynamics in a rat model of PH-LHD.
a Representative M-mode images acquired by transthoracic echocardiography display dimensions of the LV walls and LV cavity in an AoB-PGG rat at 3 weeks and 5 weeks after surgery. In comparison to 3 weeks, LV shortening was notably reduced at 5 weeks. b M-mode images show PA distensibility in an AoB-PGG rat before (3w) and after (5w) PGG treatment. Yellow arrow points to the clip on the aorta. c Representative images show pulmonary blood flow as detected by pulse-wave and color Doppler echocardiography and the analysis of pulmonary acceleration time (PAT) and pulmonary ejection time (PET) parameters in an AoB-PGG rat before (3w) and after (5w) PGG treatment. dg Line graphs show longitudinal changes in left ventricular fractional shortening (LVFS), left ventricular ejection fraction (LVEF), pulmonary artery radial strain (PARS), PAT, PAT/PET, and tricuspid annular plane systolic excursion (TAPSE) in AoB-BLN (n = 9) and AoB-PGG (n = 11) animals before (3w) and after (5w) treatment with either vehicle or PGG. Changes between 3 and 5 weeks were detected as follows: LVFS and LVEF (p = 0.0039 for AoB-BLN and p = 0.001 for AoB-PGG), PARS (p = 0.0078 for AoB-BLN and p = 0.0186 for AoB-PGG), PAT (p = 0.0049 for AoB-PGG), PAT/PET (p = 0.0703 for AoB-PGG), and TAPSE (p = 0.0039 for AoB-BLN). Statistics: dg Two-tailed Wilcoxon matched-pairs signed rank test. Source data are provided as a Source Data file.
Fig. 7
Fig. 7. PGG treatment restores homeostasis in lungs of PH-LHD rats.
a Immunoblots show protein levels of IL-6 (50 kDa dimer and 25 kDa monomer) in lungs of sham (n = 4), AoB-BLN (n = 4), and AoB-PGG (n = 4) animals, IFN-γ (22 kDa) in lungs of sham (n = 4), AoB-BLN (n = 4), and AoB-PGG (n = 3) animals, and corresponding loading control GAPDH (37 kDa). b Box-and-whisker plots show quantitative densitometric data for IL-6 (dimer and monomer) and IFN-γ expression normalized to GAPDH and to the mean of the donor controls. IL-6 protein expression differs between groups as follows: monomer (p = 0.0286 for AoB-BLN vs. sham, p = 0.0571 for AoB-PGG vs. AoB-BLN) and dimer (p = 0.0286 for AoB-BLN vs. sham, p = 0.0286 for AoB-PGG vs. AoB-BLN). c Immunoblots show protein levels of McT (60 kDa dimer and 30 kDa monomer), CD68 (90 kDa), and loading control GAPDH (37 kDa) in lungs of sham (n = 4), AoB-BLN (n = 4), and AoB-PGG (n = 3) animals. d Box-and-whisker plots show quantitative densitometric data for McT (dimer and monomer) and CD68 expression (normalized to GAPDH and to the mean of the donor controls). McT monomer and CD68 protein expression differ between groups as follows: p = 0.0268 for AoB-BLN vs. sham. e Images show mast cells visualized by McT (red) immunofluorescence or Toluidine blue (dark violet) staining, and macrophages detected by CD68 (yellow) immunofluorescent staining in the perivascular space of PAs in lungs of sham, AoB-BLN, and AoB-PGG rats. SMA (green) marks SMCs in the arterial wall, DAPI (blue) marks nuclei. Yellow arrows point to quantified mast cells and red arrows point to quantified macrophages. f Box-and-whisker plots show number of mast cells and macrophages surrounding pulmonary vessels of <200 µm diameter in lungs of sham (n = 4), AoB-BLN (n = 4), and AoB-PGG (n = 4) animals (p = 0.0268 for AoB-BLN vs. sham and for AoB-PGG vs. AoB-BLN). g Immunoblots show protein levels of MMP9 (82 kDa) and MMP12 (54 kDa proenzyme and 45 and 29 kDa cleaved fragments) in lungs of sham (n = 4), AoB-BLN (n = 4), and AoB-PGG (n = 4) animals, and MMP2 (70 kDa proenzyme and 65 kDa cleaved fragment) and MMP13 (53 kDa proenzyme and 48 kDa and 35 kDa cleaved fragments) in lungs of sham (n = 4), AoB-BLN (n = 4), and AoB-PGG (n = 3) animals, and corresponding GAPDH (37 kDa) loading controls. h Box-and-whisker plots show quantitative densitometric data for the expression of MMP2, MMP9, MMP12, and MMP13 proenzymes (-pro) and cleaved fragments (-cf) normalized to GAPDH and to the mean of the donor controls. MMP expression differs between groups as follows: MMP2 (p = 0.0286 for AoB-PGG vs. sham), MMP12-cf2 (p = 0.0286 for AoB-BLN vs. sham and for AoB-PGG vs. AoB-BLN), MMP13-cf1 (p = 0.0286 for AoB-BLN vs. sham, p = 0.0571 for AoB-PGG vs. sham). i Immunoblots show protein levels of Col I (250 kDa), Col V (145 kDa full length and 32 kDa C-terminal cleaved fragment), and loading control GAPDH (37 kDa, corresponding to Col V blot) in lungs of sham (n = 4), AoB-BLN (n = 4), and AoB-PGG (n = 4) animals. j Box-and-whisker plots show quantitative densitometric data for the expression of Col I normalized to Ponceau S and Col V (full length and C-terminal fragment) normalized to GAPDH and to the mean of the donor controls (p = 0.0286 for AoB-BLN vs. sham and for AoB-PGG vs. AoB-BLN). Box-and-whisker plots overlaid with dot plots (b, d, f, h, j) show individual data points, mean (rectangle), median (line within the box), lower and upper 25% quartiles (limits of the box), 1.5 IQR (whiskers) and outliers (if applicable). Statistics: Unpaired two-tailed Mann-Whitney U test. Source data are provided as a Source Data file. Full scan blots are provided in Suppl. Fig. 12.

References

    1. Karnik SK, et al. A critical role for elastin signaling in vascular morphogenesis and disease. Development. 2003;130:411–423. doi: 10.1242/dev.00223. - DOI - PubMed
    1. Karnik SK, et al. Elastin induces myofibrillogenesis via a specific domain, VGVAPG. Matrix Biol. 2003;22:409–425. doi: 10.1016/S0945-053X(03)00076-3. - DOI - PubMed
    1. Midwood KS, Schwarzbauer JE. Elastic fibers: building bridges between cells and their matrix. Curr. Biol. 2002;12:R279–R281. doi: 10.1016/S0960-9822(02)00800-X. - DOI - PubMed
    1. Clark JM, Glagov S. Transmural organization of the arterial media. The lamellar unit revisited. Arteriosclerosis. 1985;5:19–34. doi: 10.1161/01.ATV.5.1.19. - DOI - PubMed
    1. Armentano RL, et al. Assessment of elastin and collagen contribution to aortic elasticity in conscious dogs. Am. J. Physiol. 1991;260:H1870–H1877. - PubMed

Publication types