. 2023 Jul 21;14(1):4422.
doi: 10.1038/s41467-023-40144-w.

Representations in human primary visual cortex drift over time

Affiliations

Representations in human primary visual cortex drift over time

Zvi N Roth et al. Nat Commun. .

Abstract

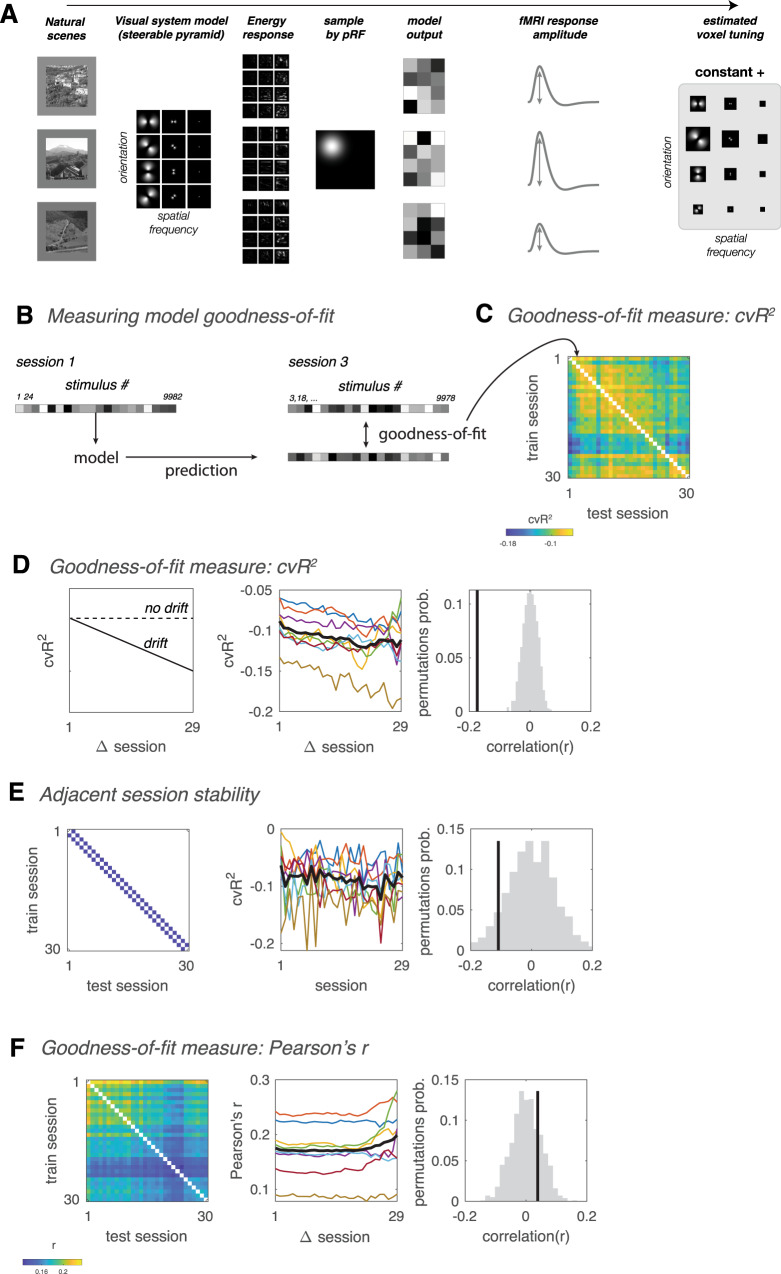
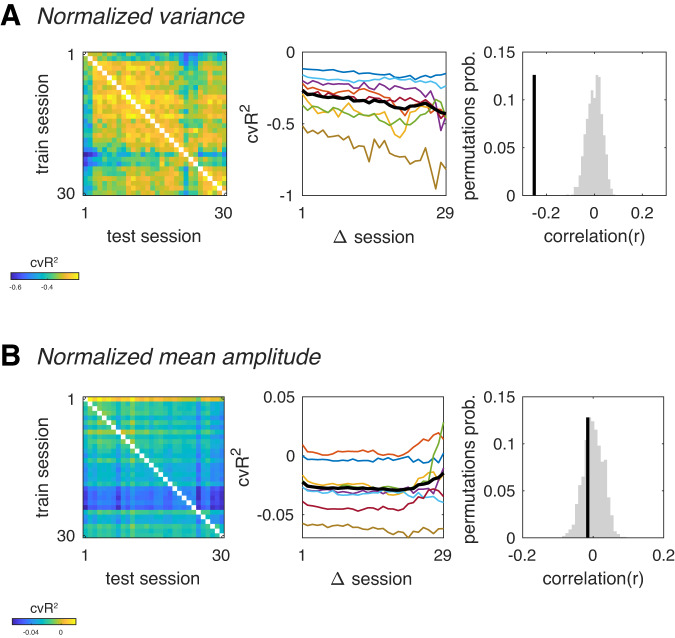
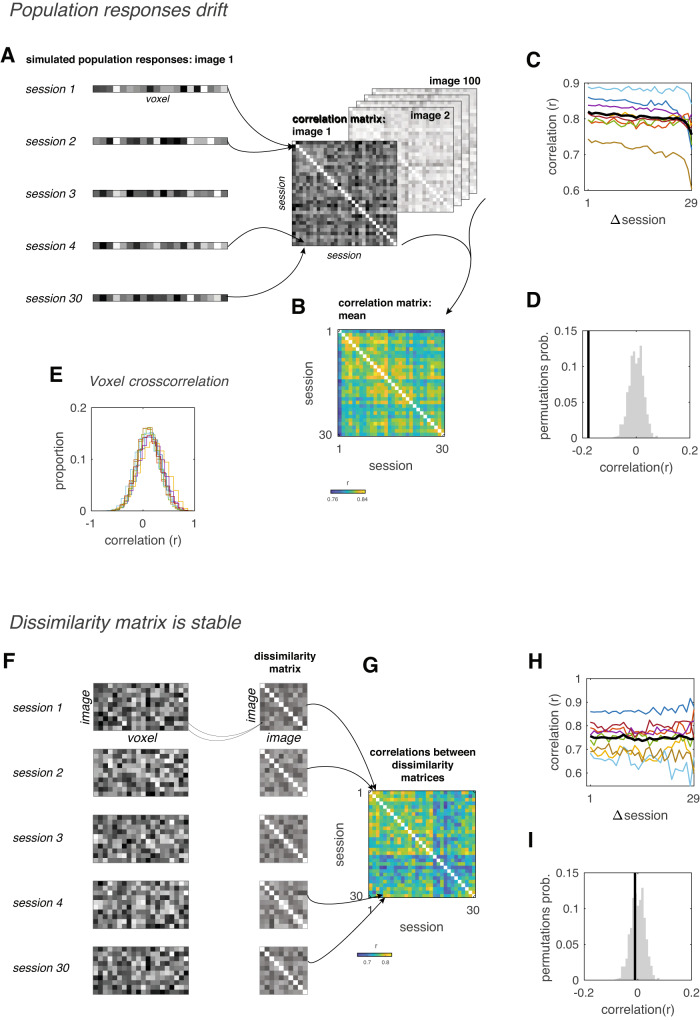
Primary sensory regions are believed to instantiate stable neural representations, yet a number of recent rodent studies suggest instead that representations drift over time. To test whether sensory representations are stable in human visual cortex, we analyzed a large longitudinal dataset of fMRI responses to images of natural scenes. We fit the fMRI responses using an image-computable encoding model and tested how well the model generalized across sessions. We found systematic changes in model fits that exhibited cumulative drift over many months. Convergent analyses pinpoint changes in neural responsivity as the source of the drift, while population-level representational dissimilarities between visual stimuli were unchanged. These observations suggest that downstream cortical areas may read-out a stable representation, even as representations within V1 exhibit drift.


Conflict of interest statement

The authors declare no competing interests.

Figures

Fig. 1
Fig. 1. Changes in cross-session generalization indicate representational drift.
A Model-fitting pipeline for a single fMRI voxel timeseries measurement. Input consisted of images viewed by a particular subject in a particular session. Filter outputs were sampled by the pRF. The model assigns weights for each orientation and spatial frequency filter by multiple linear regression, using model outputs to predict response amplitudes. Example images shown here were created by the authors for illustration only and were not used in the study. B The model is trained independently on each session, and then tested on each other session. C Goodness-of-fit matrix, quantified by cross-validated R2 (cvR2), testing how well the model trained on each session predicted responses in all other sessions. Different diagonals of the matrix correspond to different numbers of intervening sessions between training and testing. Goodness-of-fit matrices were computed for each subject as the median of all V1 voxels, and averaged across subjects. D Representations drift across sessions when quantified by cvR2. Left, Schematic illustrating representational drift (solid line, cvR2 decreases systematically with number of intervening sessions), and representational stability (dotted line, cvR2 remains constant). Middle, Mean cvR2 as function of number of intervening sessions between train and test sessions. Colored lines, individual subjects; black line, mean across subjects. Predictive power of models decreases with number of intervening sessions, indicating representational drift (r = −0.17, p < 0.001). Drift was significant (p < 0.05) for all 8 individual subjects. Right, Black vertical line, empirical correlation between goodness-of-fit and number of intervening sessions. Gray histogram, null distribution of correlation values computed by randomizing the order of sessions 1000 times. Correlation was computed using all off-diagonal matrix values for each subject, and averaged across subjects. E Signal-to-noise ratio does not consistently decrease (or increase) across sessions. Left, Diagonals of the goodness-of-fit matrix corresponding to training and testing on adjacent sessions. Middle, Performance of model trained and tested on adjacent sessions, as function of earlier session of the two. Model performance does not systematically decrease across sessions (r = −0.11, p = 0.086). Right, Black vertical line, empirical correlation between adjacent-session performance and number of intervening sessions. Gray histogram, null distribution of correlation values. F Same as B, quantifying goodness-of-fit with Pearson’s correlation instead of cvR2 values. With this measure predictive power does not decrease with time (r = 0.04, p = 0.774). Source data are provided as a Source Data file.
Fig. 2
Fig. 2. Normalizing response amplitude, but not variance, removes drift.
A Cross-session generalization after normalizing each session’s variance. Left, goodness-of-fit matrix after normalizing each voxel’s response variance within each session. Center, Mean cvR2 as function of number of intervening sessions between train and test sessions. Model predictive power decreases with time, indicating representational drift (r = −0.25, p < 0.001). Gray lines, individual subjects; thick black line, mean across subjects. Right, Black vertical line, empirical correlation between goodness-of-fit and number of intervening sessions. Gray histogram, null distribution of correlation values. B Cross-session generalization after subtracting each session’s mean response amplitude (i.e. mean beta). Left, goodness-of-fit matrix after subtracting each voxel’s mean response within each session. Center, Mean cvR2 as function of number of intervening sessions between train and test sessions. After subtracting each voxel’s mean, predictive power of V1 models no longer decrease with time (r = −0.02, p = 0.287). Source data are provided as a Source Data file.
Fig. 3
Fig. 3. Top, Population responses drift across sessions.
A Schematic illustration of analysis pipeline. Population responses to 100 images were simulated using the model weights estimated from each session. For each image, correlations were computed between all sessions, yielding a correlation matrix. These matrices were then averaged across all 100 images. B Empirical population response correlation matrix. C Correlation drops as function of number of intervening sessions, reflecting representational drift of population responses (r = −0.18, p < 0.001). D Null distribution of correlation values. Black vertical line, empirical correlation between population response correlations and number of intervening sessions. Gray histogram, null distribution of correlation values computed by randomizing order of sessions 1000 times. Bottom, representational dissimilarity matrices are stable across sessions. E Cross-correlation of voxels’ mean response amplitude across sessions. Each colored line is the distribution of cross-correlations for V1 voxels from a single subject. Some correlations are positive while others are negative, indicating that voxels are not undergoing a uniform change in mean response amplitude across the entire V1. F Schematic illustration of analysis pipeline. Simulated population responses to different images were correlated with each other, yielding a dissimilarity matrix for each individual session. Next, correlations were computed between each possible pair of dissimilarity matrices. G Empirical correlation matrix. H Correlation between dissimilarity matrices does not drop with increasing number of intervening sessions, indicating stability across sessions (r = −0.01, p = 0.339). I Null distribution of correlation values. Black vertical line, empirical correlation between dissimilarity matrix correlations and number of intervening sessions. Gray histogram, null distribution of correlation values computed by randomizing the order of sessions 1000 times. Source data are provided as a Source Data file.

References

    1. Ebrahimi S, et al. Emergent reliability in sensory cortical coding and inter-area communication. Nature. 2022;605:713–721. doi: 10.1038/s41586-022-04724-y. - DOI - PMC - PubMed
    1. Deitch D, Rubin A, Ziv Y. Representational drift in the mouse visual cortex. Curr. Biol. 2021;31:4327–4339.e4326. doi: 10.1016/j.cub.2021.07.062. - DOI - PubMed
    1. Marks TD, Goard MJ. Stimulus-dependent representational drift in primary visual cortex. Nat. Commun. 2021;12:5169. doi: 10.1038/s41467-021-25436-3. - DOI - PMC - PubMed
    1. Xia J, Marks TD, Goard MJ, Wessel R. Stable representation of a naturalistic movie emerges from episodic activity with gain variability. Nat. Commun. 2021;12:5170. doi: 10.1038/s41467-021-25437-2. - DOI - PMC - PubMed
    1. McMahon DB, Bondar IV, Afuwape OA, Ide DC, Leopold DA. One month in the life of a neuron: longitudinal single-unit electrophysiology in the monkey visual system. J. Neurophysiol. 2014;112:1748–1762. doi: 10.1152/jn.00052.2014. - DOI - PMC - PubMed

Publication types