. 2023 Jul 21;6(1):760.
doi: 10.1038/s42003-023-05124-2.

Single-cell sequencing reveals the landscape of the human brain metastatic microenvironment

Affiliations

Single-cell sequencing reveals the landscape of the human brain metastatic microenvironment

Qianqian Song et al. Commun Biol. .

Abstract

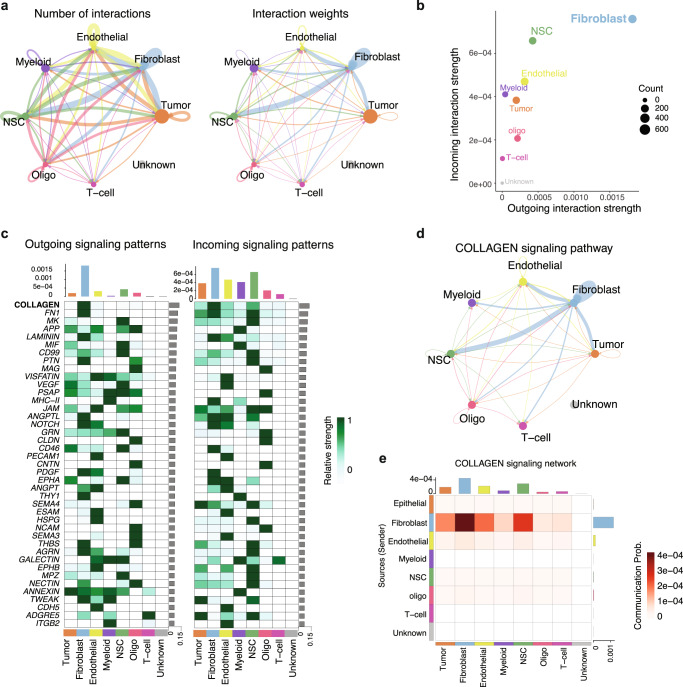
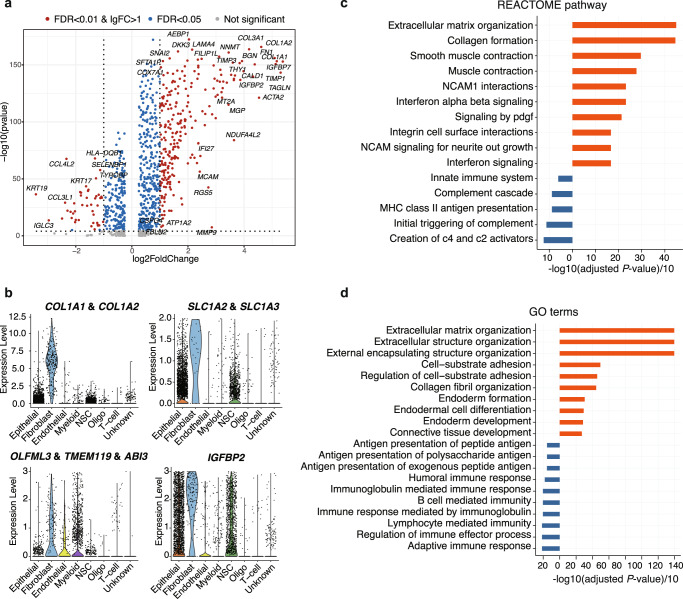
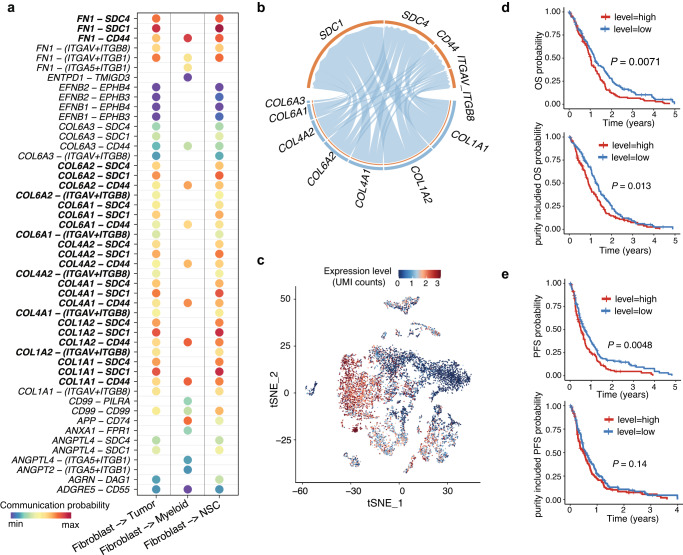
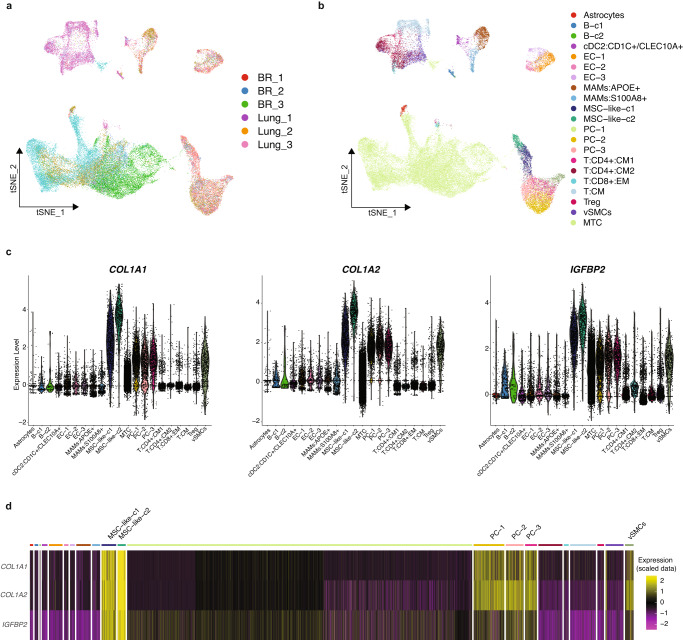
Brain metastases is the most common intracranial tumor and account for approximately 20% of all systematic cancer cases. It is a leading cause of death in advanced-stage cancer, resulting in a five-year overall survival rate below 10%. Therefore, there is a critical need to identify effective biomarkers that can support frequent surveillance and promote efficient drug guidance in brain metastasis. Recently, the remarkable breakthroughs in single-cell RNA-sequencing (scRNA-seq) technology have advanced our insights into the tumor microenvironment (TME) at single-cell resolution, which offers the potential to unravel the metastasis-related cellular crosstalk and provides the potential for improving therapeutic effects mediated by multifaceted cellular interactions within TME. In this study, we have applied scRNA-seq and profiled 10,896 cells collected from five brain tumor tissue samples originating from breast and lung cancers. Our analysis reveals the presence of various intratumoral components, including tumor cells, fibroblasts, myeloid cells, stromal cells expressing neural stem cell markers, as well as minor populations of oligodendrocytes and T cells. Interestingly, distinct cellular compositions are observed across different samples, indicating the influence of diverse cellular interactions on the infiltration patterns within the TME. Importantly, we identify tumor-associated fibroblasts in both our in-house dataset and external scRNA-seq datasets. These fibroblasts exhibit high expression of type I collagen genes, dominate cell-cell interactions within the TME via the type I collagen signaling axis, and facilitate the remodeling of the TME to a collagen-I-rich extracellular matrix similar to the original TME at primary sites. Additionally, we observe M1 activation in native microglial cells and infiltrated macrophages, which may contribute to a proinflammatory TME and the upregulation of collagen type I expression in fibroblasts. Furthermore, tumor cell-specific receptors exhibit a significant association with patient survival in both brain metastasis and native glioblastoma cases. Taken together, our comprehensive analyses identify type I collagen-secreting tumor-associated fibroblasts as key mediators in metastatic brain tumors and uncover tumor receptors that are potentially associated with patient survival. These discoveries provide potential biomarkers for effective therapeutic targets and intervention strategies.


Conflict of interest statement

The authors declare no competing interests.

Figures

Fig. 1
Fig. 1. Single-cell RNA-seq data analysis and cell annotation.
a t-SNE plot of the profiled single cells. Cells with the same colors are from the same patient specimen. b t-SNE plot of the identified cell clusters. Different colors represent different cell clusters. c The heatmap shows the gene signatures of each annotated cell type. d t-SNE plot of the annotated cell types. Different colors represent different cell types. e Cell compositions of annotated cell types in each brain metastasis specimen.
Fig. 2
Fig. 2. Inference of cell–cell communications in TME.
a Cell–cell communications between the identified cell types. b Illustration of the incoming and outgoing interaction strengths for each of the cell types. c The incoming and outgoing signaling pathways of each cell type. d The cell–cell interaction network among different cell types regarding the collagen signaling pathway. e The heatmap shows the communication probability of the collagen signaling pathway.
Fig. 3
Fig. 3. Characterization of tumor-associated fibroblasts.
a The volcano plot shows the differentially expressed genes (DEGs) between fibroblasts versus the rest of cells. The x-axis represents the log2 (fold change) of the DEGs and the y-axis represents the adjusted P-value (−1 × log10 scale). Blue dots represent genes with adjusted P-value < 0.05. Red dots represent the genes with adjusted P-value < 0.01 and |log2 FC|>1. b Violin plots show the expressions of functional genes that are abundant in fibroblasts. c Significantly enriched REACTOME pathways of the DEGs of fibroblasts are shown in bar plots. The x-axis represents -log10(adj. P)/10, which is calculated by the gene set enrichment test. d Significantly enriched GO terms of the DEGs of fibroblasts are shown in bar plots. The x-axis represents -log10(adj. P)/10, which is calculated by the gene set enrichment test.
Fig. 4
Fig. 4. Significant tumor receptors for patient’s prognosis.
a The significantly related ligand-receptor interactions of mostly communicated cell types. b Highly communicated ligand-receptor interactions between fibroblasts and tumor cells. c t-SNE plot shows the expressions of active tumor receptors including ITGAV, ITGB8, SDC1, SDC4, and CD44. d The upper panel shows the Kaplan-Meier (KM) overall survival curves for TCGA GBM patients, which are stratified by the median expression of the active tumor receptors. The lower panel shows the KM overall survival curves for GBM patients, which are stratified by the median expression of the active tumor receptors considering tumor purity. The y-axis represents the probability of overall survival, and the x-axis is time in days. e The upper panel shows the Kaplan-Meier (KM) progression-free survival (PFS) curves for GBM patients, which are stratified by the median expression of the active tumor receptors. The lower panel shows the KM PFS curves for GBM patients, which are stratified by the median expression of the active tumor receptors considering tumor purity. The y-axis represents the probability of PFS, and the x-axis is time in days.
Fig. 5
Fig. 5. Identification of tumor-associated fibroblasts in external scRNA-seq data.
a t-SNE plot of the profiled single cells. Cells with the same colors are from the same patient sample. b t-SNE plot of the identified cell identities. c Violin plots show the expressions of functional genes that are abundant in fibroblasts. d Heatmap shows the expressions of fibroblast signatures in each cell type.
Fig. 6
Fig. 6. Cell–cell communications in external scRNA-seq data.
a Cell–cell communications between different cell types. b Illustration of the incoming and outgoing interaction strengths between different cell types. c Cell–cell communications between the identified cell types with tumor cells. d Cell–cell communications between the mostly communicated cell types with tumor cells.
Fig. 7
Fig. 7. Ligand-receptor interactions identified in external scRNA-seq data.
a The significantly related ligand-receptor interactions of mostly communicated cell types with tumor cells. b Highly communicated ligand-receptor interactions between MSC−like−c2 cells and tumor cells. c Highly communicated collagen-based ligand-receptor interactions between MSC−like−c2 cells and tumor cells. MSC-like-c2 refers to mesenchymal stromal cell-like-c2 cells.

References

    1. Achrol AS, et al. Brain metastases. Nat. Rev. Dis. Prim. 2019;5:5. doi: 10.1038/s41572-018-0055-y. - DOI - PubMed
    1. Barnholtz-Sloan JS, et al. Incidence proportions of brain metastases in patients diagnosed (1973 to 2001) in the Metropolitan Detroit Cancer Surveillance System. J. Clin. Oncol. 2004;22:2865–2872. doi: 10.1200/JCO.2004.12.149. - DOI - PubMed
    1. Davis FG, Dolecek TA, McCarthy BJ, Villano JL. Toward determining the lifetime occurrence of metastatic brain tumors estimated from 2007 United States cancer incidence data. Neuro-Oncol. 2012;14:1171–1177. doi: 10.1093/neuonc/nos152. - DOI - PMC - PubMed
    1. Ellis TL, Neal MT, Chan MD. The role of surgery, radiosurgery and whole brain radiation therapy in the management of patients with metastatic brain tumors. Int J. Surg. Oncol. 2012;2012:952345. - PMC - PubMed
    1. Chamberlain MC, Baik CS, Gadi VK, Bhatia S, Chow LQ. Systemic therapy of brain metastases: non-small cell lung cancer, breast cancer, and melanoma. Neuro Oncol. 2017;19:i1–i24. doi: 10.1093/neuonc/now197. - DOI - PMC - PubMed

Publication types

Substances