. 2023 Jul 21;13(1):11803.
doi: 10.1038/s41598-023-38854-8.

Free viewing biases for complex scenes in preschoolers and adults

Affiliations

Free viewing biases for complex scenes in preschoolers and adults

Marcel Linka et al. Sci Rep. .

Abstract

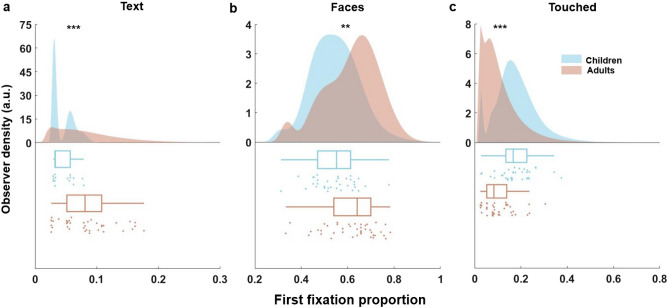
Adult gaze behaviour towards naturalistic scenes is highly biased towards semantic object classes. Little is known about the ontological development of these biases, nor about group-level differences in gaze behaviour between adults and preschoolers. Here, we let preschoolers (n = 34, age 5 years) and adults (n = 42, age 18-59 years) freely view 40 complex scenes containing objects with different semantic attributes to compare their fixation behaviour. Results show that preschool children allocate a significantly smaller proportion of dwell time and first fixations on Text and instead fixate Faces, Touched objects, Hands and Bodies more. A predictive model of object fixations controlling for a range of potential confounds suggests that most of these differences can be explained by drastically reduced text salience in pre-schoolers and that this effect is independent of low-level salience. These findings are in line with a developmental attentional antagonism between text and body parts (touched objects and hands in particular), which resonates with recent findings regarding 'cortical recycling'. We discuss this and other potential mechanisms driving salience differences between children and adults.


Conflict of interest statement

The authors declare no competing interests.

Figures

Figure 1
Figure 1
Pixel masks and heat maps showing group-wise fixations for two example images. Example stimuli on the left-hand side depict overlaid pixel masks for objects of the semantic dimensions: Text (green), Faces (red), Touched (violet), Hands (blue) and Bodies (cyan). Heat maps in the middle show corresponding duration weighted fixation data from children, maps on the right-hand side show fixations from adults. The transparent white scatters show all first fixations towards the image by all subjects of the respective group. Please note the increased gaze towards touched objects/hands and moving objects in the heatmaps for children, as well as the lower levels of text fixations compared to those of adults. Heatmaps and pixel mask overlays were created using MATLAB R2019B (MathWorks).
Figure 2
Figure 2
Differences in gaze behaviour along three semantic dimensions. Density plots showing the probability distribution of cumulative dwell time proportion towards objects of the dimensions Face (a), Text (b), and Touched (c) respectively for children (blue) and adults (red). Data points below the distributions indicate the individual dwell time proportion. Box plots depict the summary statistics for each dimension and group. For a respective box plot, the vertical line indicates the mean cumulative dwell time proportion. The left side of the box indicates the 25th percentile and the right side the 75th percentile. The whiskers represent the minimum and maximum values. *p < 0.05, **p < 0.01, ***p < 0.001 (Holm-Bonferroni corrected; see Methods).
Figure 3
Figure 3
Differences between children and adults in first fixation proportion for three semantic dimensions. Density plots show the probability distribution of first fixation proportion towards Faces (a), Text (b) and Touched objects (c) respectively for children (blue) and adults (red). Box plots below show an overview of the summary statistics for each group and semantic dimension; the vertical line within a respective box represents the mean value. The left side of a box indicates the 25th percentile and the right side the 75th percentile. The whiskers represent the minimum and maximum values. Data points represent the individual corresponding first fixation proportions. *p < 0.05, **p < 0.01, ***p < 0.001 (Holm-Bonferroni corrected; see Methods).
Figure 4
Figure 4
Group differences in gaze behavior towards hands and bodies. Density plots showing the probability distributions of cumulative dwell time (a, b) and first fixation proportion (c, d) towards objects of the dimensions Hands (a, c) and Bodies (b, d) for children (blue) and adults (red). Data points depicted below indicate the individual dwell time and first fixation proportion towards the respective dimension. Corresponding box plots above the data points show an overview of the summary statistics for each group and semantic category; the vertical line within a box represents the mean value. The left side of a box indicates the 25th percentile and the right side the 75th percentile. The whiskers represent the minimum and maximum values. *p < 0.05, **p < 0.01, ***p < 0.001 (Holm-Bonferroni corrected; see Methods).
Figure 5
Figure 5
Group differences in predicting object-directed dwell time and first fixations. Bar plots depicting the beta estimates of a given object feature x Age Group interaction, which describe the difference in estimates between children and adults for a given object property. Panel a shows the interaction estimates for the LMM predicting object-directed dwell time and panel b depicts the binomial GLMM predicting first fixations towards objects after image onset across the included predictors Text, Faces, Touched, Hands and Bodies as well as Object-image centroid eccentricity (Ecc), (Object-) Size and graph-based visual salience (GBVS). Asterisks indicate the significance of a given group x predictor interaction. Results of (G)LMMs that did not take into account the effect of Text can be found in the supplementary materials. Error bars represent the 95% confidence intervals. *p < 0.05, **p < 0.01, ***p < 0.001.
Figure 6
Figure 6
Label overlap across semantic categories. Heatmap showing the percentage of mutual label assignments. Each row shows the shared labels for all fixations bearing a given label. For example, the bottom row shows which percentage of Bodies fixations were also labelled as Face, Text, Touched and so on. Note, here we have calculated the proportion of fixations of a given category that is also labelled another category either (1) because the objects have several labels or (2) the fixation fell on several objects of different labels. The heatmap was created using MATLAB R2019B (MathWorks).

References

    1. Strasburger H, Rentschler I, Jüttner M. Peripheral vision and pattern recognition: A review. J. Vis. 2011;11:13. doi: 10.1167/11.5.13. - DOI - PMC - PubMed
    1. Rosenholtz R. Capabilities and limitations of peripheral vision. Annu. Rev. Vis. Sci. 2016;2:437–457. doi: 10.1146/annurev-vision-082114-035733. - DOI - PubMed
    1. Harel, J., Koch, C. & Perona, P. Graph-based visual saliency. Adv. Neural Inform. Process. Syst19 (2006).
    1. Itti L, Koch C, Itti L, Koch C. A saliency-based mechanism for overt and covert shifts of visual attention. Vis. Res. 2000;40:1489–1506. doi: 10.1016/S0042-6989(99)00163-7. - DOI - PubMed
    1. Xu J, Jiang M, Wang S, Kankanhalli M, Zhao Q. Predicting human gaze beyond pixels. J. Vis. 2014;14:28–28. doi: 10.1167/14.1.28. - DOI - PubMed

Publication types