. 2023 Aug;71(8):431-450.
doi: 10.1369/00221554231189310. Epub 2023 Jul 22.

Altered Expression of Heme Oxygenase 2 in Heme Oxygenase 1-deficient Mouse Embryos

Affiliations

Altered Expression of Heme Oxygenase 2 in Heme Oxygenase 1-deficient Mouse Embryos

Meenakshi Rana et al. J Histochem Cytochem. 2023 Aug.

Abstract

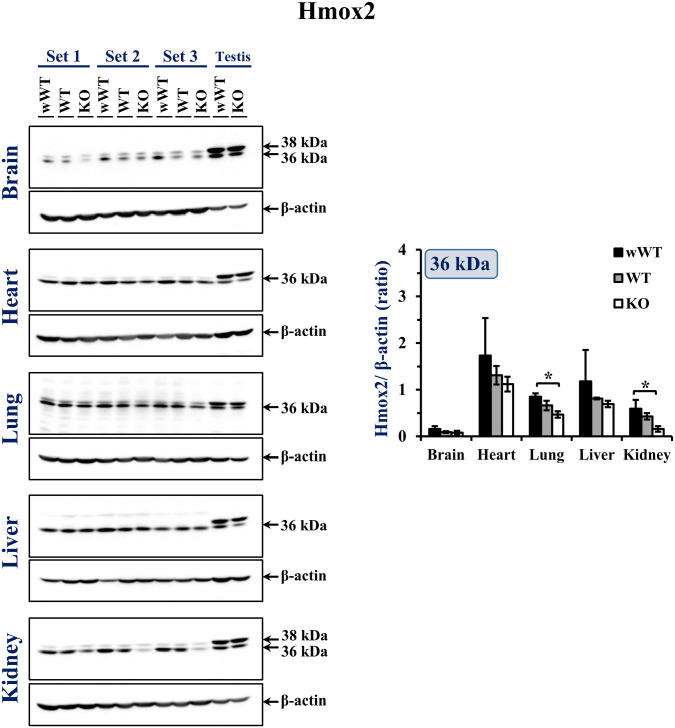
Heme oxygenases (Hmoxs) are enzymes that catalyze the first and rate-limiting step in the degradation of heme to carbon monoxide, iron, and biliverdin. The two main isozymes, namely Hmox1 and Hmox2, are encoded by two different genes. Mutation of the Hmox1 gene in mice is known to cause extensive prenatal lethality, and limited information is available about the expression of Hmox proteins in developing mouse embryos. In this study, immunohistochemistry was used to perform a detailed investigation comparing Hmox proteins in Hmox1 wild-type and knockout (KO) mouse embryos collected from wild-type and heterozygous timed-matings. Western analysis for Hmoxs was also done in the organs of late-gestation embryos. The results demonstrated cytoplasmic and nuclear localization of Hmoxs in all the organs examined in wild-type embryos. Interestingly, Hmox2 immunoreactive protein signals were significantly low in most of the organs of mid- and late-gestation Hmox1-KO embryos. Furthermore, relative levels of Hmox2 were revealed to be significantly lower in the lung and kidney of late-gestation Hmox1-KO embryos by western analysis, which complemented the immunohistochemistry findings in these two organs. The current study provides detailed immunoexpression patterns of Hmox proteins in wild-type and Hmox1-KO mouse embryos in mid- and late-gestation.

Keywords: heme oxygenase; immunohistochemistry; knockout; mouse embryos; phenotype.


Conflict of interest statement

The author(s) declared no potential conflicts of interest with respect to the research, authorship, and/or publication of this article.

Figures

Figure 1.
Figure 1.
Immunohistochemical staining of para- and mid-sagittal sections (5 µm) of 12.5 dpc wWT (B and C), WT (E and F), and KO (H and I) embryos with Hmox1 antibody. A, D, and G are no primary antibody controls. The regions of the organs that were imaged at higher magnification for cellular details are indicated in the whole-mount images. (J, K) Corpus striatum: The cell types are difficult to identify and distinguish without cell type–specific markers in the brain. (L, M) Heart: Cardiac muscle (CM) cells of the muscular region of the ventricles are visible, and the nuclei (n) of the same are indicated with red arrows. (N, O) Lung bud (lb): The epithelial cells (ec) lining the lb are indicated with black arrows, and the lung mesenchyme is marked by me. (P, Q) Liver: The sinusoids are indicated by a red asterisk, and the liver parenchyma is marked as p. Other regions identified at this stage that are labeled in H and I: cc—central canal of spinal cord; cs—corpus striatum; drg—dorsal root ganglion; fv—fourth ventricle; h—heart; li—liver; lv—lateral ventricle; lb—lung bud; mb—midbrain; mo—medulla oblongata; rnc—roof of neopallial cortex; sc—spinal cord; t—tail; to—tongue. IHC was done on three embryos of each genotype and a representative of each genotype is presented in this figure. Scale bars: A to I—1 mm; J to Q—50 µm. Abbreviations: IHC, immunohistochemistry; KO, knockout; WT, wild-type.
Figure 2.
Figure 2.
Immunohistochemical staining of para- and mid-sagittal sections (5 µm) of 12.5 dpc wWT (A and B), WT (C and D), and KO (E and F) embryos with Hmox2 antibody. The regions of the organs that were imaged at higher magnification for cellular details are indicated in the whole-mount images. (G to I) Corpus striatum: The cell types are difficult to identify and distinguish without cell type–specific markers in the brain. (J to L) Heart: Cardiac muscle (CM) cells of the muscular region of the ventricles are visible, and the nuclei (n) of the same are indicated with red arrows. (M to O) Lung bud (lb): The epithelial cells (ec) lining the lb are indicated with black arrows, and the lung mesenchyme is marked by me. (P to R) Liver: The sinusoids are indicated by a red asterisk, and the liver parenchyma is marked as p. IHC was done on three embryos of each genotype and a representative of each genotype is presented in this figure. Scale bars: A to F—1 mm; G to R—50 µm. Abbreviations: IHC, immunohistochemistry; KO, knockout; WT, wild-type.
Figure 3.
Figure 3.
Immunohistochemical staining of para- and mid-sagittal sections (5 µm) of 18.5 dpc wWT (B and C), WT (E and F), and KO (H and I) embryos with Hmox1 antibody. A, D, and G are no primary antibody controls. (J, K) Lung: The alveoli (al) are clearly visible; however, it is difficult to distinguish between epithelial and mesenchymal cells in areas surrounding them. Epithelial cells of the bronchiole (br) are indicated by black arrows. (L, M) Liver: Individually scattered megakaryocytes (Me) are indicated with blue arrows, and the liver parenchyma is marked as p. (N, O) Kidney cortex: Proximal or distal convoluted tubules (pct/dct) and glomeruli (g) are indicated by red and yellow arrows, respectively, and the cortex parenchyma is marked as p. (P, Q) Kidney medulla: Mostly, radially arranged collecting ducts (cd) indicated by green arrows are visible in the medulla. Other regions identified at this stage that are labeled in H and I:; bf—deposits of brown fat; f—forelimb; fb—forebrain; h—heart; hb—hindbrain; k—kidney; li—liver; lu—lung; mb—midbrain; sc—spinal cord; t—tail; tg—thymus gland; to—tongue. IHC was done on three embryos of each genotype and a representative of each genotype is presented in this figure. The higher magnification images of the forebrain and heart regions (indicated with an asterisk in C and F) are presented in Fig. A3. Scale bars: A to I—2 mm; J to Q—50 µm. Abbreviations: IHC, immunohistochemistry; KO, knockout; WT, wild-type.
Figure 4.
Figure 4.
Immunohistochemical staining of para- and mid-sagittal sections (5 µm) of 18.5 dpc wWT (A and B), WT (C and D), and KO (E and F) embryos with Hmox2 antibody. The regions of the organs that were imaged at higher magnification for cellular details are indicated in the whole-mount images. (G to I) Lung: The alveoli (al) are clearly visible and the epithelial cells of the bronchiole (br) are indicated by black arrows. (J to L) Individually scattered megakaryocytes (me) are indicated with blue arrows, and the liver parenchyma is marked as p. (M to O) Kidney cortex: Proximal or distal convoluted tubules (pct/dct) and glomeruli (g) are indicated by red and yellow arrows, respectively, and the cortex parenchyma is marked as p. (P to R) Kidney medulla: Mostly, radially arranged collecting ducts (cd) indicated by green arrows are visible in the medulla. IHC was done on three embryos of each genotype and a representative of each genotype is presented in this figure. The higher magnification images of the forebrain and heart (indicated with an asterisk in B, D, and F) are presented in Fig. A3. Scale bars: A to F—2 mm; G to R—50 µm. Abbreviations: IHC, immunohistochemistry; KO, knockout; WT, wild-type.
Figure 5.
Figure 5.
Semi-quantitative analysis of immunohistochemistry results of 12.5 and 18.5 dpc embryos. Three images in each organ were taken for each section and quantitated using ImageJ. The immunoreactive signals for the analyzed proteins in the various organs of wWT, WT, and KO embryo sections are plotted as mean integrated density × 108 ± SEM (n=3 biological replicates). An asterisk indicates significant difference between three groups as determined by Student’s t-test (Hmox1) or Tukey’s post hoc test (Hmox2). Statistical significance was determined at *p<0.05. Abbreviations: KO, knockout; WT, wild-type.
Figure 6.
Figure 6.
Western blots of Hmox1 in brain, heart, lung, liver, and kidney of 18.5 dpc BL/6, wWT, and WT embryos with the corresponding β-actin blots. The positions of the samples are indicated. Spleen samples (10 µg) in the last two lanes of each blot were from wWT and KO adult mouse. The integrated signal intensities of the bands were quantitated using Amersham Imager 600 software. The ratio of integrated signal intensities of Hmox1 to β-actin was calculated and plotted as mean ± SD (n=3 biological replicates) in a clustered bar graph. Statistical significance was determined at p<0.05. Asterisk (*) and hash (#) indicate significant difference between two groups as determined by Tukey’s HSD post hoc test and Student’s t-test, respectively. Abbreviations: HSD, honest significance test; KO, knockout; WT, wild-type.
Figure 7.
Figure 7.
Western blots of Hmox2 in brain, heart, lung, liver, and kidney of 18.5 dpc wWT, WT, and KO embryos with the corresponding β-actin blots. The positions of the samples are indicated. Testis samples (40 µg) in the last two lanes of each blot were from wWT and KO adult mouse. The integrated signal intensities of the bands were quantitated using Amersham Imager 600 software. The ratio of integrated signal intensities of Hmox2 to β-actin was calculated and plotted as mean ± SD (n=3 biological replicates) in a clustered bar graph. Statistical significance was determined at p<0.05. Asterisk (*) indicates significant difference between two groups as determined by Tukey’s HSD post hoc test. Abbreviations: HSD, honest significance test; KO, knockout; WT, wild-type.
Appendix Figure A1.
Appendix Figure A1.
A representative gel demonstrating the genotype determination of 12.5 and 18.5 dpc embryos by agarose gel electrophoresis of multiplex polymerase chain reaction (PCR) products. DNA was isolated from yolk sac samples of the embryos and 2 μl of the same was used as template in multiplex PCR. The PCR products were analyzed on 2% agarose gel. Amplicons are indicated by arrows: samples with only 146 bp band are WT, with only 283 bp band are KO, and with both bands are HET. Lanes are numbered 1–20 with the corresponding sample number in brackets. Sample number indicates the ID of the embryos from which the yolk sac was collected: 3 (E786*), 4 (E787*), 5 (E788*), 6 (E789*), 7 (E790*), 8 (E791*), 9 (E792*), 10 (M: 100 bp DNA marker), 11 (E793*), 12 (E794*), 13 (E795*), 14 (E796*), 15 (E797*), 17 (negative control). Abbreviations: HET, heterozygous; KO, knockout; WT, wild-type.
Appendix Figure A2.
Appendix Figure A2.
Screenshots of the steps of quantitation of immunohistochemical images by ImageJ software.
Appendix Figure A3.
Appendix Figure A3.
(A to C) Immunohistochemical localization of Hmox1 in the forebrain region of the wWT, WT, and KO embryos. The region of forebrain imaged was thalamus which is a diencephalon derivative. (D to F) Immunohistochemical localization of Hmox1 in the heart of the wWT, WT, and KO embryos. Cardiac muscle (CM) cells of the muscular region of the ventricles are visible and the nuclei (n) of the same are indicated with black arrows. (G to I) Immunohistochemical localization of Hmox2 in the forebrain region of the wWT, WT, and KO embryos. (J to L) Immunohistochemical localization of Hmox2 in the heart of the wWT, WT, and KO embryos. Scale bars: 50 µm. Abbreviations: KO, knockout; WT, wild-type.
Appendix Figure A4.
Appendix Figure A4.
Hmox1 and Hmox2 protein detection in organs of wWT adult mouse. Ten µg of protein was loaded for spleen, whereas for remaining tissues 40 µg was loaded. (A) Colored images of the blots probed with Hmox1 and Hmox2 antibodies showing the position of bands with respect to the prestained protein marker. (B) Colored images of the same blots stripped and probed with β-actin antibody. (C) Gray scale images of the same blots taken without colorimetric marker. Lane 1—prestained protein marker, lane 2—lung, lane 3—liver, lane 4—spleen, lane 5—kidney, and lane 6—testis. Abbreviation: WT, wild-type.

Similar articles

Cited by

References

    1. Cruse I, Maines MD. Evidence suggesting that the two forms of heme oxygenase are products of different genes. J Biol Chem. 1988;263(7):3348–53. - PubMed
    1. Ryter SW, Alam J, Choi AM. Heme oxygenase-1/carbon monoxide: from basic science to therapeutic applications. Physiol Rev. 2006;86(2):583–650. - PubMed
    1. McCoubrey WK, Jr, Huang TJ, Maines MD. Isolation and characterization of a cDNA from the rat brain that encodes hemoprotein heme oxygenase-3. Eur J Biochem. 1997;247(2):725–32. - PubMed
    1. Hayashi S, Omata Y, Sakamoto H, Higashimoto Y, Hara T, Sagara Y, Noguchi M. Characterization of rat heme oxygenase-3 gene. Implication of processed pseudogenes derived from heme oxygenase-2 gene. Gene. 2004;336(2):241–50. - PubMed
    1. Maines MD, Trakshel GM, Kutty RK. Characterization of two constitutive forms of rat liver microsomal heme oxygenase. Only one molecular species of the enzyme is inducible. J Biol Chem. 1986;261(1):411–9. - PubMed

Publication types