. 2023 Aug 29;42(8):112842.
doi: 10.1016/j.celrep.2023.112842. Epub 2023 Jul 20.

A comprehensive Drosophila resource to identify key functional interactions between SARS-CoV-2 factors and host proteins

Affiliations

A comprehensive Drosophila resource to identify key functional interactions between SARS-CoV-2 factors and host proteins

Annabel Guichard et al. Cell Rep. .

Abstract

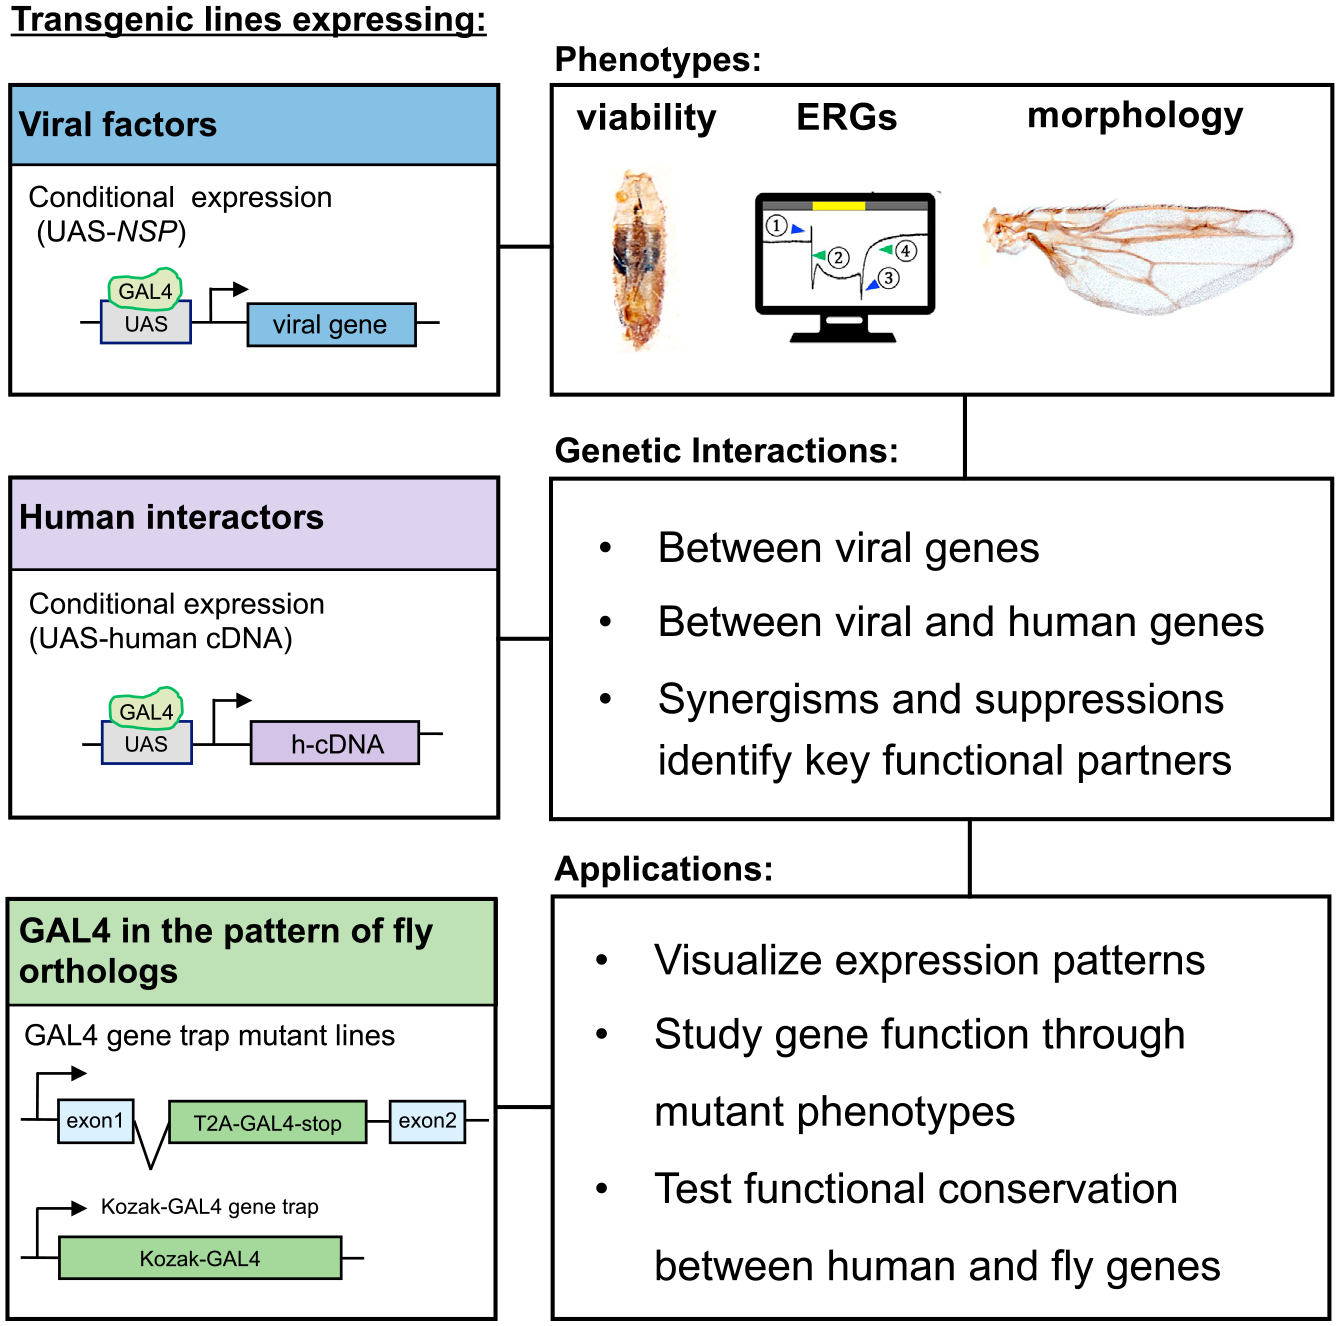
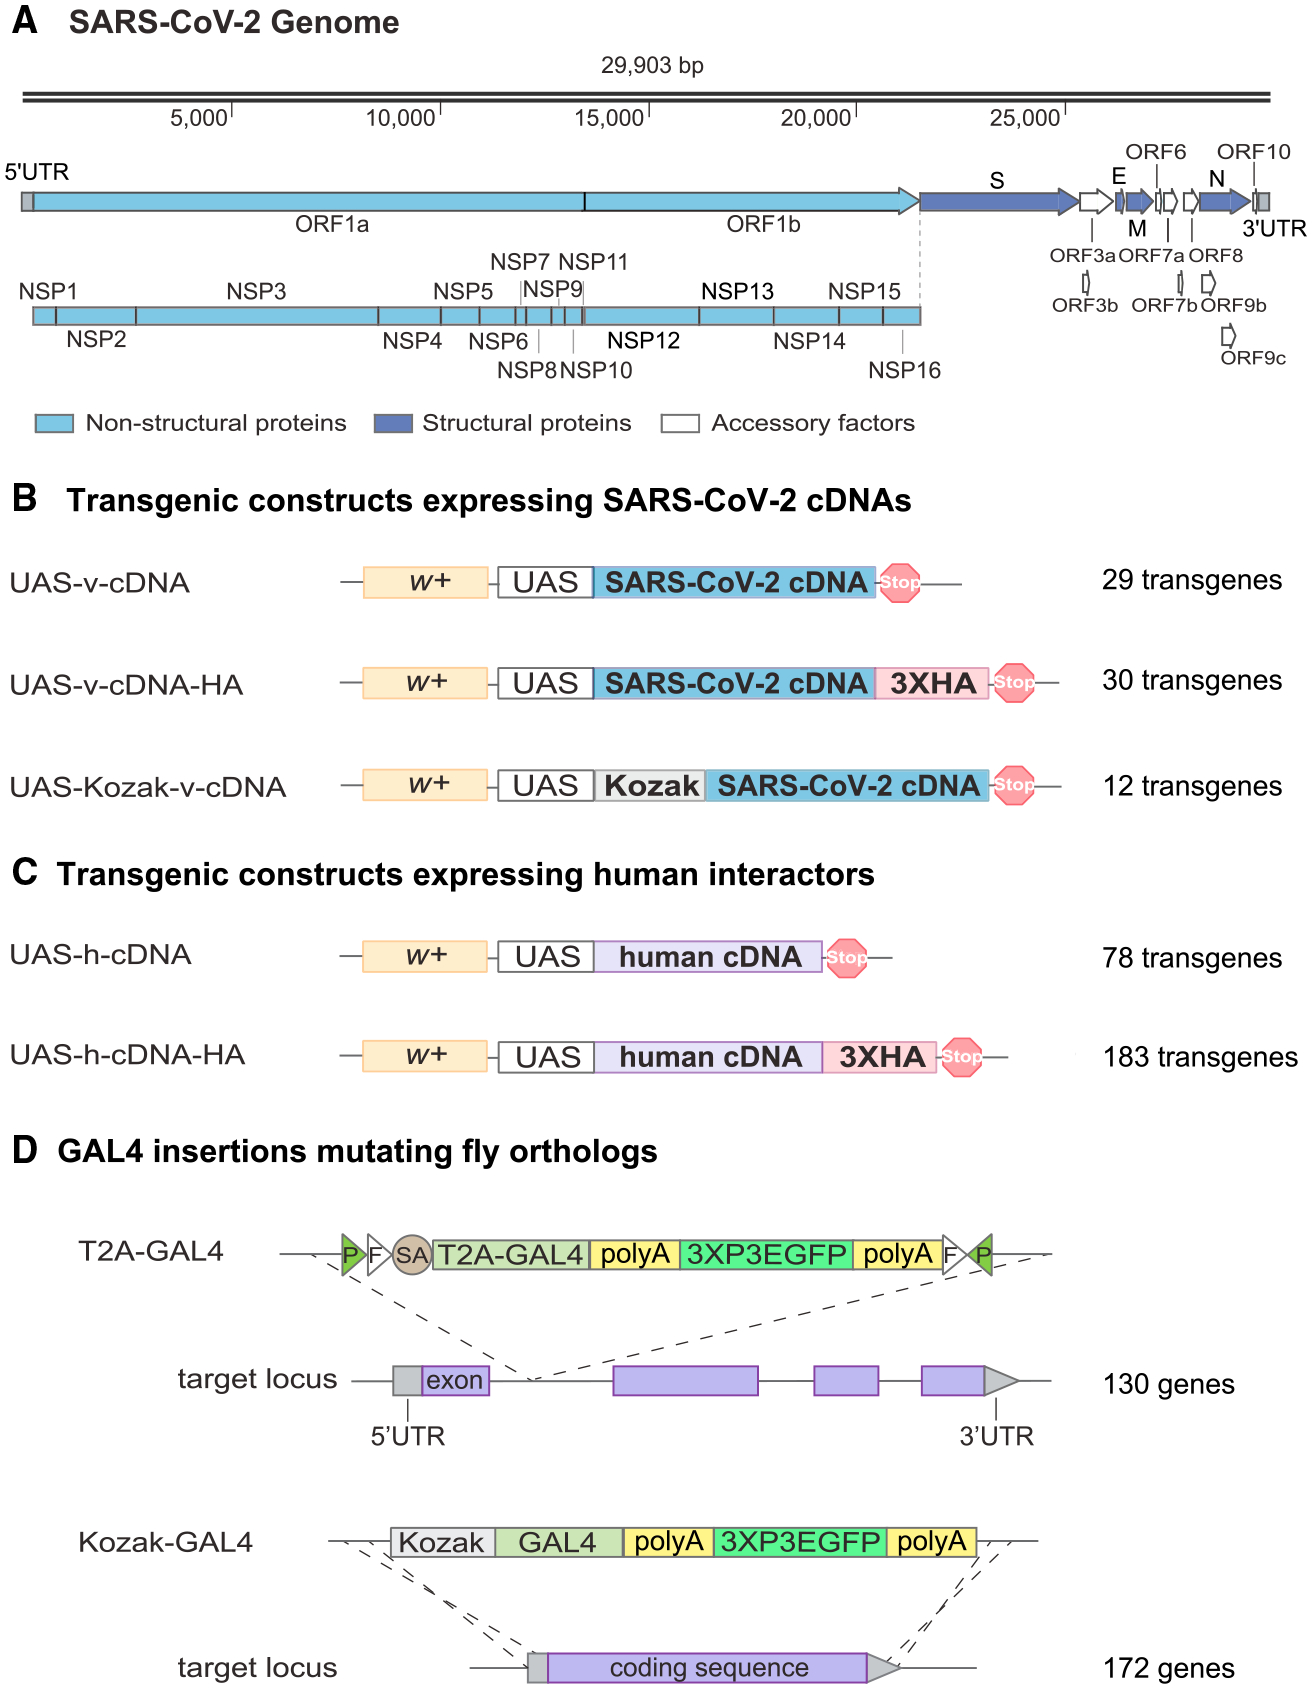
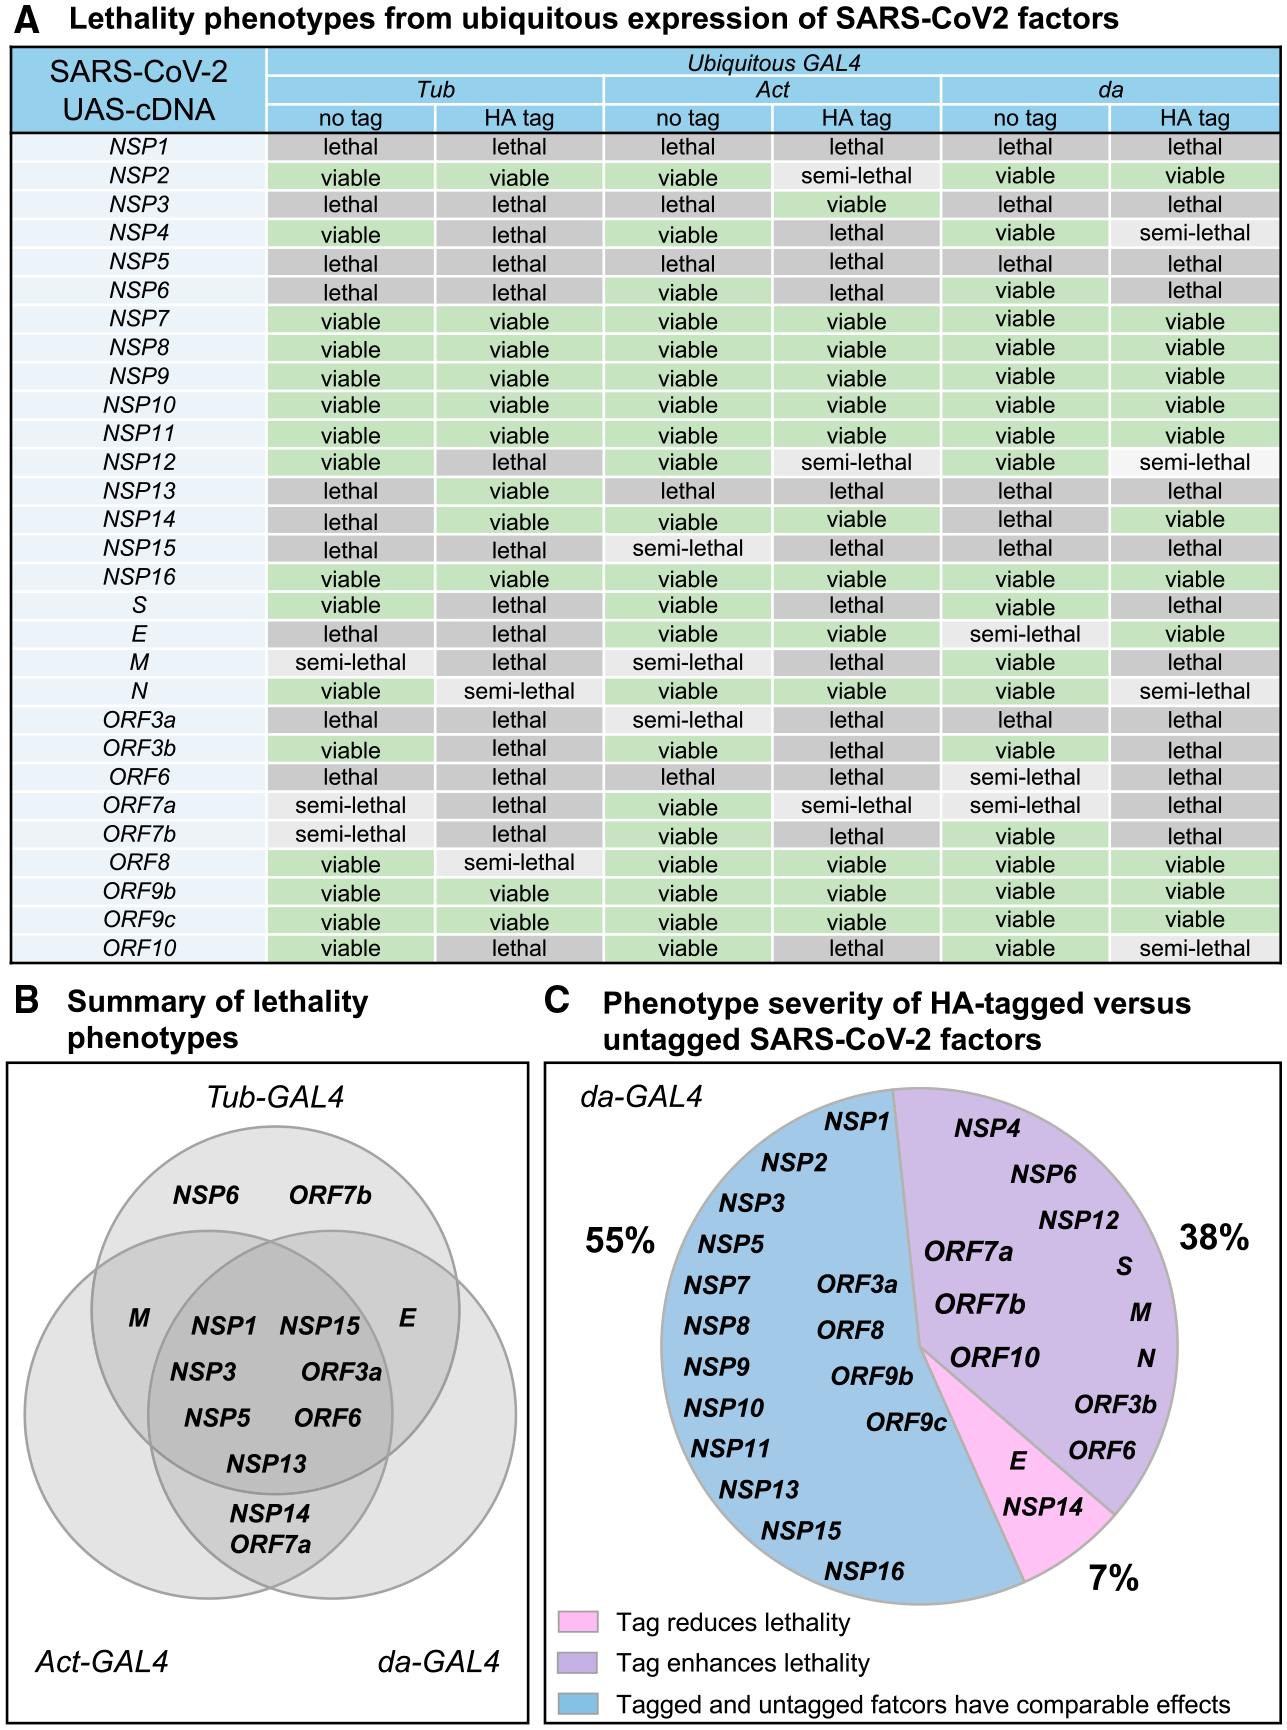
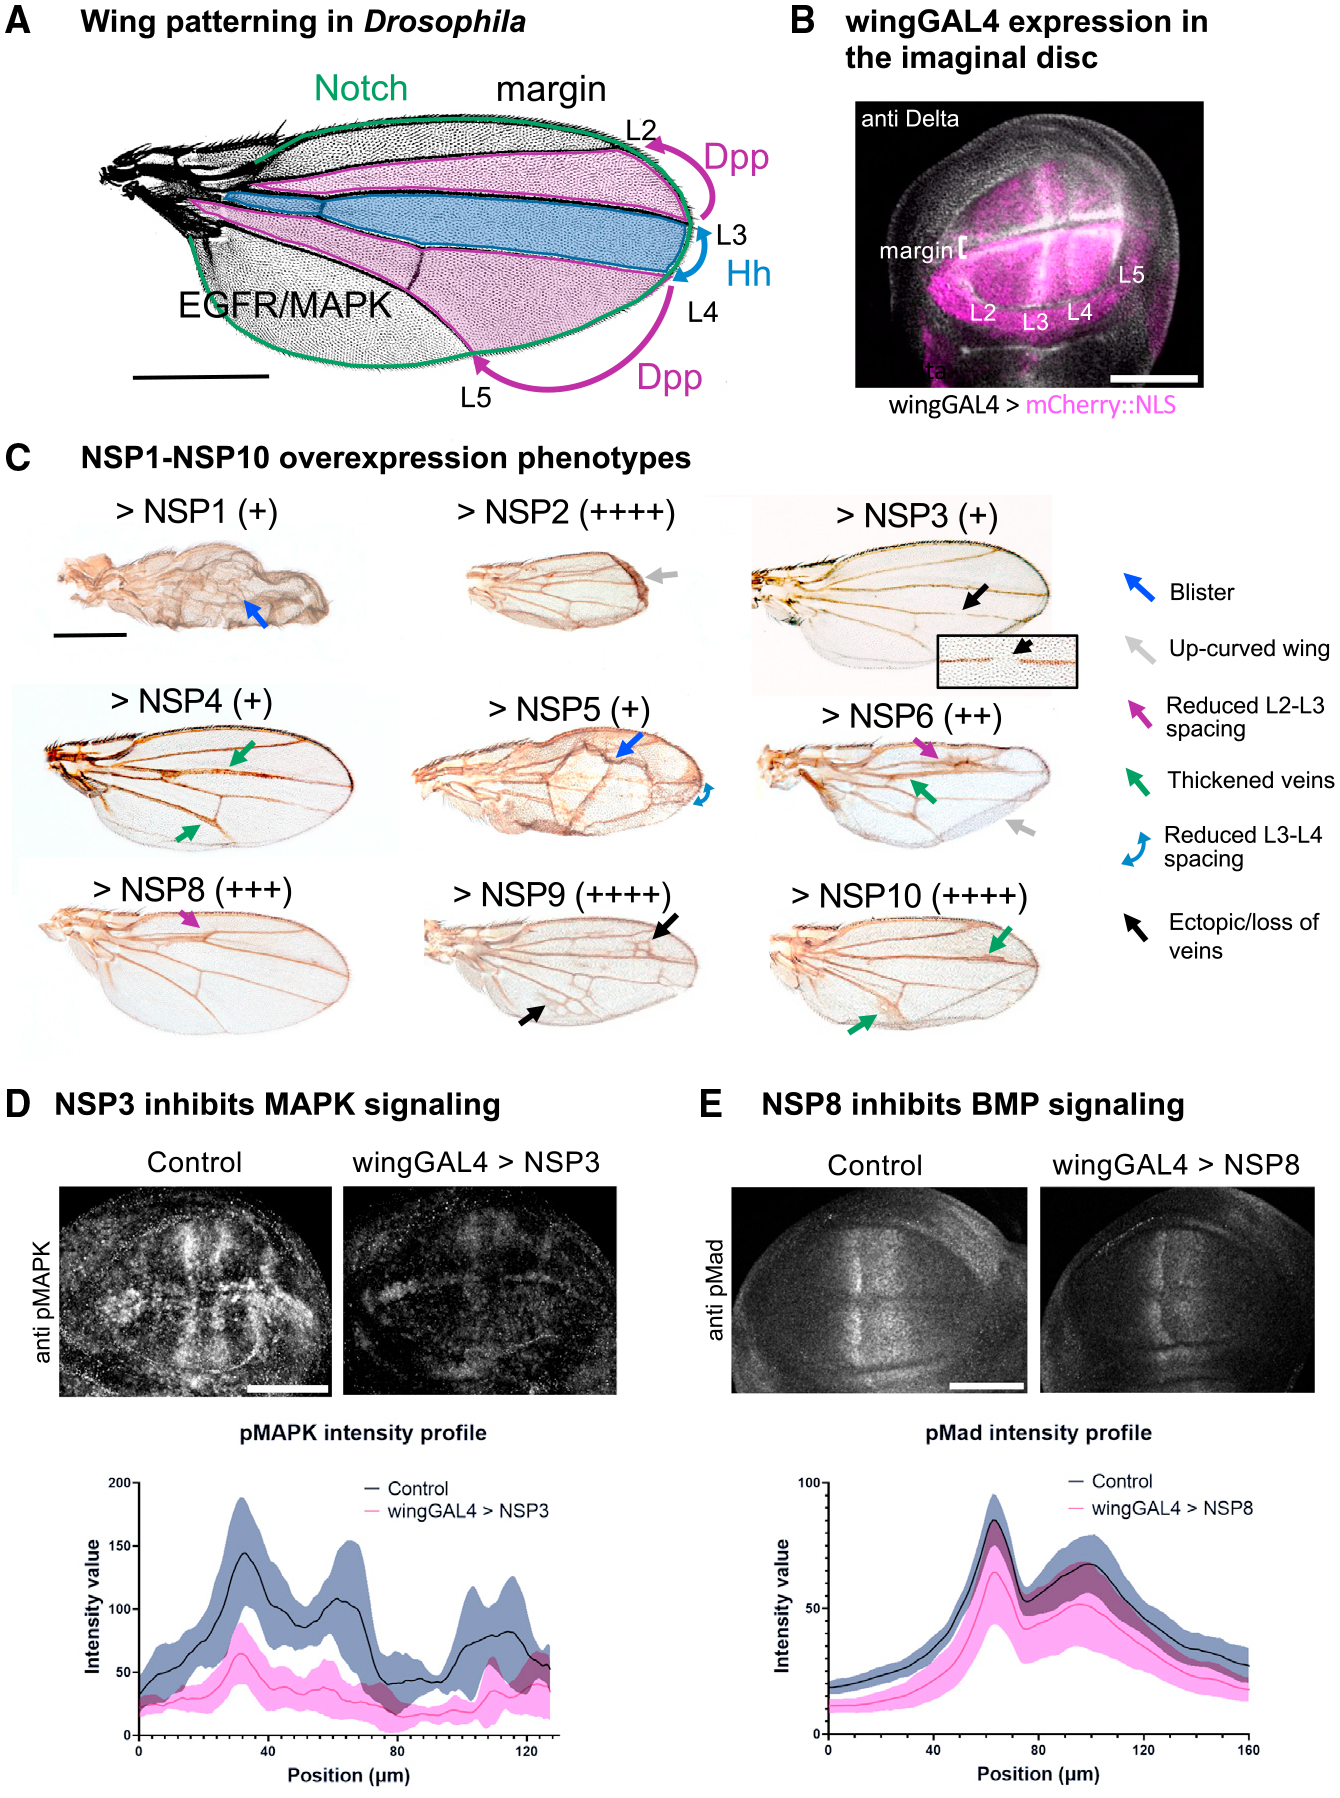
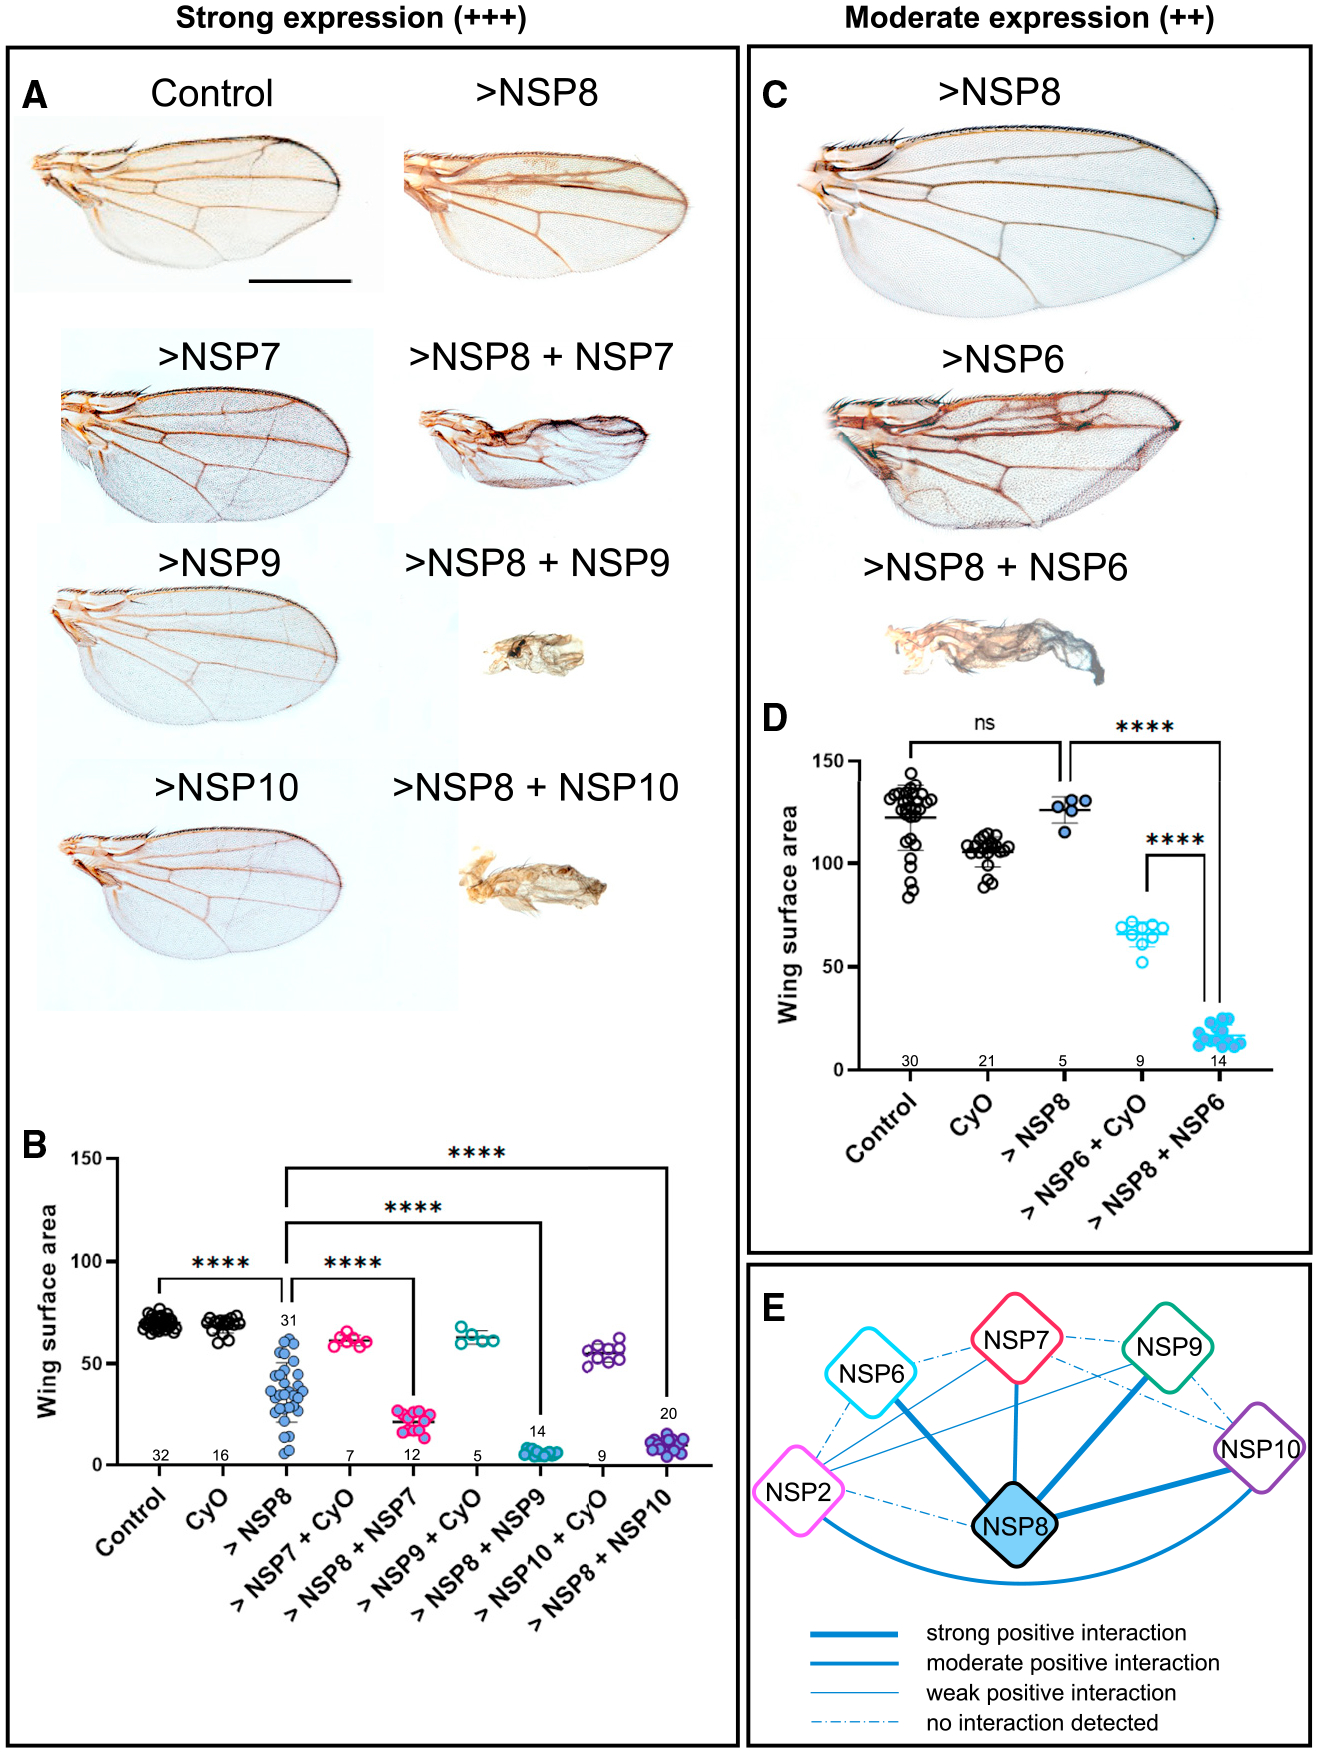
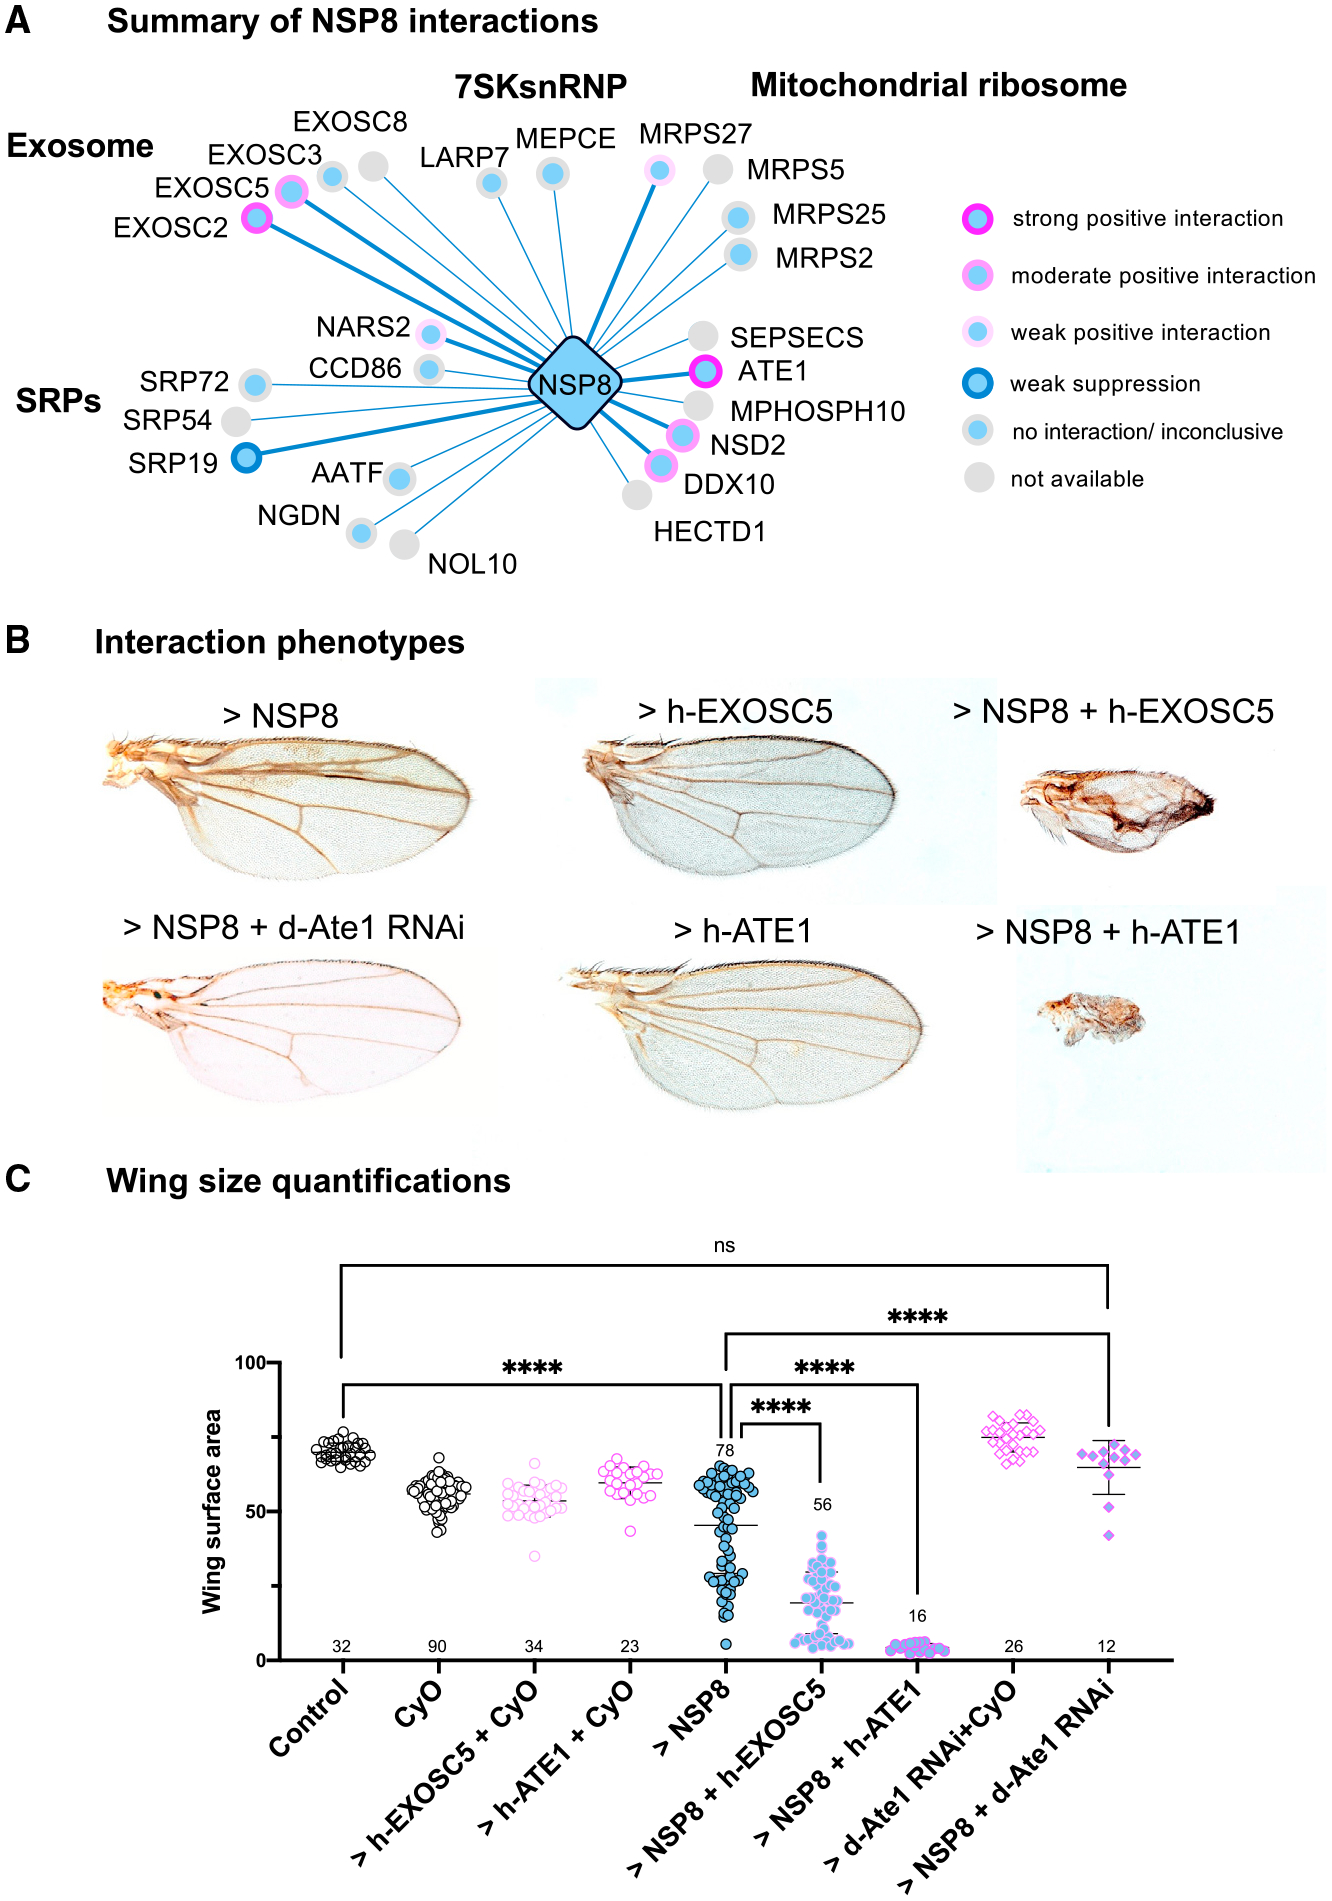
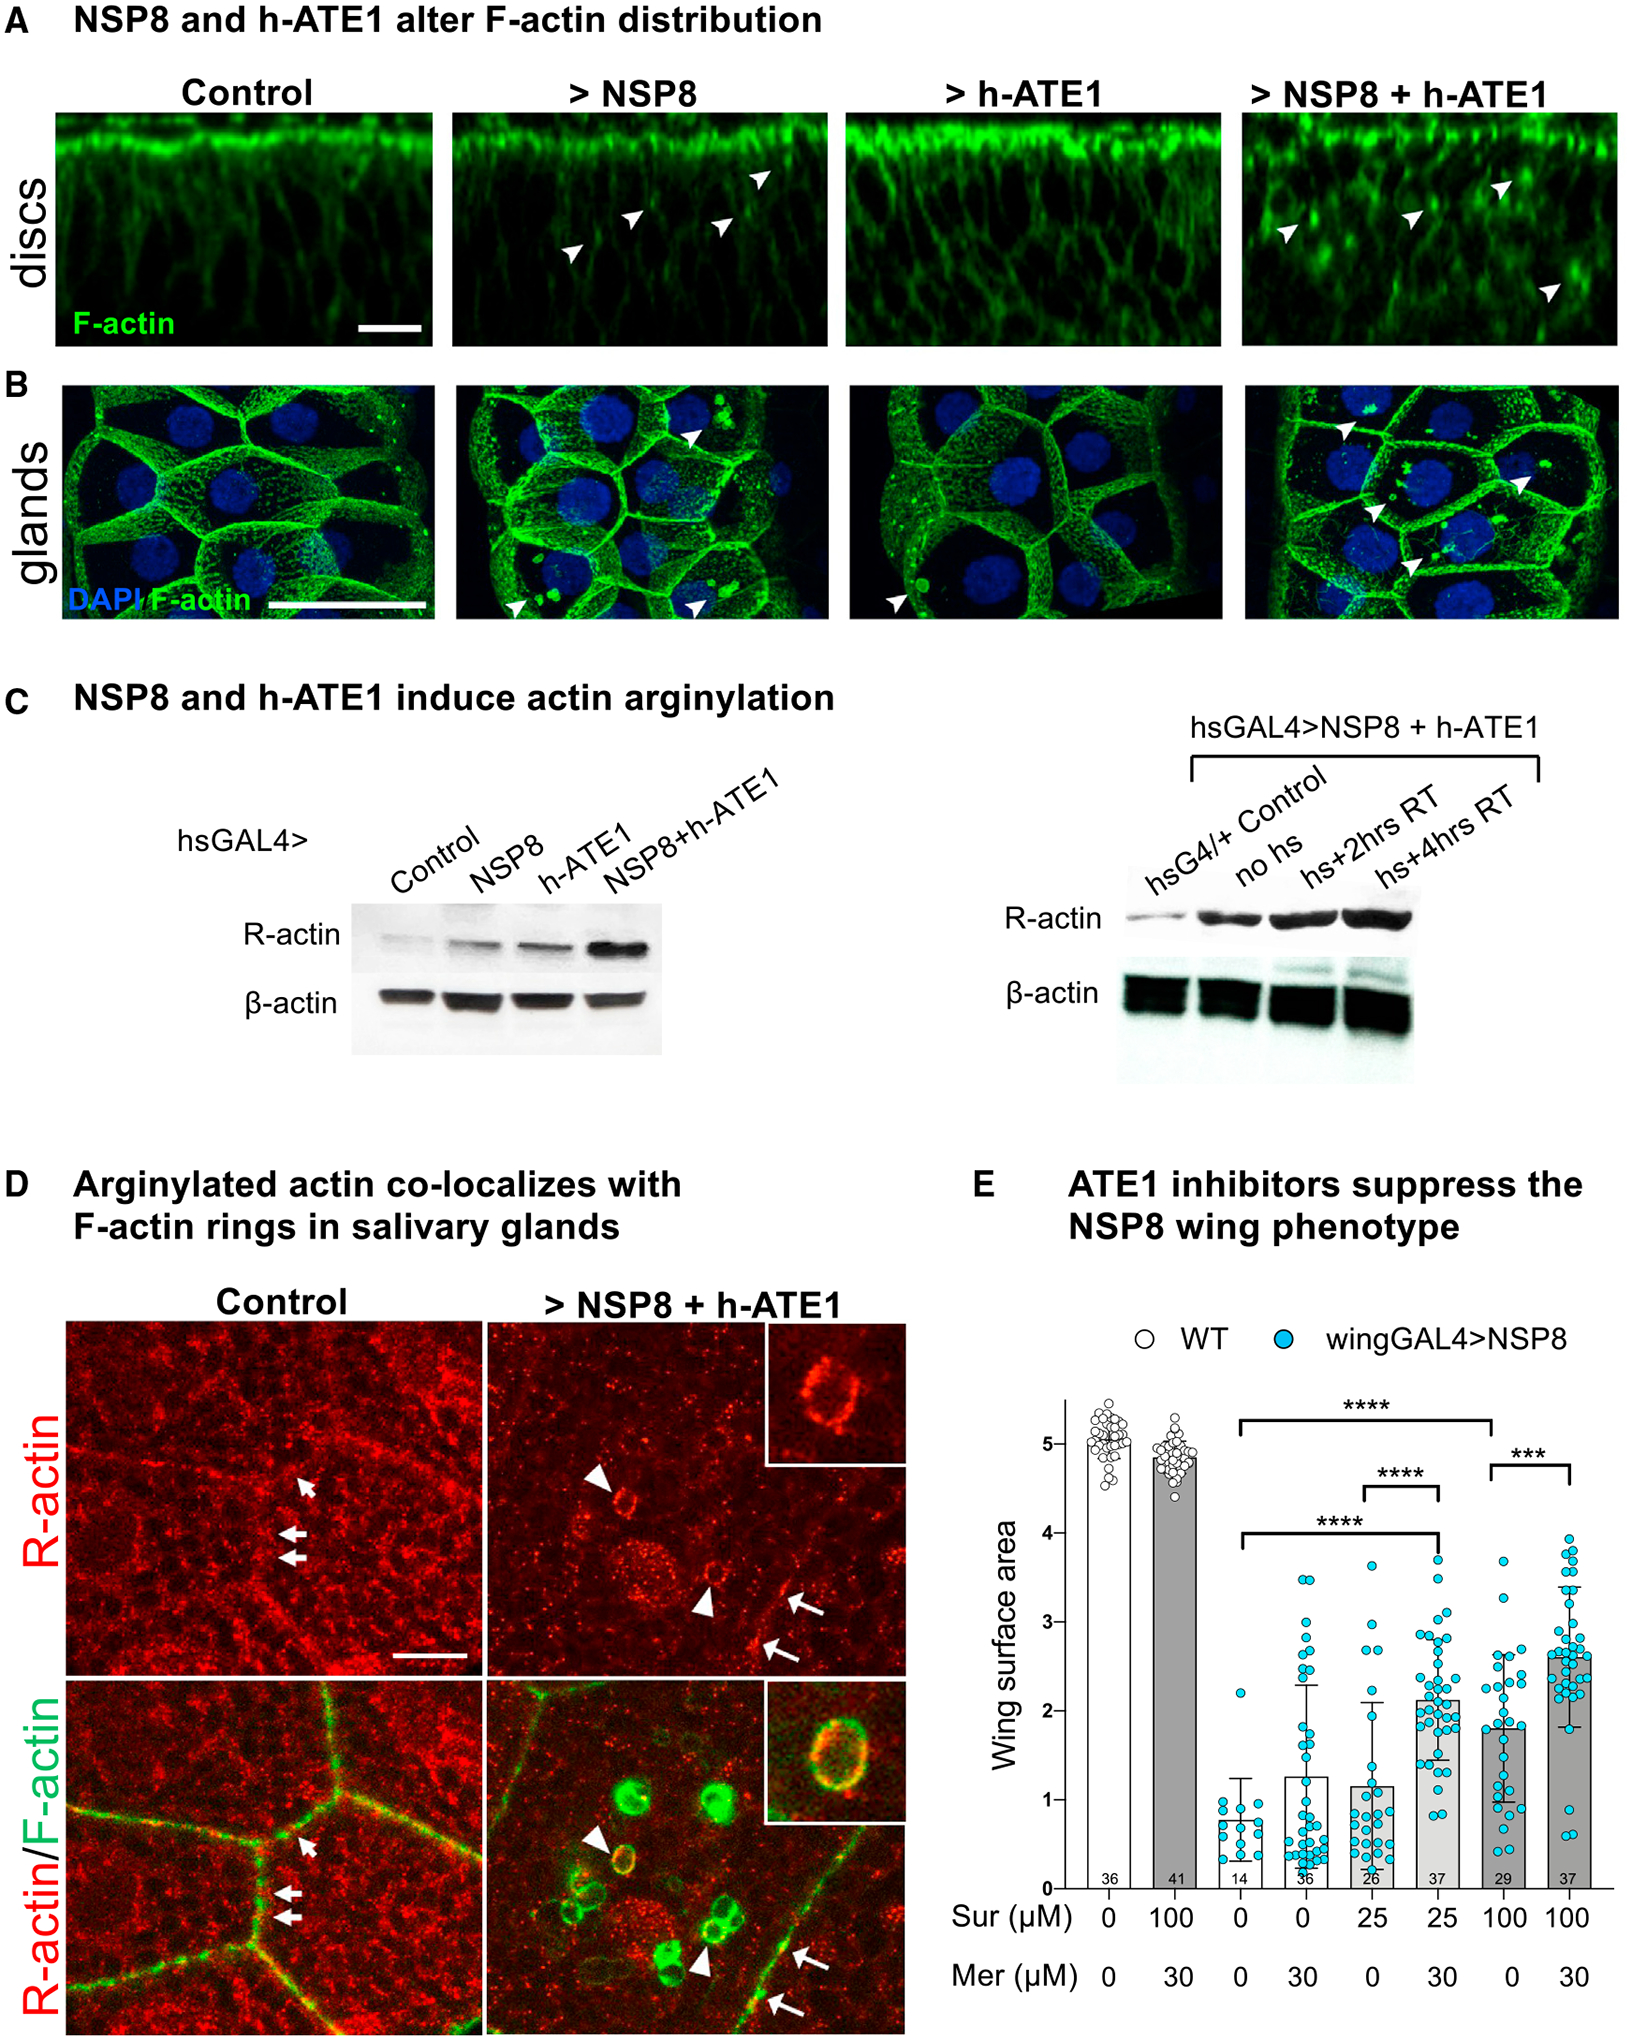
Development of effective therapies against SARS-CoV-2 infections relies on mechanistic knowledge of virus-host interface. Abundant physical interactions between viral and host proteins have been identified, but few have been functionally characterized. Harnessing the power of fly genetics, we develop a comprehensive Drosophila COVID-19 resource (DCR) consisting of publicly available strains for conditional tissue-specific expression of all SARS-CoV-2 encoded proteins, UAS-human cDNA transgenic lines encoding established host-viral interacting factors, and GAL4 insertion lines disrupting fly homologs of SARS-CoV-2 human interacting proteins. We demonstrate the utility of the DCR to functionally assess SARS-CoV-2 genes and candidate human binding partners. We show that NSP8 engages in strong genetic interactions with several human candidates, most prominently with the ATE1 arginyltransferase to induce actin arginylation and cytoskeletal disorganization, and that two ATE1 inhibitors can reverse NSP8 phenotypes. The DCR enables parallel global-scale functional analysis of SARS-CoV-2 components in a prime genetic model system.

Keywords: ATE1; CP: Microbiology; DRC; Drosophila; Drosophila Covid-19 resource; NSP8; NSPs; Orf3a; SARS-CoV-2; arginylation; human interactors; non-structural proteins.


Conflict of interest statement

Declaration of interests E.B. has equity interests in Synbal Inc., a company that may potentially benefit from the research results. E.B. also serves on the Board of Directors and Scientific Advisory Board of Synbal. The terms of this arrangement have been reviewed and approved by the University of California, San Diego in accordance with its conflict-of-interest policies.

Figures

Figure 1.
Figure 1.. Functional analysis of SARS-CoV-2 factors in Drosophila
Three types of reagents were created for expression and functional analysis of SARS-CoV-2 factors and dedicated host interactors in Drosophila (left boxes): UAS lines expressing viral factors (top), UAS lines expressing their human binding partners (middle), and GAL4 gene trap lines allowing “humanization” for the fly homologs of these human genes (bottom). These reagents are used to produce specific phenotypes pertaining to lethality, wing and eye development, and neural function (top right). Phenotypes produced by viral factors can be used to probe for genetic interactions with human candidate genes (middle right). Results obtained from phenotypic and genetic analysis can be validated through further investigation: testing activity of selected pathways and testing co-expression of viral factor with RNAi of corresponding fly homologs. T2A-GAL4 and Kozak-GAL4 gene trap lines can be used to test functional conservation between fly and human orthologs and examining expression patterns of these fly genes (bottom right).
Figure 2.
Figure 2.. Generation of UAS-SARS-CoV-2, UAS-human-cDNA, and T2A-/Kozak-GAL4 stocks
(A) Genome organization of SARS-CoV-2. The viral genome encodes 29 proteins, including 16 non-structural proteins, four structural proteins, and nine accessory factors. (B) Structure of UAS-SARS-CoV-2 transgenes. Each transgene was inserted into the same genomic site using φC31-mediated insertion. The total number of transgenes is indicated. “W+” indicates the mini-white genetic marker. (C) Structure of transgenes expressing human interactors. UAS-human cDNAs were generated either with a native stop codon or with a C-terminal 33HA tag. “W+” indicates the mini-white marker. (D) Strategies to generate T2A-GAL4 and Kozak-GAL4 alleles using CRISPR-mediated homologous recombination. The T2A-GAL4 cassette is inserted into a suitable coding intron (intron flanked by two coding exons) of the target locus. The Kozak-GAL4 cassette replaces the coding sequence when no suitable introns are present. P, attP; F, FRT; SA, splice acceptor.
Figure 3.
Figure 3.. Functional evaluation of SARS-CoV-2 cDNAs through ubiquitous expression
(A) Lethality phenotypes resulting from overexpression of UAS-SARS-CoV-2 and UAS-SARS-CoV-2-HA transgenes driven by ubiquitous GAL4s (Tub-GAL4, Act-GAL4 and da-GAL4). (B) Venn diagram summarizing lethality based on ubiquitous overexpression of SARS-CoV-2 transgenes. (C) Severity of lethal phenotypes caused by UAS-SARS-CoV-2 and UAS-SARS-CoV-2-HA ubiquitous overexpression. Adding the HA tag tends to cause more severe phenotypes. For (A) to (C), the flies were raised at 29°C.
Figure 4.
Figure 4.. NSP1–10 cause specific wing phenotypes
(A) A wild-type wing with key signaling pathways and their roles in patterning during development. Hedgehog signaling (Hh, light blue) defines the distance between central veins L3 and L4. Dpp signaling (purple) defines the positioning of outer veins L2–L5. Notch signaling (green) defines vein thickness and margin fate. EGFR/MAPK signaling (black) controls cell proliferation/survival and vein fate. Scale bar represents 500 μm. (B) A wild-type wing disc (the larval wing primordium) expressing mCherryNLS (magenta) driven by a strong dorsal-wing-specific GAL4 (MS1096 referred to as wingGAL4) and stained with an anti-Delta antibody (white). The Notch ligand Delta marks the position of the margin and longitudinal veins L3–L5. Scale bar represents 100 μm. (C) Specific wing phenotypes caused by UAS-Kozak-NSP1–10 expressed under the control of wingGAL4 driver. Four expression levels were defined by different conditions to obtain viable and visible phenotypes: low expression (+, tubulinGAL80ts lowers expression to obtain viable males at 25°C), moderate expression (++, females raised at 18°C), high expression (+++, males raised at 25°C), and very high expression (++++, two copies of the UAS transgene in individuals raised at room temperature). Colored arrows point to specific phenotype features in relation to the signaling pathways depicted in (A). Indigo arrows indicate blisters reflective of cell adhesion defects; gray arrows point to curved wings indicating cell proliferation/survival defects. Scale bar represents 500 μm. (D) Imaginal discs stained with an anti-activated MAPK antibody (pMAPK). Elevated pMAPK marks the margin primordium and veins L3–L5 in a wild-type disc (left). In an NSP3-expressing disc (right), pMAPK staining is reduced, as predicted by the loss-of-vein phenotype in (C). Lower panel shows a pMAPK intensity profile for four discs of each genotype: NSP3-expressing discs show consistently lower pMAPK levels. (E) Imaginal discs stained with an anti-phosphorylated Mad antibody (pMad), which reflects activation of Dpp signaling. pMad signal is elevated in a central zone between L2 and L5 vein primordia. In an NSP8-expressing disc (right), pMad staining is greatly reduced. Lower panel shows a pMad intensity profile for four discs of each genotype: NSP8-expressing discs show consistently lower pMad levels, as predicted by the adult wing phenotype in (C). Scale bars in (B), (D), and (E) represent 100 μm.
Figure 5.
Figure 5.. NSP8 interacts with NSP6, NSP7, NSP9, and NSP10
(A) Wing phenotypes from male flies of the indicated genotypes raised at 25°C. Under these conditions, NSP7, NSP9, and NSP10 do not produce any phenotype (wingGAL4>NSP in a CyO background, left panels). For flies co-expressing NSP8 + NSP7, NSP8 + NSP9, and NSP8 + NSP10, clear synergistic phenotypes are shown on right panels. (B) Graph showing wing area quantifications of the genotypes shown in (A), with significant reduction in wing size when factors are expressed in pairwise combinations. Number of biological replicates is indicated. ****p < 0.0001. (C) Wing phenotypes from wingGAL4>NSP8, wingGAL4>NSP6, and wingGAL4>NSP6 + NSP8 females raised at 18°C, showing synergism between NSP6 and NSP8. (D) Graph showing wing area quantifications of genotypes shown in (C), with significant reduction in wing size when both factors are expressed. Number of biological replicates is indicated. ****p < 0.0001; ns, not significant. (E) Summary diagram of genetic interactions found between NSP factors. NSP2 and NSP6–10 were tested in these co-expression experiments, but not NSP1 and NSP3–5, which require tubGAL80ts to obtain viable phenotypes. NSP8 displays strong or moderate positive interactions with NSP6, NSP7, NSP9, and NSP10, while other factors show no or weak interactions.
Figure 6.
Figure 6.. NSP8 interacts functionally with a set of human candidate genes
(A) Diagram summarizing the results from co-expression experiments involving NSP8 and individual human candidate cDNAs. The activity of the human cDNA alone was also assessed (in wing-GAL4>h-cDNA; CyO flies). Strong genetic interactions are indicated with a dark-pink circle, moderate interactions with a pink circle, and weak interactions with a light-pink circle. Suppression of the NSP8 phenotype is indicated with a blue circle; no interaction is indicated with a gray circle. (B) Examples of strong and moderate interaction phenotypes between NSP8 and human candidate genes ATE1 and EXOSC5 (right panels), which alone do not produce any phenotype (middle panels). The NSP8 phenotype is strongly suppressed by co-expression of an h-ATE1 RNAi, indicating that the NSP8 phenotype is mediated by endogenous d-Ate1 (left bottom panel). (C) Graph showing wing area quantifications of the genotypes shown in (B), with significant reduction in wing size when NSP8 is co-expressed with human candidate gene ATE1 or EXOSC5. d-ATE1 RNAi alone does not produce any phenotype but significantly suppresses the NSP8 phenotype. Number of biological replicates is indicated. ****p < 0.0001; ns, not significant.
Figure 7.
Figure 7.. NSP8 cooperates with human ATE1 to deregulate actin dynamics and arginylation
(A) F-actin distribution in control, NSP8, ATE1, and NSP8 + ATE1-expressing discs (using the wingGAL4 driver). The F-actin network is mildly deregulated in NSP8 (few F-actin accumulations, arrowheads) and ATE1 discs, but severely disorganized in discs co-expressing NSP8 and ATE1 (many F-actin accumulations, arrowheads). Scale bars represent 10 μm. (B) In salivary glands, expression of NSP8 or ATE1 alone or in combination results in formation of abnormal F-actin structures (arrowheads). The wingGAL4 driver used here is also expressed in salivary glands. Scale bars represent 100 μm. (C) Western blot analysis of actin arginylation, using an anti-arginylated β-actin (R-actin) antibody. Control (hsGAL4/+), hsGAL4>NSP8, hsGAL4>ATE1, and hsGAL4>NSP8 + ATE1 adult flies were heat shocked for 90 min and proteins were extracted after a 3 h 30 min at room temperature. Actin arginylation is increased by NSP8 and ATE1 alone and cooperatively by both factors. Total levels of β-actin are not altered by expression of either factor (bottom). Actin arginylation following NSP8 and ATE1 co-expression increases over time after heat shock (right). (D) In situ detection of actin arginylation in salivary glands. In control tissues (wingGAL4/+, left panels), R-actin (red) appears as a dotted ubiquitous stain mildly elevated at cell-cell junctions, which correlates with local interruptions (arrowheads) of the F-actin (green) network. Upon co-expression of NSP8 and ATE1 (wingGAL4>NSP8 + h-ATE1, bottom panels), R-actin co-localizes with F-actin at points of cortical accumulations (arrows) and some weaker staining F-actin rings (arrowheads). Scale bar represents 10 μm. (E) Wing size quantifications of control (w1118; WT) and wingGAL4>NSP8 males (from wingGAL4; NSP8/CyO females crossed to w1118 males at 25°C) on different concentrations of suramin (Sur), with or without 30 μM merbromin (Mer). In absence of any drug, NSP8 produces a small wing phenotype in males. This phenotype is suppressed significantly in the presence of 100 μM suramin or 25 μM suramin + 30 μM merbromin. Addition of 30 μM merbromin also significantly ameliorates the NSP8 phenotypes obtained with 25 μM or 100 μM suramin. This suppressive effect is specific to NSP8-expressing wings, as the highest drug concentration (100 μM suramin + 30 μM merbromin) does not increase wing size in control w1118 animals but rather produces a small reduction in wing size. ***p < 0.001, ****p < 0.0001.

Similar articles

Cited by

References

    1. Valencia DN (2020). Brief Review on COVID-19: The 2020 Pandemic Caused by SARS-CoV-2. Cureus 12, e7386. 10.7759/cureus.7386. - DOI - PMC - PubMed
    1. Chen Y, Liu Q, and Guo D (2020). Emerging coronaviruses: Genome structure, replication, and pathogenesis. J. Med. Virol 92, 418–423. 10.1002/jmv.25681. - DOI - PMC - PubMed
    1. Bavel JJV, Baicker K, Boggio PS, Capraro V, Cichocka A, Cikara M, Crockett MJ, Crum AJ, Douglas KM, Druckman JN, et al. (2020). Using social and behavioural science to support COVID-19 pandemic response. Nat. Human Behav 4, 460–471. 10.1038/s41562-020-0884-z. - DOI - PubMed
    1. Korber B, Fischer WM, Gnanakaran S, Yoon H, Theiler J, Abfalterer W, Hengartner N, Giorgi EE, Bhattacharya T, Foley B, et al. (2020). Tracking changes in SARS-CoV-2 Spike: evidence that D614G increases infectivity of the COVID-19 virus. Cell 182, 812–827.e19. 10.1016/j.cell.2020.06.043. - DOI - PMC - PubMed
    1. Dong S, Sun J, Mao Z, Wang L, Lu YL, and Li J (2020). A guideline for homology modeling of the proteins from newly discovered betacoronavirus, 2019 novel coronavirus (2019-nCoV). J. Med. Virol 92, 1542–1548. 10.1002/jmv.25768. - DOI - PMC - PubMed

Publication types