. 2023 Aug 8;56(8):1876-1893.e8.
doi: 10.1016/j.immuni.2023.06.024. Epub 2023 Jul 21.

Intestinal microbiota controls graft-versus-host disease independent of donor-host genetic disparity

Affiliations

Intestinal microbiota controls graft-versus-host disease independent of donor-host genetic disparity

Motoko Koyama et al. Immunity. .

Abstract

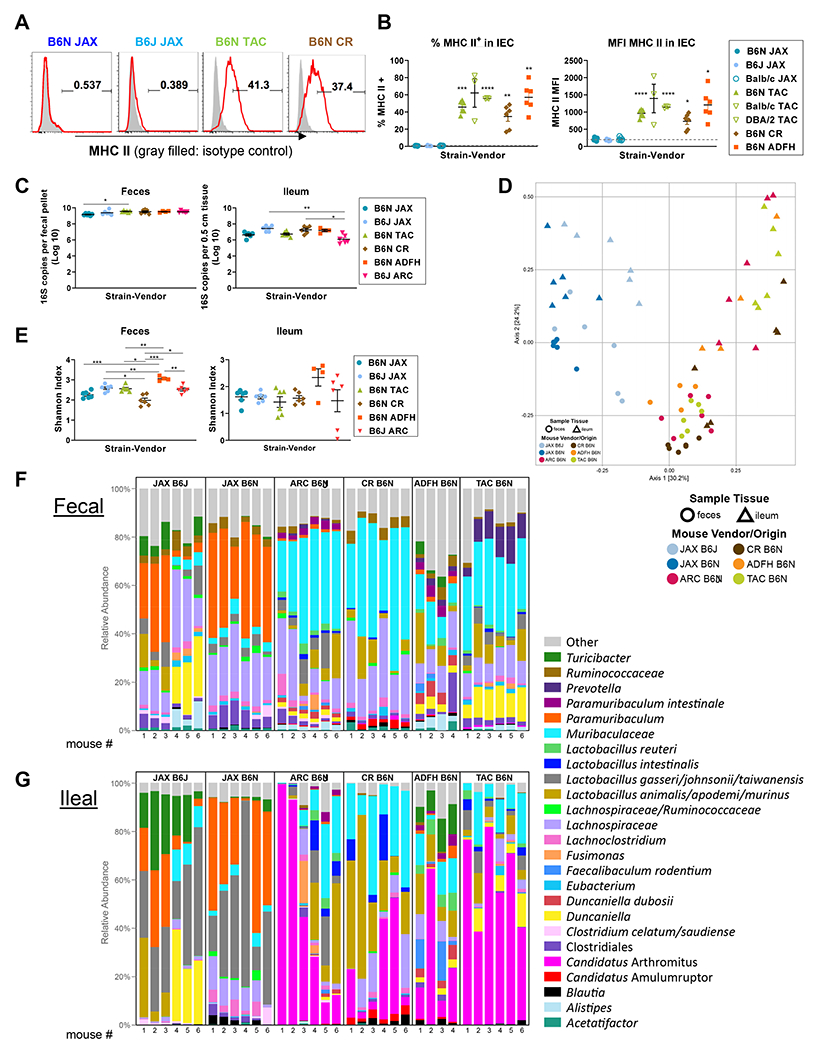
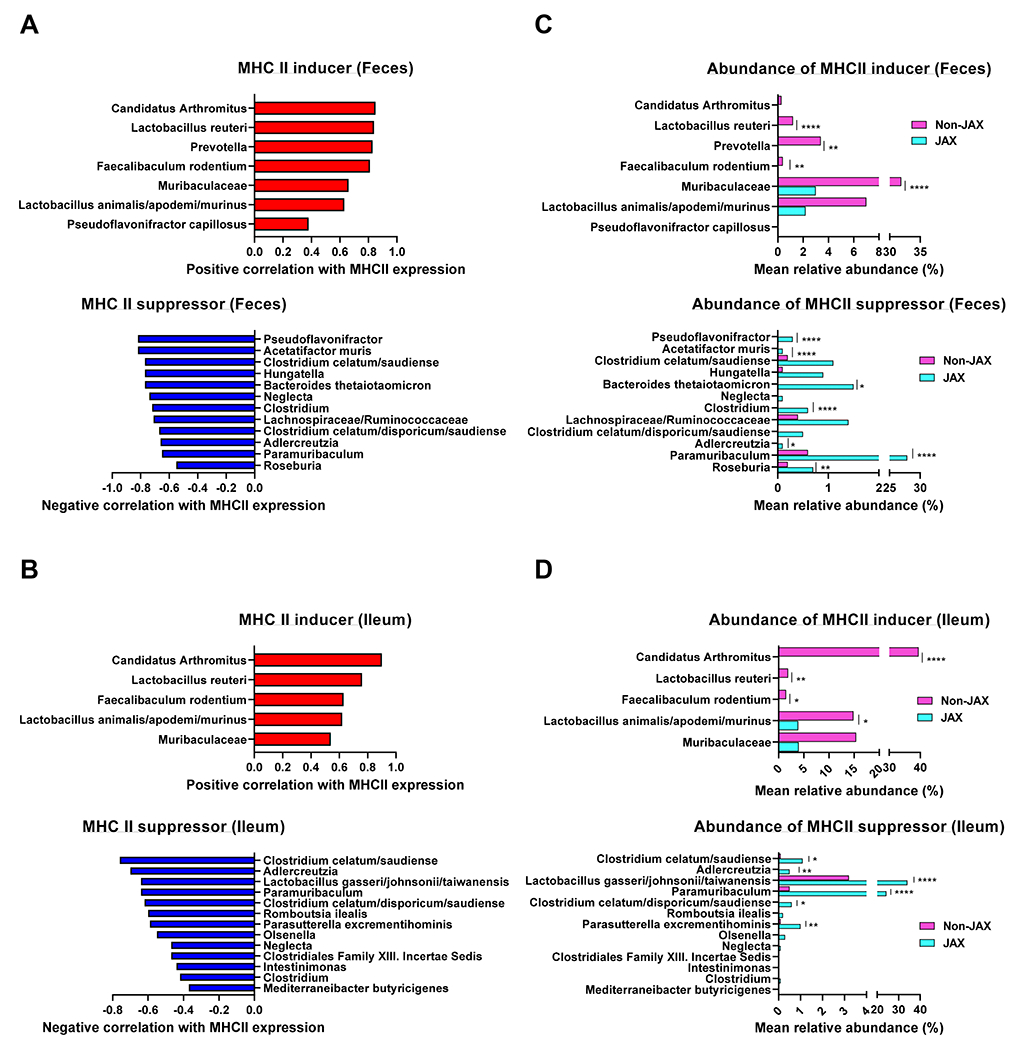
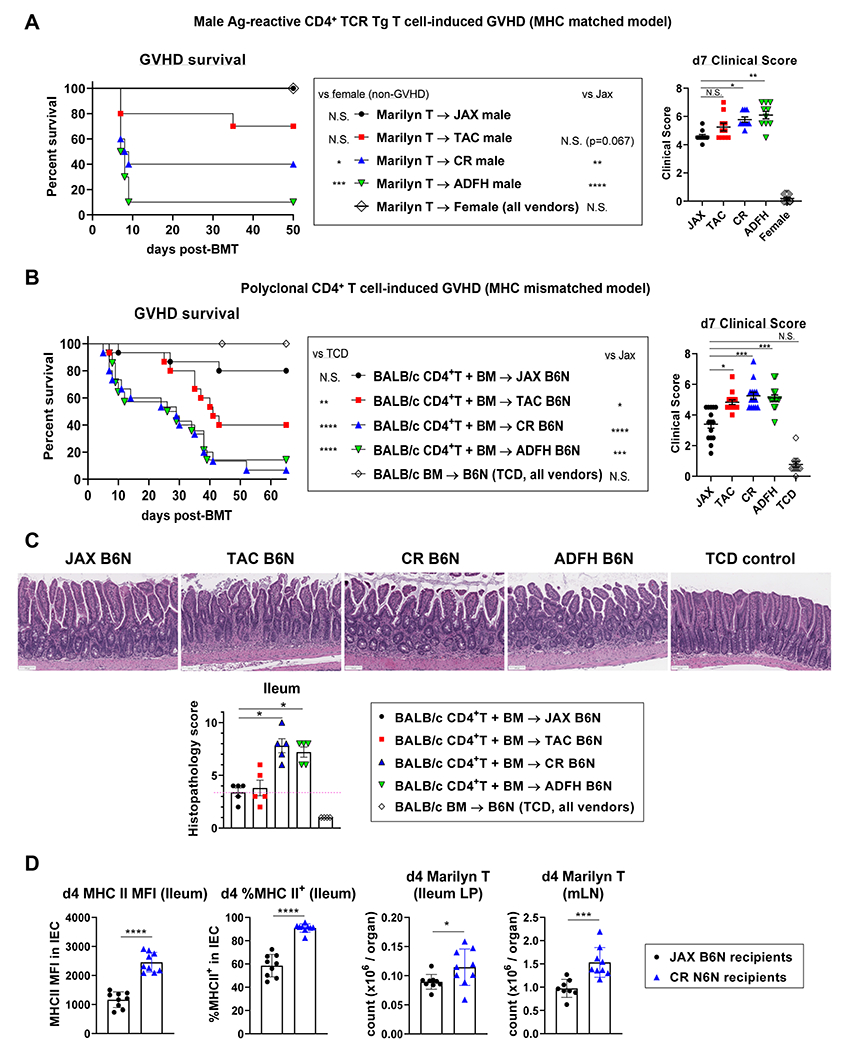
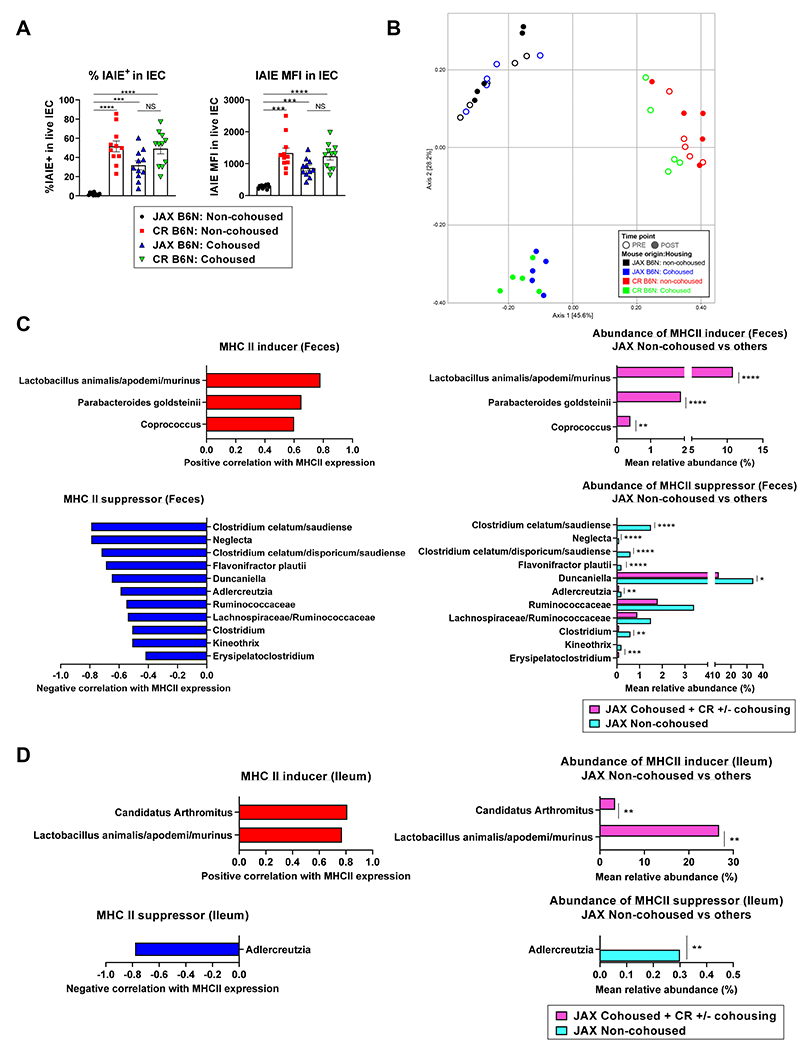
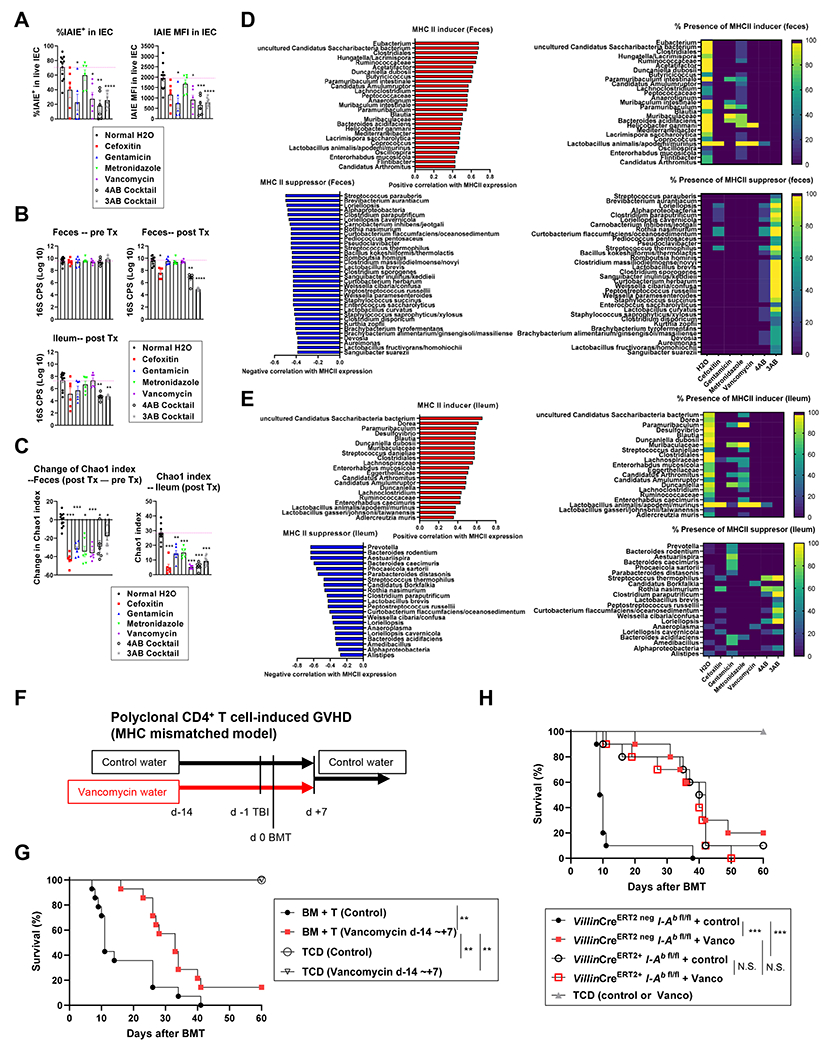
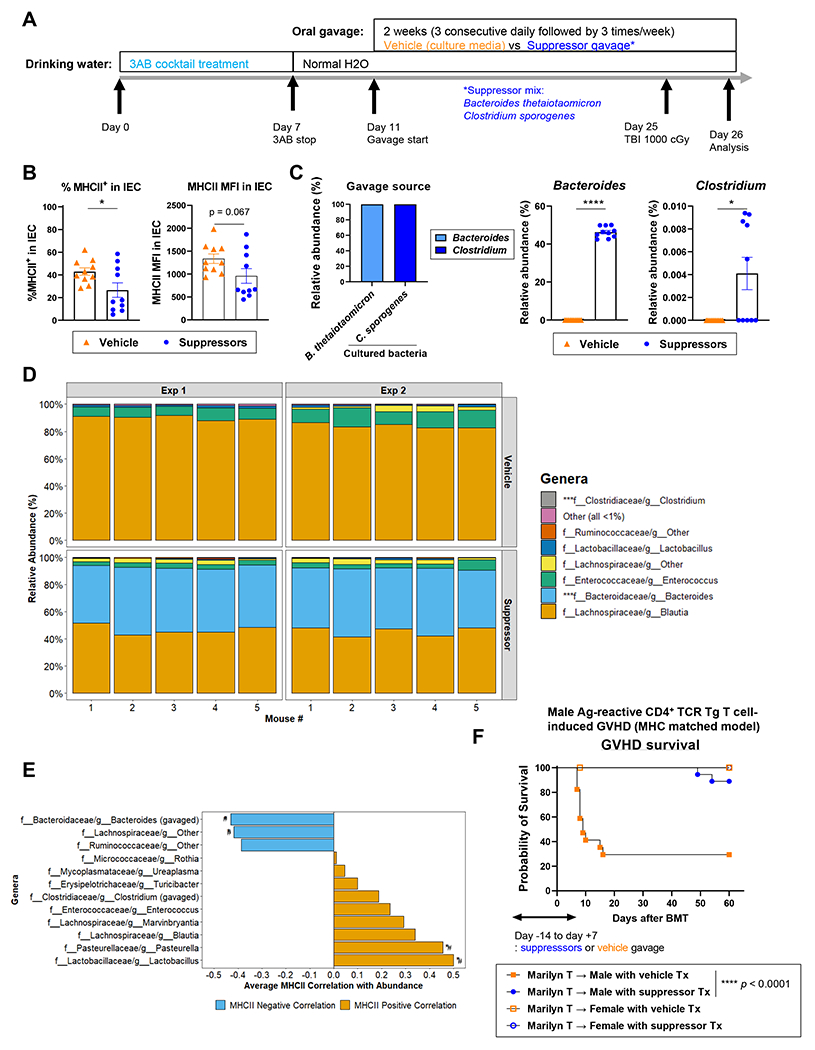
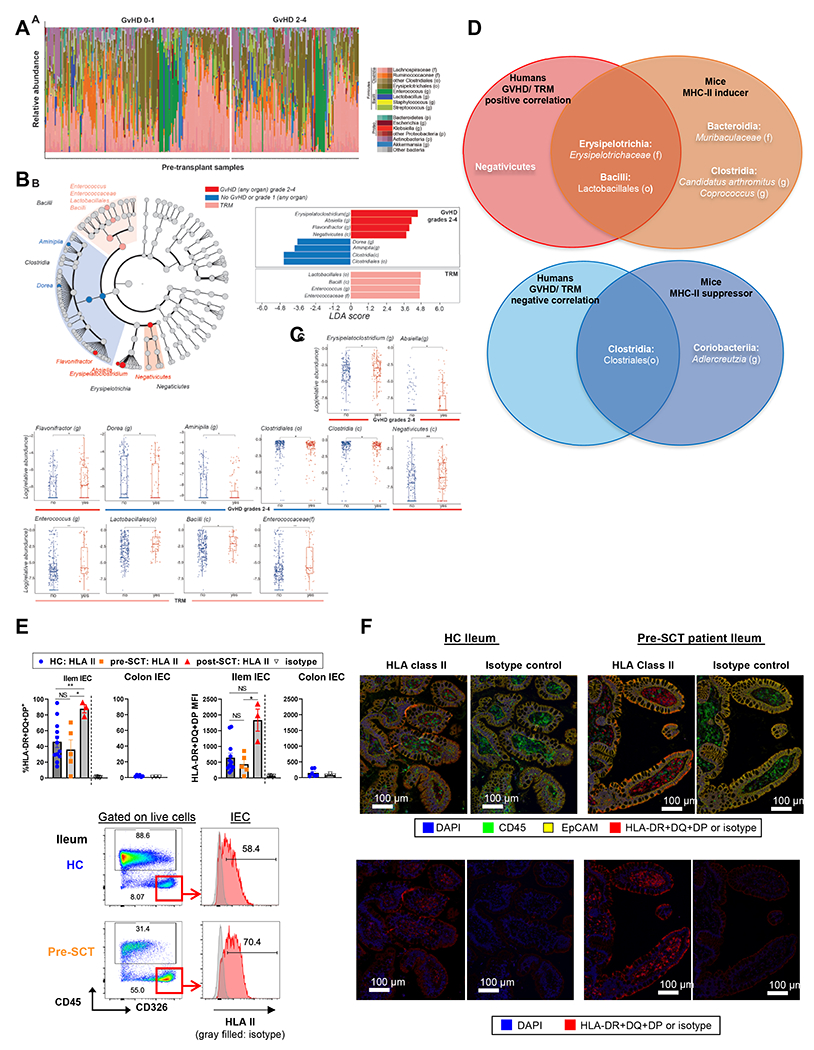
Acute graft-versus-host disease (aGVHD) remains a major limitation of allogeneic stem cell transplantation (SCT), and severe intestinal manifestation is the major cause of early mortality. Intestinal microbiota control MHC class II (MHC-II) expression by ileal intestinal epithelial cells (IECs) that promote GVHD. Here, we demonstrated that genetically identical mice of differing vendor origins had markedly different intestinal microbiota and ileal MHC-II expression, resulting in discordant GVHD severity. We utilized cohousing and antibiotic treatment to characterize the bacterial taxa positively and negatively associated with MHC-II expression. A large proportion of bacterial MHC-II inducers were vancomycin sensitive, and peri-transplant oral vancomycin administration attenuated CD4+ T cell-mediated GVHD. We identified a similar relationship between pre-transplant microbes, HLA class II expression, and both GVHD and mortality in a large clinical SCT cohort. These data highlight therapeutically tractable mechanisms by which pre-transplant microbial taxa contribute to GVHD independently of genetic disparity.

Keywords: GVHD; MHC class II antigen presentation; antibiotics; graft-versus-host disease; interferon-γ; intestinal epithelial cells; microbiota.


Conflict of interest statement

Declaration of interests W.M.G. is a scientific advisory board member for Freenome, Guardant Health, and SEngine and consultant for DiaCarta, Natera, Guidepoint, and GLG. He is an investigator in a clinical trial sponsored by Janssen Pharmaceuticals and receives research support from Tempus and LucidDx. M.R.M.v.d.B. has received research support and stock options from Seres Therapeutics and stock options from Notch Therapeutics and Pluto Therapeutics; he has received royalties from Wolters Kluwer; has consulted, received honorarium from or participated in advisory boards for Seres Therapeutics, Vor Biopharma, Rheos Medicines, Frazier Healthcare Partners, Nektar Therapeutics, Notch Therapeutics, Ceramedix, Lygenesis, Pluto Therapeutics, GlaskoSmithKline, Da Volterra, Thymofox, Garuda, Novartis (Spouse), Synthekine (Spouse), Beigene (Spouse), and Kite (Spouse); has IP Licensing with Seres Therapeutics and Juno Therapeutics; and holds a fiduciary role on the Foundation Board of DKMS (a nonprofit organization). Memorial Sloan Kettering has institutional financial interests relative to Seres Therapeutics. K.A.M. serves in an advisory role and holds stock in PostBiotics Plus Research and has consulted for Incyte. D.N.F. and T.L.F. have financial relationships with BD for licensure of molecular diagnosis of bacterial vaginosis, unrelated to the research presented in this article. G.R.H. has consulted for Generon Corporation, NapaJen Pharma, iTeos Therapeutics, and Neoleukin Therapeutics and receives research funding from Compass Therapeutics, Syndax Pharmaceuticals, Applied Molecular Transport, Serplus Technology, Heat Biologics, Laevoroc Oncology,iTeos Pharmaceuticals, and Genentech.

Figures

Figure 1.
Figure 1.. MHC II expression on intestinal epithelial cells (IEC) is dependent on intestinal microbiota rather than murine genetic variation.
(A, B) Naïve B6J, B6N, BALB/c and DBA/2 mice derived from different vendors were compared for MHC-II expression on ileal IEC. (A) Representative flow plots and (B) quantification of positivity and MFI for MHC-II on IEC. Data of BALB/c and DBA/2 from Taconic are from 1 experiment, n = 3 per group. Remaining data are combined from 2 experiments, n = 6 per group. Brown-Forsythe and Welch ANOVA test with Dunnett’s T3 multiple comparisons against B6N JAX. (C-G) Fecal and ileal samples were collected from naive JAX B6J, JAX B6N, Taconic B6N, CR B6N, ADFH B6N and ARC B6J mice and underwent 16S rRNA gene sequencing. All data are combined from two independent litters except ARC B6J which was from one (n = 4 – 6 per group). (C) The total bacterial load in fecal and ileal samples was compared by Kruskal-Wallis test with Dunn’s multiple comparison test. (D) Multi-dimensional scaling (MDS) plot using the Bray-Curtis dissimilarity metric was used to visualize the fecal and ileal microbiota of mice from different vendors. Each point represents the intestinal microbiota in a single sample. (E) Shannon index shown by Welch’s t-test with p-values adjusted using Holm’s method. (F-G) Relative abundance of the top 25 bacterial taxa detected in fecal (F) and (G) ileal samples. (B, C, E) Show mean ± SEM, *P < 0.05, **P < 0.01, ***P < 0.001, ****P < 0.0001.
Figure 2.
Figure 2.. MHC II inducers are abundant in Non-JAX mice whereas MHC-II suppressors dominate in JAX mice.
(A, C) Fecal and (B, D) ileal bacteria identified from naive JAX (B6J, B6N) or non-JAX (Taconic B6N, CR B6N, ADFH B6N and ARC B6J) mice were correlated with MHC-II expression by ileal IEC. Only taxa present in at least 3 specimens out of 34 specimens were included corresponding to 106 taxa in fecal samples and 67 taxa in ileal samples. (A, B) The taxa positively (red) or negatively (blue) correlated with MHC-II expression are referred to as MHC-II inducers and suppressors respectively. Due to the lack of MHC-II data paired to microbiota analyses, ARC B6J mice were excluded. (C, D) The relative abundance of taxa defined as MHC-II inducers or suppressors are shown in JAX (B6J and B6N) and non-JAX mice (Taconic B6N, CR B6N, ADFH B6N and ARC B6J mice). Wilcoxon Rank-sum test with p-values adjusted using Holm’s method. *p < 0.05, **p < 0.01, ***p < 0.001, ****p < 0.0001.
Figure 3.
Figure 3.. Genetically identical mice from different vendors develop CD4+ T cell-mediated GVHD of varying severity that correlates with MHC-II expression by IEC.
(A) Lethally irradiated B6N mice from the indicated vendors were transplanted with female B6 BM and 0.5 x 10⁶ Marilyn T cells. Female recipients were used as negative controls. Survival by Kaplan-Meier analysis and clinical score on day 7 post BMT, combined from 2 independent experiments (n = 7 – 10). (B, C) Lethally irradiated female B6N mice were transplanted with BALB/c BM and 5 x 10⁶ PC61-treated (regulatory T cell-depleted) CD4+ T cells. Recipients of TCD grafts are negative controls. (B) Survival by Kaplan-Meier analysis and clinical score on day 7, combined from 3 independent experiments (n = 15 – 11). (C) Intestinal histopathology scores and representative images on day 8 post BMT (n = 5 per T cell replete group, 4 per TCD from 1 experiment). (D) Lethally irradiated male B6N mice from JAX and CR vendors were transplanted with 1.0 x 10⁶ Marilyn T cells and the mLN and ileum were analyzed on day 4 (n = 9 per group combined from 2 independent experiments) (A-C) Statistical analyses: Day 7: Kruskal-Wallis test (mean ± SEM). (D) t-test with Welch’s correction (mean ± SEM). *P < 0.05, ** P < 0.01, ***p < 0.001, ****p < 0.0001.
Figure 4.
Figure 4.. MHC II-inducing microbiota are transfered after cohousing.
JAX B6N and CR B6N mice were housed separately (non-cohoused) or cohoused for 4 weeks. Fecal samples were collected before and after cohousing. Ileal MHC-II and microbiota samples were obtained after cohousing (n = 11 per group combined from 2 independent experiments except ileal microbiota where n = 5 per group from 1 experiment). Only taxa present in at least 3 specimens (out of 20 ileal samples or out of 44 mice with fecal samples) were analyzed equalling to 80 taxa in fecal samples and 62 taxa in ileal samples. (A) Quantification of MFI and % MHC-II expression by IEC (mean ± SEM). Statistical analysis by Brown-Forsythe and Welch ANOVA test with Dunnett’s T3 multiple comparisons. (B) MDS plot using the Bray-Curtis dissimilarity metric was used to visualize the fecal microbiota of mice from a representative experiment (n = 5 per group from 1 experiment) pre- and post-cohousing. Each point represents the fecal microbiota in a single sample. The fecal microbiota of JAX mice were similar to the microbiota of CR mice post-cohousing while the microbiota of control JAX mice that were not cohoused did not shift in composition post-cohousing. (C, D) MHC-II inducers (red) and MHC-II suppressors (blue) and their relative abundance in JAX non-cohoused mice (cyan) vs. others (JAX cohoused, CR-cohoused and CR non-cohoused mice: pink) in (C) feces and (D) ileum. Statistical analysis by Wilcoxon rank-sum test with p-values adjusted using Holm’s method. *p < 0.05, **p < 0.01, ***p < 0.001, ****p < 0.0001. See also Figure S1.
Figure 5.
Figure 5.. Peri-transplant oral vancomycin attenuates CD4+ T cell-mediated GVHD in an MHC-II and IEC dependent manner.
ADFH B6N mice were treated with drinking water containing various antibiotics as shown, for 2 weeks. Fecal samples were collected before and after treatment. Ileal MHC-II and microbiota were analyzed after treatment. Two sets of comparisons as 4AB cocktail, single antibiotics vs. normal H2O (n = 6 per group combined from 2 independent experiments) and 3AB cocktail vs. normal H2O (n = 6, 9 per group combined from 2 independent experiments) were combined and analyzed. Only taxa present in at least 3 specimens (out of 55 fecal or ileal samples) were analyzed representing 128 taxa in fecal samples and 61 taxa in ileal samples. (A) Quantification of MFI and % MHC-II expression by IEC. (B) Bacterial load presented as log10 (16S rRNA gene copies per sample as one pre- or post- treatment fecal pellet, or 0.5 cm Ileal tissue). (C) Chao1 index in post-treatment fecal (top) and ileal (bottom) samples. (D, E) MHC-II inducers (red) and MHC-II suppressors (blue) (left) and their frequency in each treatment group (right) of fecal (D) and ileal (E) samples. Statistical analysis by Brown-Forsythe ANOVA and Welch’s t-test with Dunnett’s T3 multiple comparison test (A), Kruskal-Wallis test with Dunn’s multiple comparison test against normal H2o (B), and Welch’s t-test with p-values adjusted using Holm’s method (C). Data are shown as mean ± SEM (A-C). (F - H) Female mice received either vancomycin water or normal drinking water from day −14 to day 7 after BMT, thereafter all mice received normal water. Mice were transplanted with BALB/c BM and 5 x 10⁶ PC61-treated CD4+ T cells. (G) Recipients were CR B6N mice and (H) B6-background VillinERT2 neg I-Ab fl/fl or VillinERT2 + I-Ab fl/fl mice. Survival by Kaplan-Meier analysis combined from 2 independent experiments (G: n = 14 per T cell replete, n = 4 per TCD. H: n = 10 per T cell replete, n = 5 per TCD). *p < 0.05, **p < 0.01, ***p < 0.001, ****p < 0.0001. See also Figure S2.
Figure 6.
Figure 6.. MHC-II suppressors attenuate MHC-II expression on IEC and GVHD.
(A) Treatment schema. ADFH B6N mice received 3AB cocktail water for 7 days followed by normal drinking water. Four days later, mice were gavaged with MHC-II suppressor bacteria (1:1 mix of B. thetaiotaomicron and C. sporogenes) or vehicle (culture media) for 2 weeks. Mice were then lethally irradiated (1000 cGy) and analyzed 24 hours later. (B) Quantification of % MHC-II expression and MFI on ileal IEC (n = 10 per group, combined with 2 independent experiments. Statistical analysis by T-test with Welch’s correction [mean ± SEM]). (C) Quantification of relative abundance of Clostridium and Bacteroides (genus) in cultured bacteria and fecal samples (n = 10 per group, combined with 2 independent experiments. Statistical analysis by Mann-Whitney test [mean ± SEM]). (D) Genus-rank relative abundance of fecal bacteria. (E) Genera that negatively (blue) or positively (orange) correlated with MHC-II expression. #p < 0.1 (unadjusted). (F) ADFH B6N male and female mice were treated as described in (A), then transplanted with female B6 BM and 0.5 x 10⁶ Marilyn T cells. Survival by Kaplan-Meier analysis (n = 17 - 18 per male group combined from 2 independent experiments). *p < 0.05, **p < 0.01, ***p < 0.001, ****p < 0.0001. See also Figure S5 and S6.
Figure 7.
Figure 7.. Pre-transplant Bacilli and Clostridia in stool correlate with grade 2-4 GVHD and TRM.
(A) Visualization of the composition of pre-HCT microbiota in 287 patients separated in patients who later develop GVHD grades 0-1 vs. 2-4. (B) LEfSe results are shown in a cladogram form (left) and bar plot (right). The cladogram illustrates the taxa associated with either TRM or GVHD grades 2-4 and their phylogenetic information. The bar plot illustrates the taxa and their LDA score. (C) Taxa-rank comparisons of patients who later develop GVHD grades 2-4 or not; and patients with TRM. The taxa were selected from LEfSe, as seen in panel (B). *p < 0.05, **p < 0.01. (D) Venn diagrams correlating inducers and suppressors across human and mouse. (E-F) Ileum and colon biopsies from healthy individuals and patients pre- or post-transplant were dissociated for flow cytometric analysis (E) or stained for immunofluorescent analysis (F). Representative flow plots with quantification of MFI and % HLA-II expression by IEC (E), and representative immunofluorescence images (F) are shown. (E) Ileum: n = 12, 5, 3 per healthy control (HC), pre-SCT, post-SCT. Colon: n = 6 per HC. Brown-Forsythe and Welch ANOVA test with Dunnett’s T3 multiple comparisons for % positivity of ileal HLA-II and Kruskal-Wallis test with Dunn’s multiple comparisons for ileal HLA-II MFI (mean ± SEM). (F) Ileum: n = 3, 3 per HC or pre-SCT. GVHD: graft versus host disease; TRM: transplant related mortality; LDA: linear discriminant analysis. NS: not significant. See also Figure S7, and Table S1–S3, S6.

References

    1. D’Souza A, Fretham C, Lee SJ, Arora M, Brunner J, Chhabra S, Devine S, Eapen M, Hamadani M, Hari P, et al. (2020). Current Use of and Trends in Hematopoietic Cell Transplantation in the United States. Biol Blood Marrow Transplant 26, e177–e182. 10.1016/j.bbmt.2020.04.013. - DOI - PMC - PubMed
    1. de Witte T, Bowen D, Robin M, Malcovati L, Niederwieser D, Yakoub-Agha I, Mufti GJ, Fenaux P, Sanz G, Martino R, et al. (2017). Allogeneic hematopoietic stem cell transplantation for MDS and CMML: recommendations from an international expert panel. Blood 129, 1753–1762. 10.1182/blood-2016-06-724500. - DOI - PMC - PubMed
    1. Weiden PL, Flournoy N, Thomas ED, Prentice R, Fefer A, Buckner CD, and Storb R (1979). Antileukemic effect of graft-versus-host disease in human recipients of allogeneic-marrow grafts. N Engl J Med 300, 1068–1073. 10.1056/NEJM197905103001902. - DOI - PubMed
    1. Zeiser R, and Blazar BR (2017). Pathophysiology of Chronic Graft-versus-Host Disease and Therapeutic Targets. N Engl J Med 377, 2565–2579. 10.1056/NEJMra1703472. - DOI - PubMed
    1. Zeiser R, and Blazar BR (2017). Acute Graft-versus-Host Disease - Biologic Process, Prevention, and Therapy. N Engl J Med 377, 2167–2179. 10.1056/NEJMra1609337. - DOI - PMC - PubMed

Publication types

MeSH terms