. 2023 Aug 7;33(15):3289-3298.e6.
doi: 10.1016/j.cub.2023.06.068. Epub 2023 Jul 21.

The genomic basis of temporal niche evolution in a diurnal rodent

Affiliations

The genomic basis of temporal niche evolution in a diurnal rodent

Rose Richardson et al. Curr Biol. .

Abstract

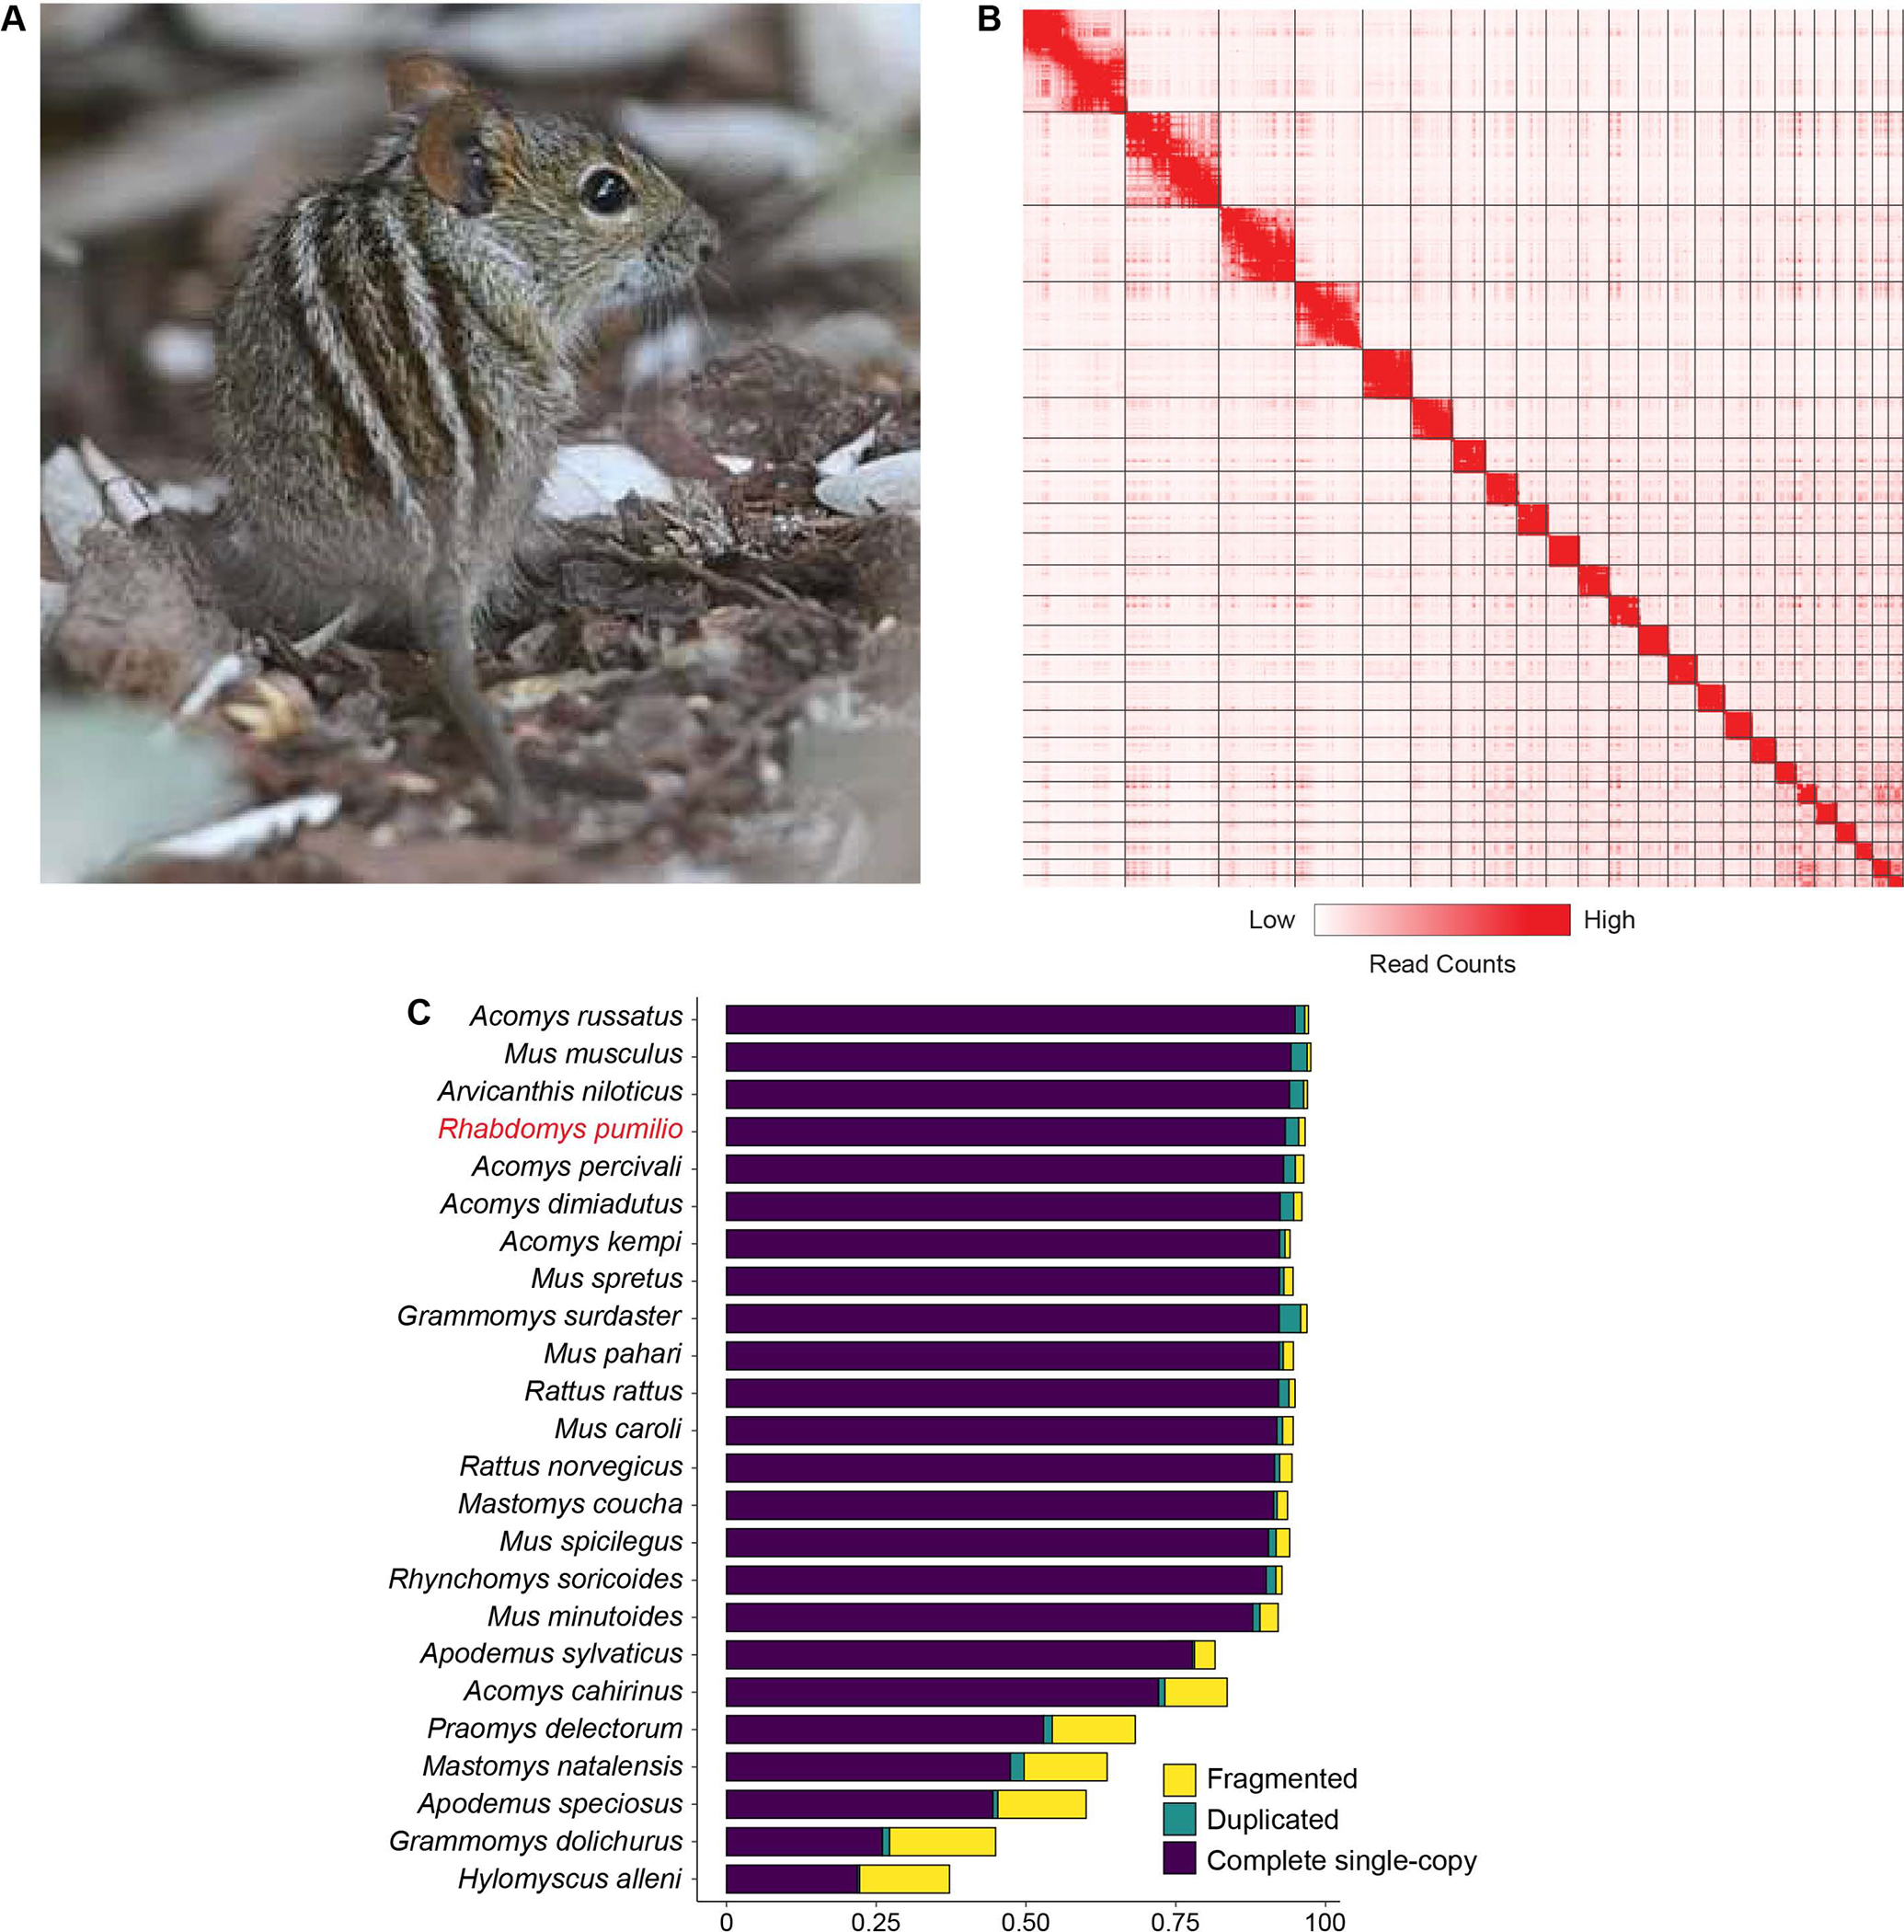
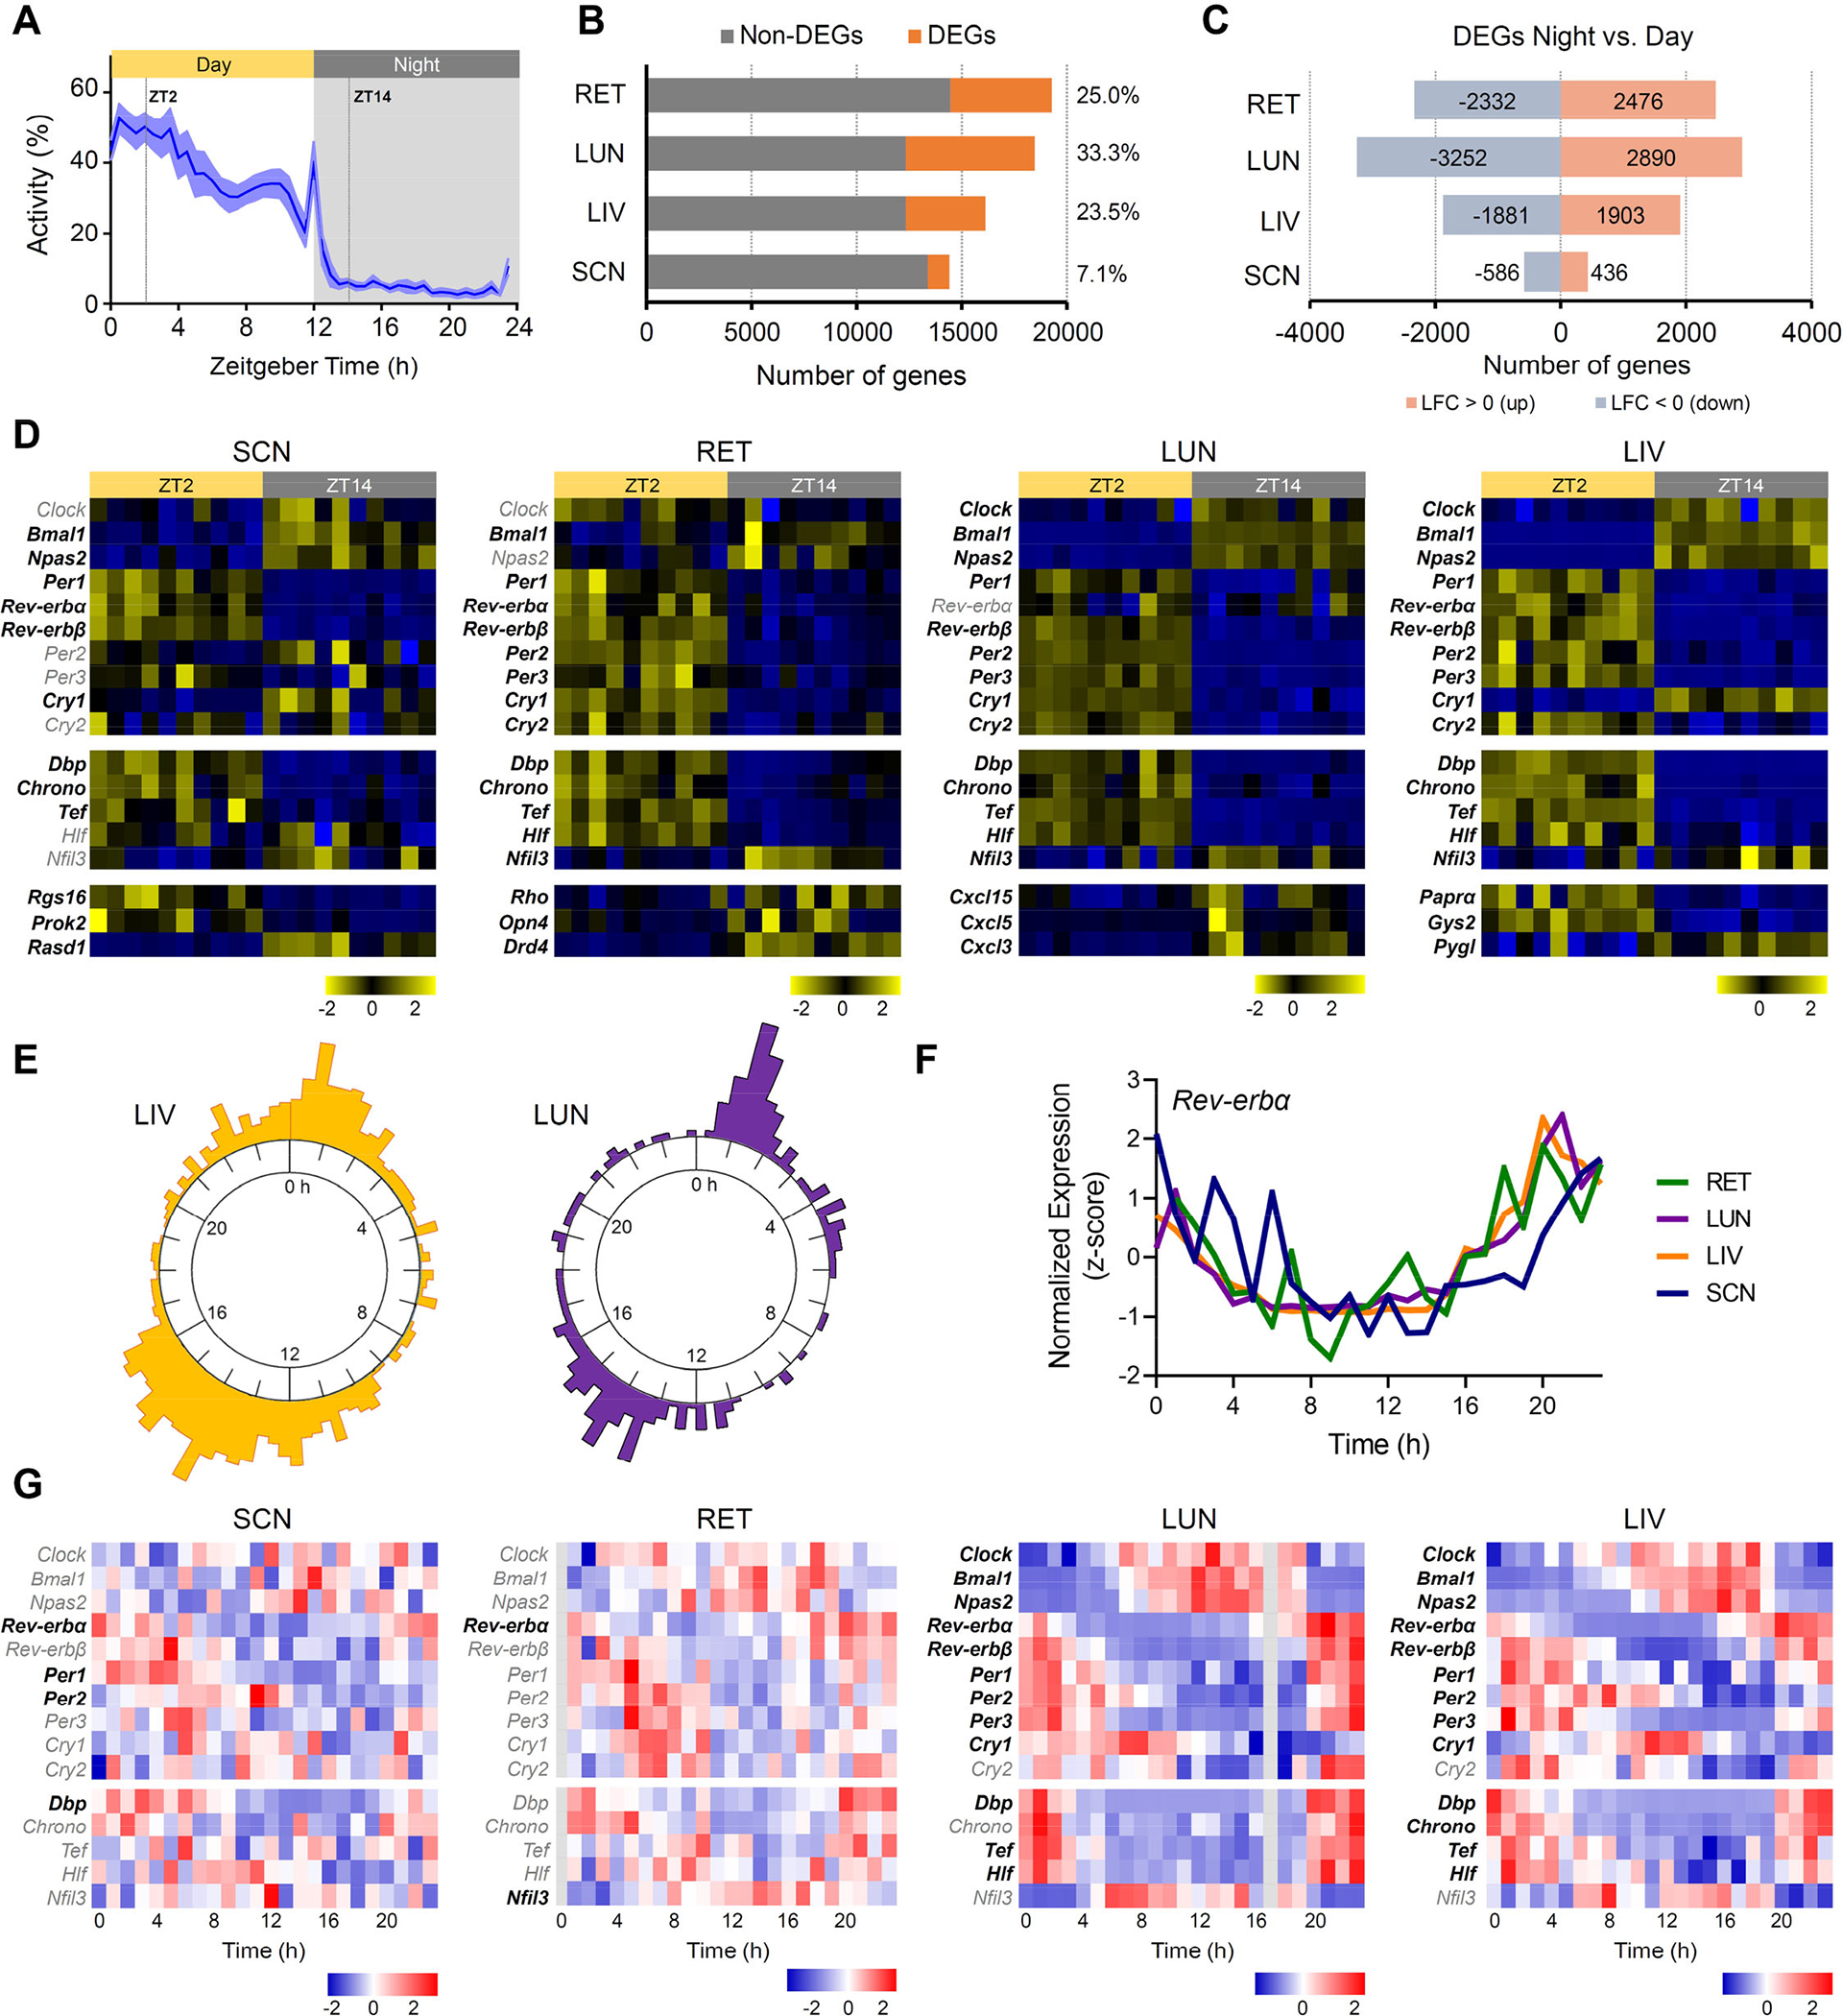
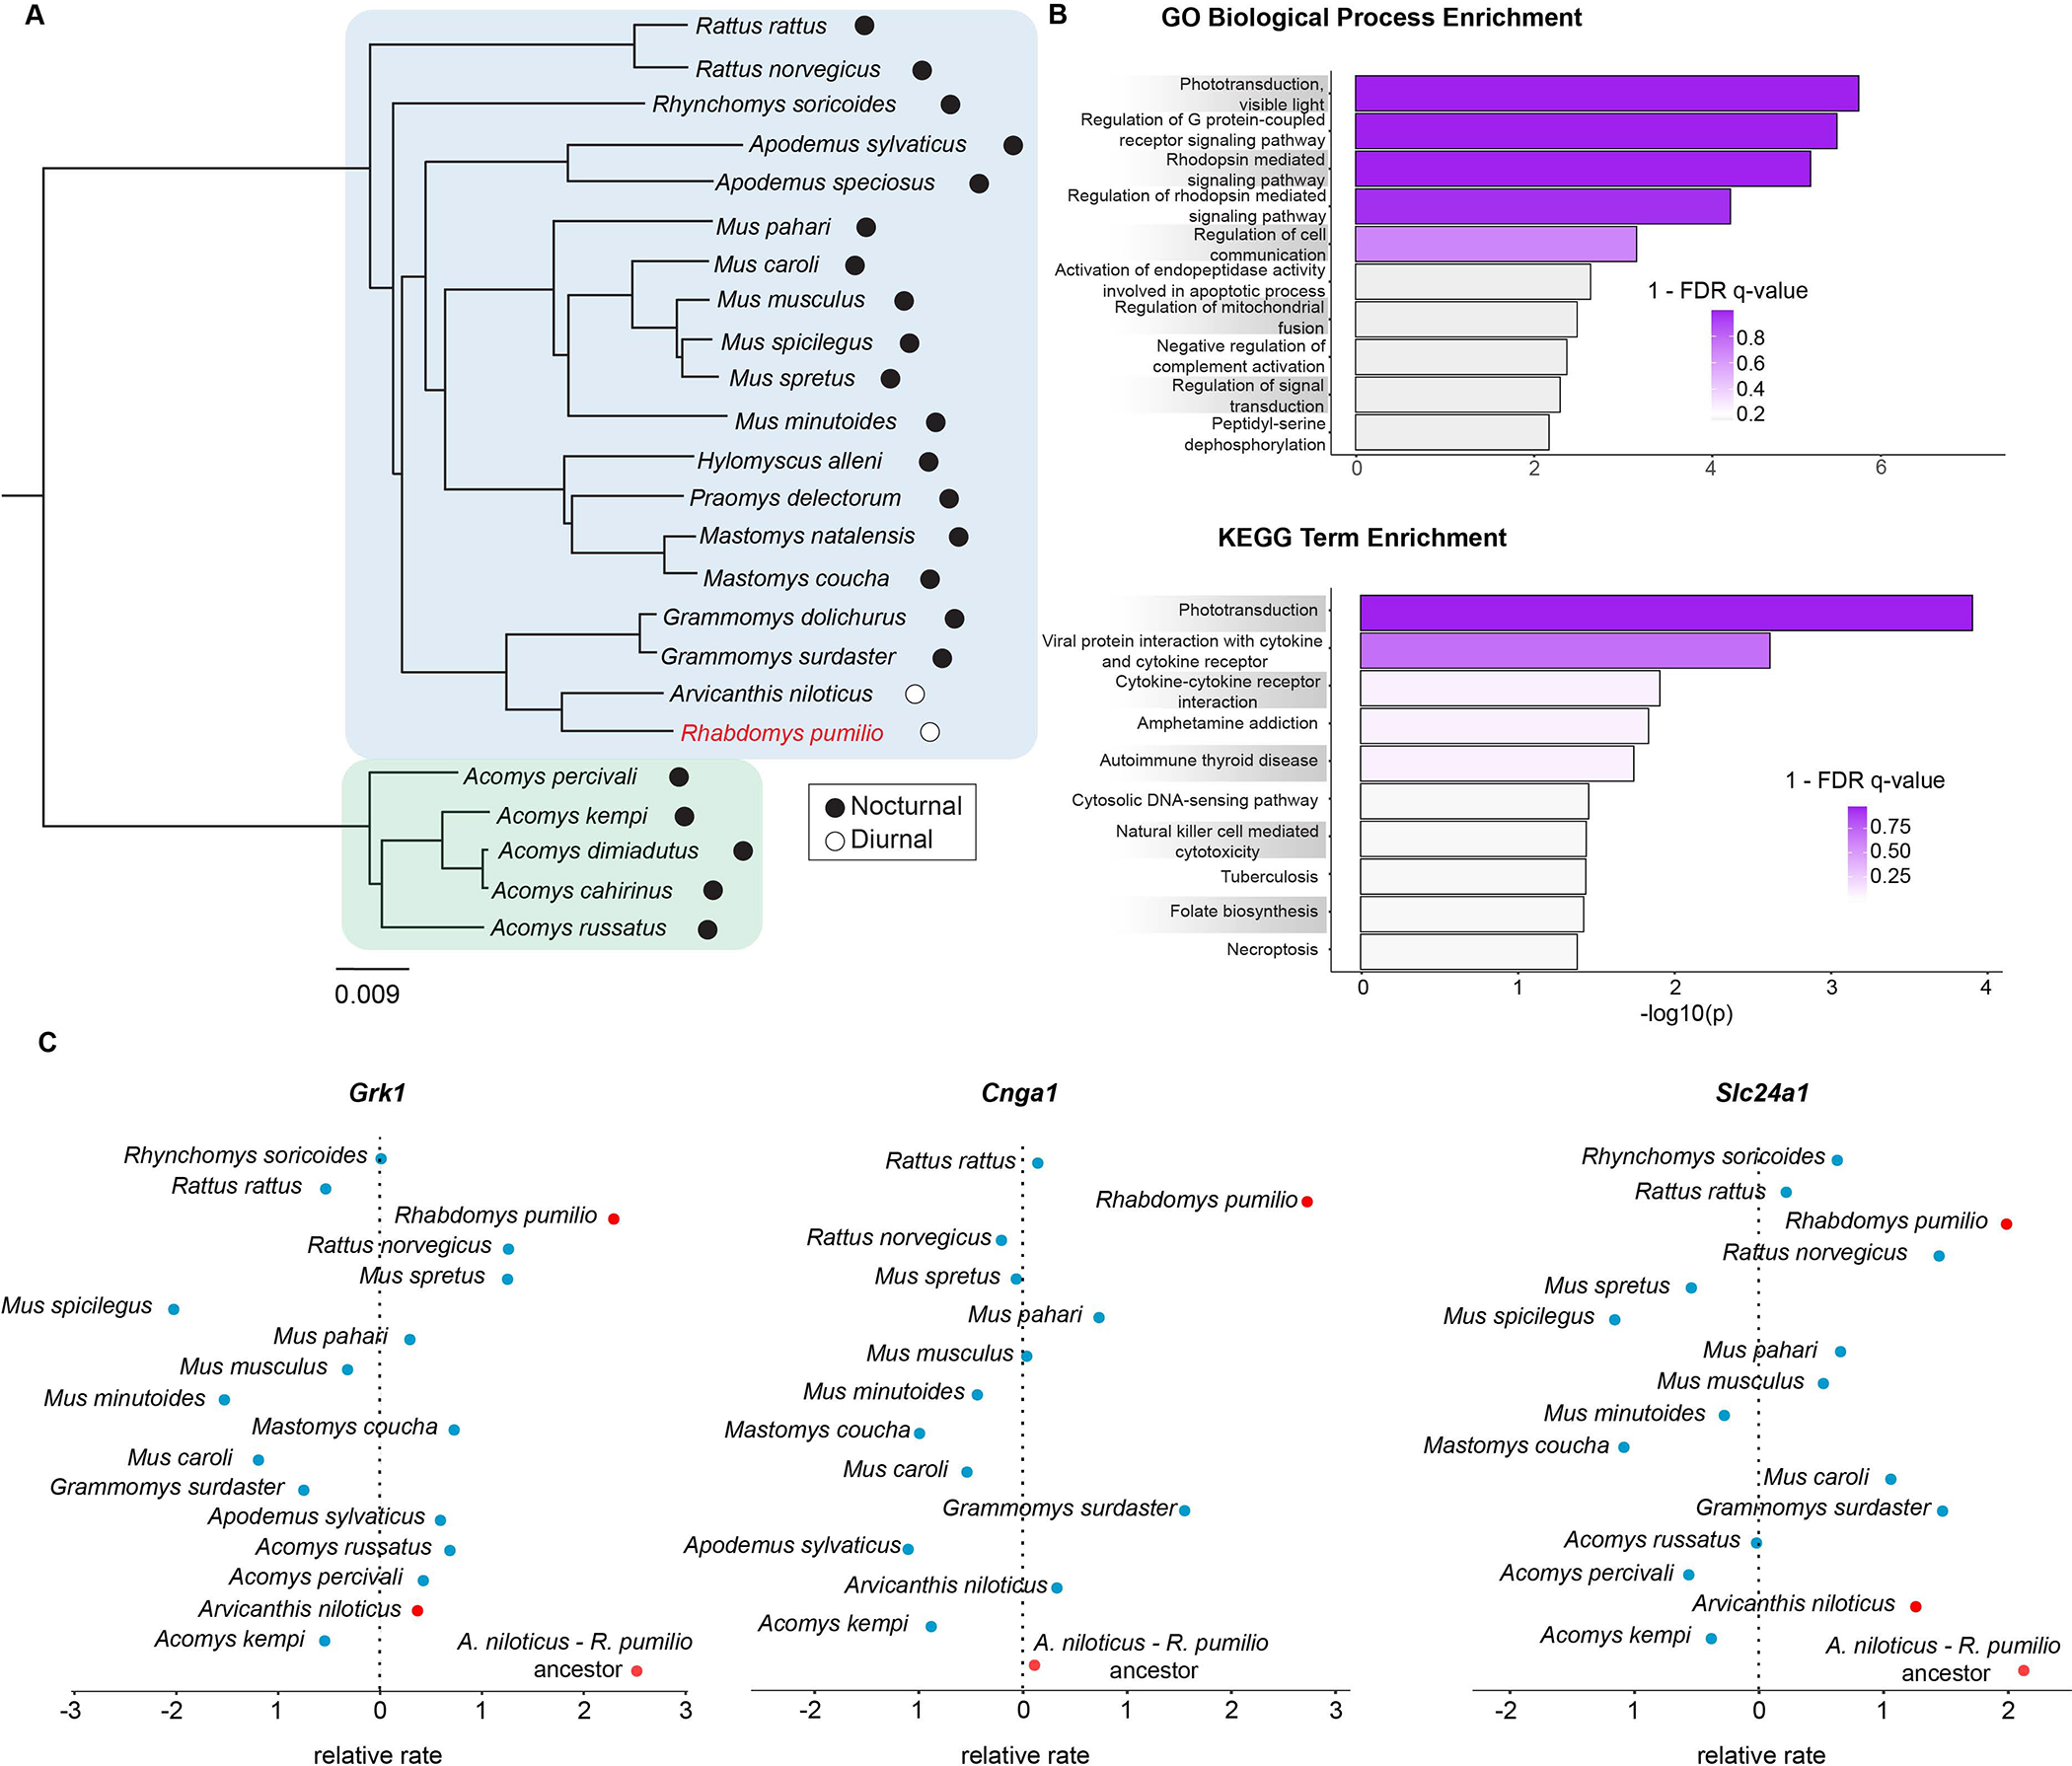
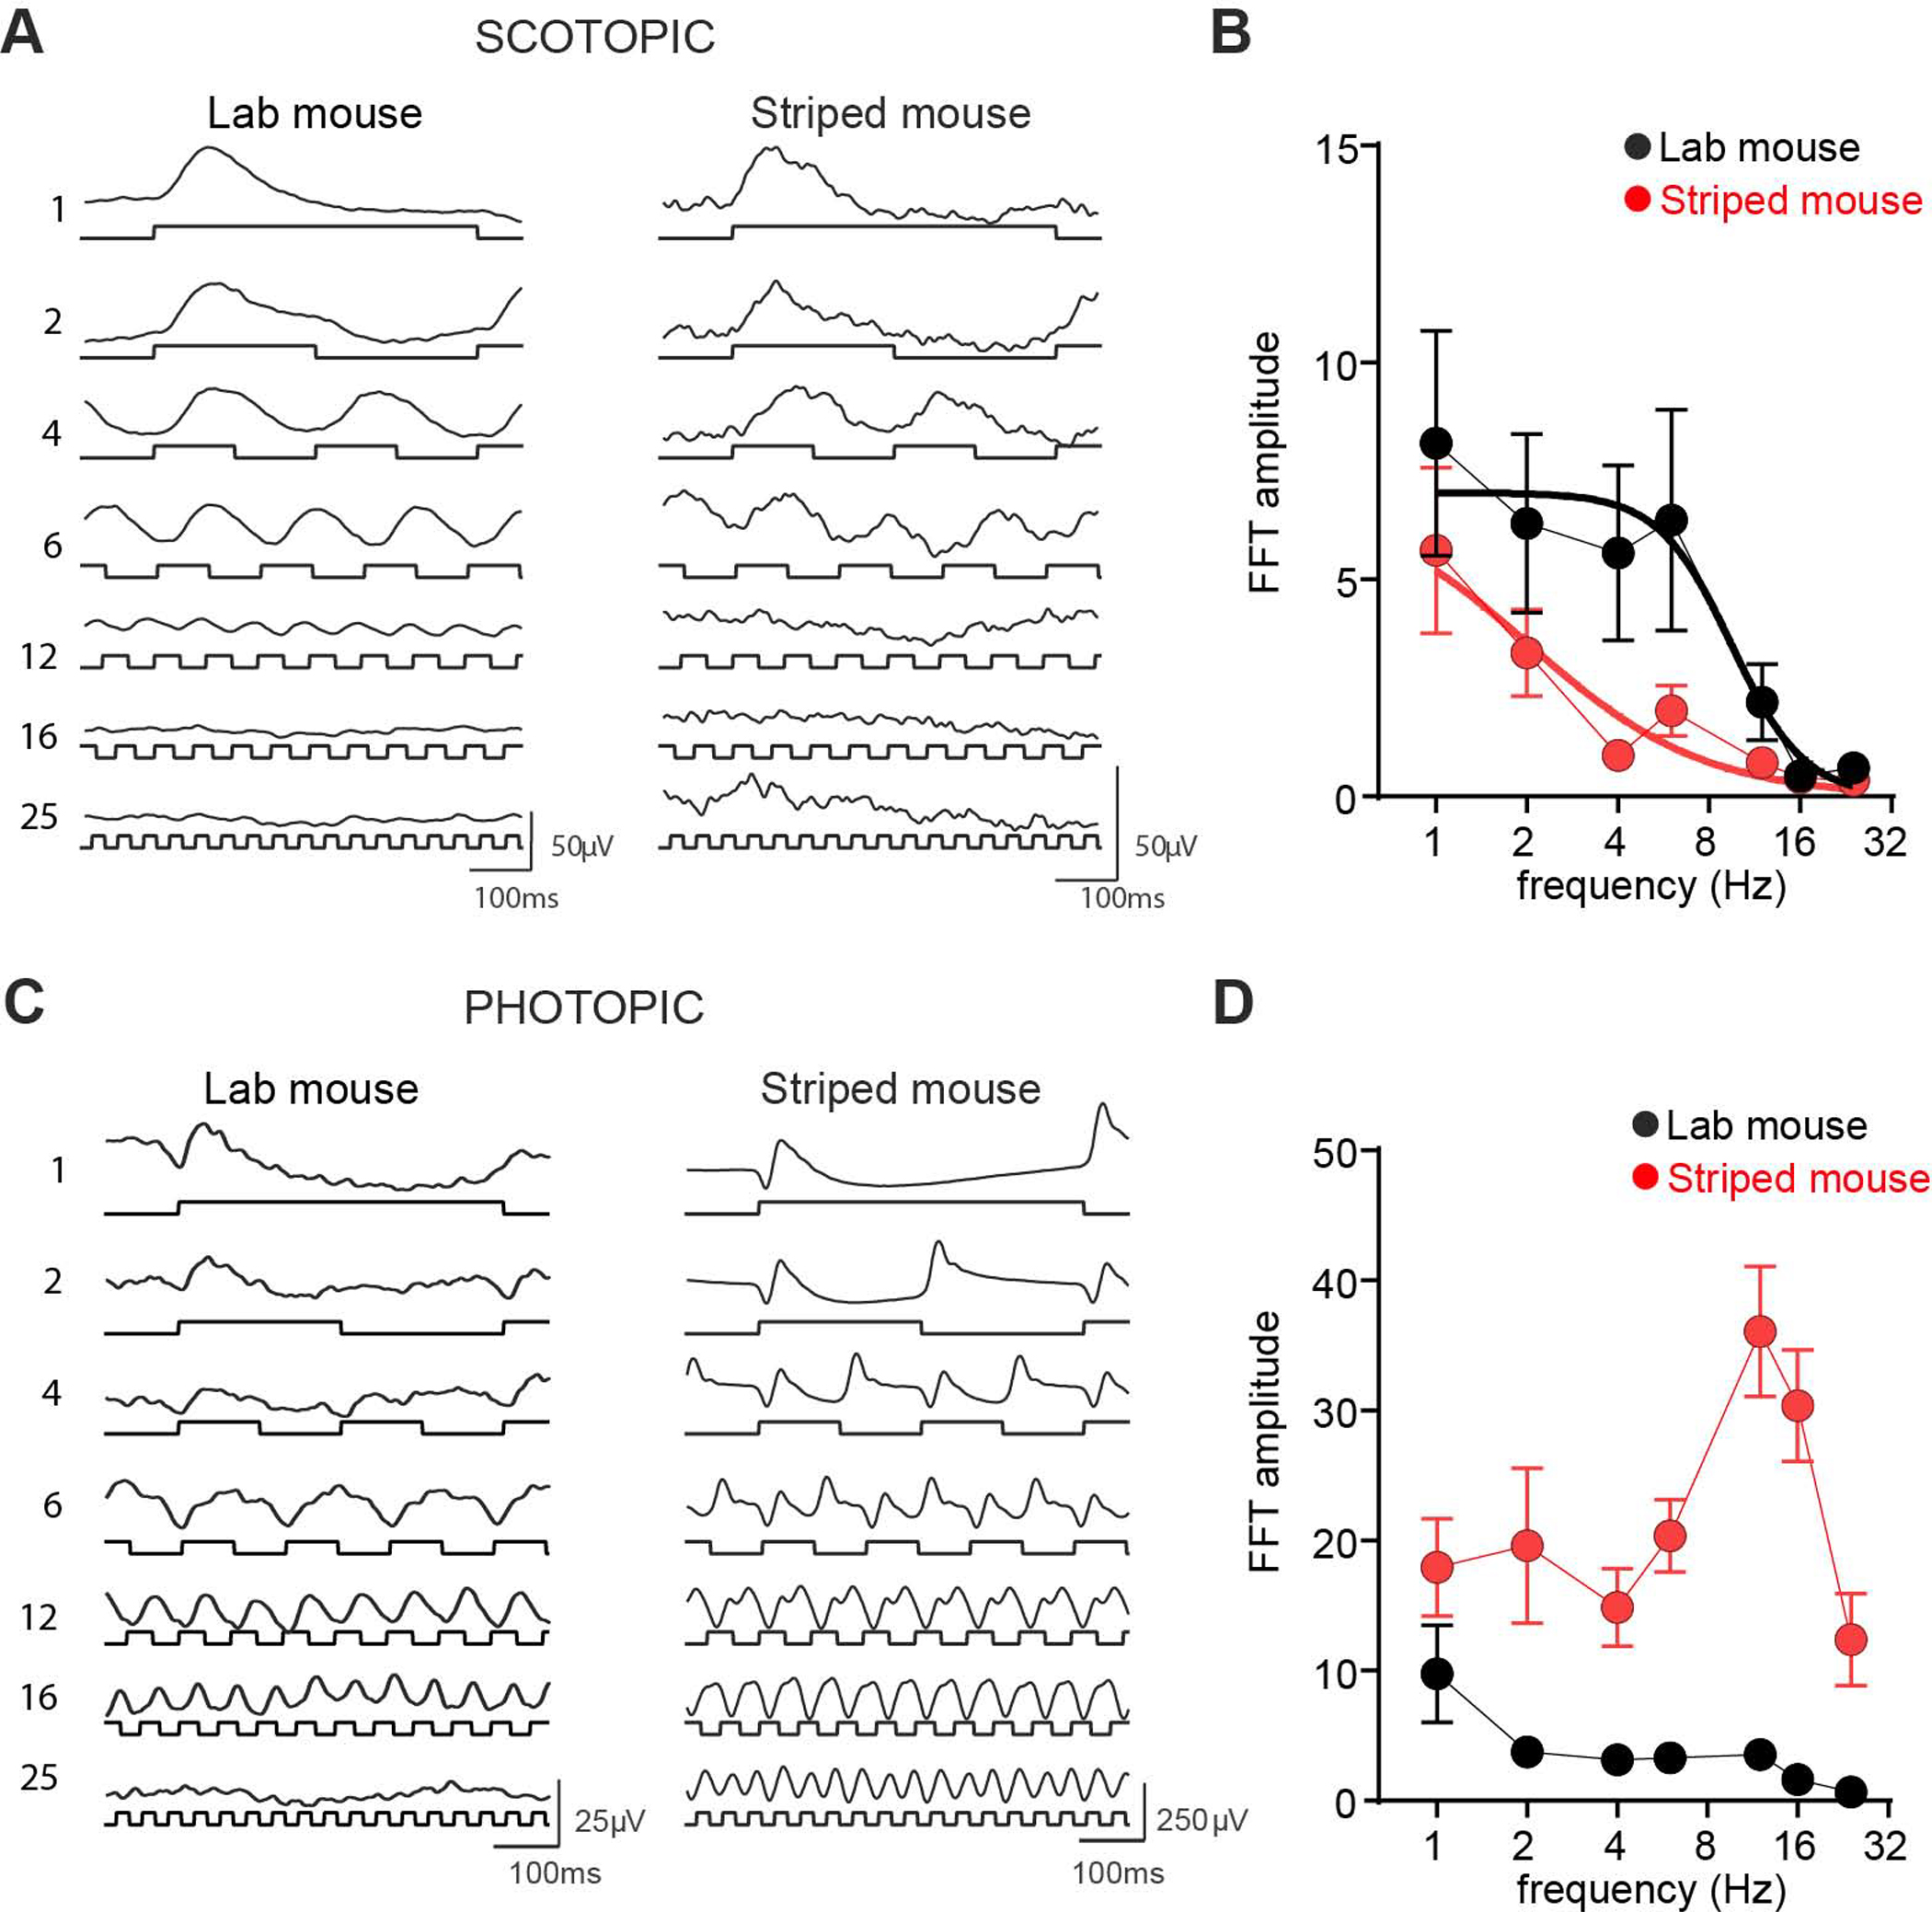
Patterns of diel activity-how animals allocate their activity throughout the 24-h daily cycle-play key roles in shaping the internal physiology of an animal and its relationship with the external environment.1,2,3,4,5 Although shifts in diel activity patterns have occurred numerous times over the course of vertebrate evolution,6 the genomic correlates of such transitions remain unknown. Here, we use the African striped mouse (Rhabdomys pumilio), a species that transitioned from the ancestrally nocturnal diel niche of its close relatives to a diurnal one,7,8,9,10,11 to define patterns of naturally occurring molecular variation in diel niche traits. First, to facilitate genomic analyses, we generate a chromosome-level genome assembly of the striped mouse. Next, using transcriptomics, we show that the switch to daytime activity in this species is associated with a realignment of daily rhythms in peripheral tissues with respect to the light:dark cycle and the central circadian clock. To uncover selection pressures associated with this temporal niche shift, we perform comparative genomic analyses with closely related rodent species and find evidence of relaxation of purifying selection on striped mouse genes in the rod phototransduction pathway. In agreement with this, electroretinogram measurements demonstrate that striped mice have functional differences in dim-light visual responses compared with nocturnal rodents. Taken together, our results show that striped mice have undergone a drastic change in circadian organization and provide evidence that the visual system has been a major target of selection as this species transitioned to a novel temporal niche.

Keywords: African striped mouse; Rhabdomys; circadian organization; circadian rhythm; comparative genomics; diurnality; molecular oscillator; phototransduction; temporal niche.


Conflict of interest statement

Declaration of interests The authors declare no competing interests.

Figures

Figure 1.
Figure 1.. The striped mouse reference genome.
(A) Adult striped mouse photographed during the day, showing its characteristic dorsal stripe pattern. (B) Hi-C contact map of the 24 chromosome-scale scaffolds. Enrichment of long-range contacts is shown in red. Higher pixel intensity (red) represents a greater number of contacts between loci. Strong enrichment along the diagonal demonstrates accurate scaffold assembly. (C) Comparison of BUSCO gene recovery in the striped mouse reference genome compared to that of 23 other species in the family Muridae. The striped mouse shows high recovery of single-copy mammalian benchmark orthologs with low rates of duplication and fragmentation. Photography credit: Trevor Hardaker. See also Figure S1 and Data S1A, B.
Figure 2.
Figure 2.. Rhythmicity of the diurnal African striped mouse transcriptome across central and peripheral tissues.
(A) Daily general activity pattern of striped mice under 12h light: 12h dark cycle. Values are expressed as mean ± SEM (n=10). Grey area indicates period of darkness. Zeitgeber time ZT0 corresponds to time of lights on. Dotted lines indicate timing of tissue collection during the day (ZT2) and at night (ZT14). (B) Number of day:night differentially expressed genes (DEGs; orange) and non-DGE (grey) across different tissues (retina (RET), lung (LUN), liver (LIV), and suprachiasmatic nucleus (SCN)). Numbers on the right indicate the percentage (%) of DEGs within each tissue. (C) Number of down- and up-regulated DEGsat night compared to daytime across tissues. Numbers of genes upregulated at night (log2 fold change (LFC>0) are indicated in orange and those downregulated (LFC<0) in blue. Only genes with an adjusted p-value below 0.05 were considered as DEGs. (D) Heatmaps showing expression levels (normalized values, z-score) for core clock genes (Clock, Bmal1, Npas2, Pers, Crys, Rev-erb, Chrono, Dpb, Tef, Hlf and Nfil3) and representative genes key for specific local-tissue function during the day (ZT2) and at night (ZT14). Squares across rows correspond to individual samples (n=10 day and n=10 night). Gene labels in black indicate DEGs. (E) Radial phase plot showing the distribution of times of peak expression relative to prior light:dark cycle (Time 0 = time of lights on) for genes that exhibited circadian rhythmicity in liver (left) and lung (right) under constant dark conditions (841 and 202 genes, respectively). (F) Circadian profile of Rev-erbα expression across the four tissues (Time 0 = clock time of lights on for prior light:dark cycle). (G) Heatmaps showing expression levels (normalized values, z-score) for core clock genes (Clock, Bmal1, Npas2, Pers, Crys, Rev-erb, Chrono, Dpb, Tef, Hlf and Nfil3) in SCN, RET, LIV and LUN collected over 24h in constant dark conditions (at 1h interval). Gene labels in bold indicate cycling genes with a BH.Q <0.1. Grey columns in the RET (Time 0h) and LUN (Time 17h) heatmaps represent missing data. See also Figure S2 and Data S1.
Figure 3.
Figure 3.. Selection on phototransduction genes.
(A) A phylogeny of species used in comparative genomic analyses. Blue colour indicates the subfamily Murinae to which the striped mouse (red font) belongs. Green colour indicates the genus Acomys (subfamily Deomyinae) which served as an outgroup. (B) Enrichment of Gene Ontology Biological Process and KEGG pathway terms among striped mouse genes showing the greatest evolutionary acceleration relative to the background rate. Striped mouse accelerated genes are highly enriched for functions related to phototransduction, particularly those related to the rhodopsin cascade. Colour indicates FDR q-value. (C) Plots showing the relative evolutionary rates (RERs) of three core genes involved in rhodopsin-mediated phototransduction: Rhodopsin Kinase (Grk1), Cyclic Nucleotide Gated Channel Subunit Alpha 1 (Cnga1), and Solute Carrier Family 24 Member 1 (Slc24a1). Compared to closely related murids (blue), phototransduction locus orthologs in the striped mouse (red) show a markedly elevated evolutionary rate. See also Figures S3, S4 and Data S1C–J.
Figure 4.
Figure 4.. ERG responses in African striped mice and Laboratory mice.
(A) Mean ERG traces from laboratory mice (left) and striped mice (right) in response to square-wave modulations (80.5% Michelson contrast) presented against a dim (9.6 log photons/cm2/s) background. Frequency in Hz shown to left, and light modulation shown below each trace. Scale bar = 100ms (x-axis), 50μV (y axis). (B) Mean±SEM FFT amplitude at modulation frequency for square-wave modulation across frequency range at 9.6 log photons/cm2/s background for laboratory mice (black) and striped mice (red). Data for each species are fitted with a separate sigmoidal curve (F test comparison p<0.001) with variable slope. C and D as A and B but for stimuli presented against a bright background (14.6 log photons/cm2/s). Scale bar = 100ms (x-axis), 25μV or 250μV (y axis) for laboratory and striped mice respectively. n=5 per group.

Comment in

Similar articles

Cited by

References

    1. Kronfeld-Schor N, and Dayan T (2003). Partitioning of Time as an Ecological Resource. Annu. Rev. Ecol. Evol. Syst. 34, 153–181.
    1. Penteriani V, del Mar Delgado M, Alonso-Alvarez C, and Sergio F (2006). The importance of visual cues for nocturnal species: eagle owls signal by badge brightness. Behav. Ecol. 18, 143–147.
    1. Schmitz L, and Motani R (2010). Morphological differences between the eyeballs of nocturnal and diurnal amniotes revisited from optical perspectives of visual environments. Vision Res. 50, 936–946. - PubMed
    1. Barton RA, Purvis A, and Harvey PH (1995). Evolutionary radiation of visual and olfactory brain systems in primates, bats and insectivores. Philos. Trans. R. Soc. Lond. B Biol. Sci. 348, 381–392. - PubMed
    1. Gerkema MP, Davies WIL, Foster RG, Menaker M, and Hut RA (2013). The nocturnal bottleneck and the evolution of activity patterns in mammals. Proc. Biol. Sci. 280, 20130508. - PMC - PubMed

Publication types

LinkOut - more resources