. 2023 Sep;22(9):100623.
doi: 10.1016/j.mcpro.2023.100623. Epub 2023 Jul 21.

A Comparative Analysis of Data Analysis Tools for Data-Independent Acquisition Mass Spectrometry

Affiliations

A Comparative Analysis of Data Analysis Tools for Data-Independent Acquisition Mass Spectrometry

Fangfei Zhang et al. Mol Cell Proteomics. 2023 Sep.

Abstract

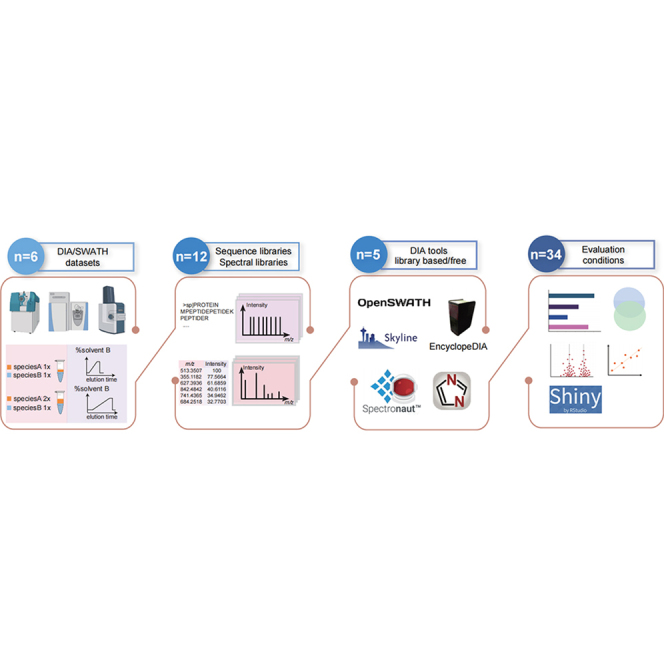
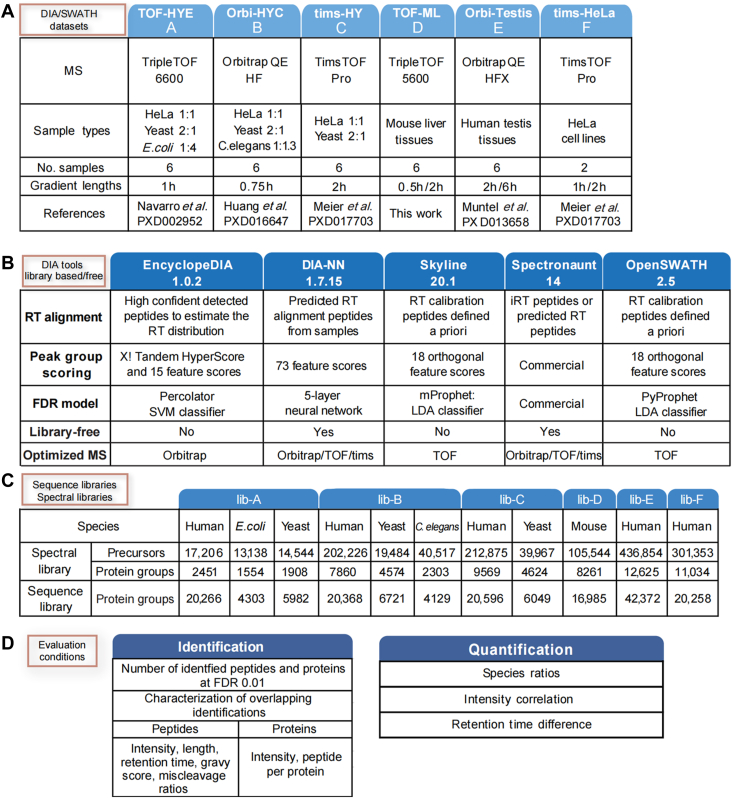
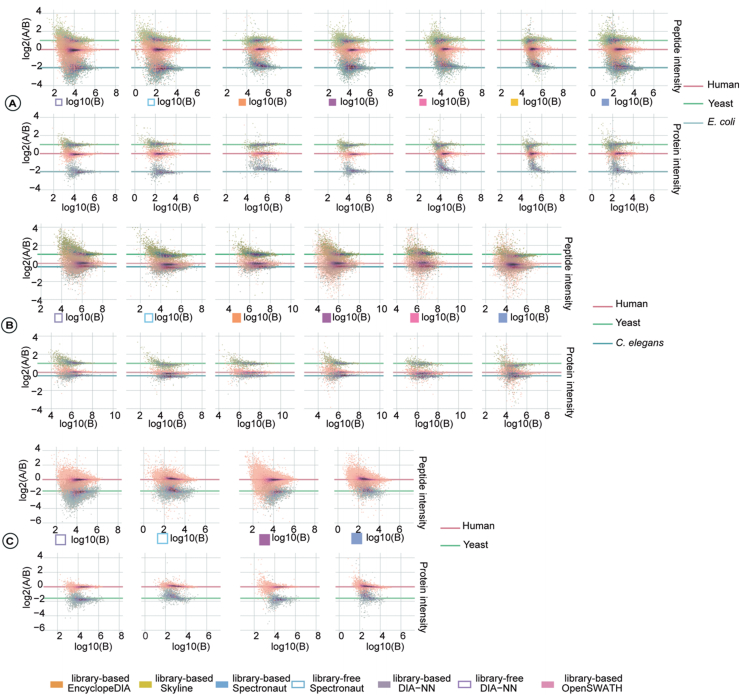
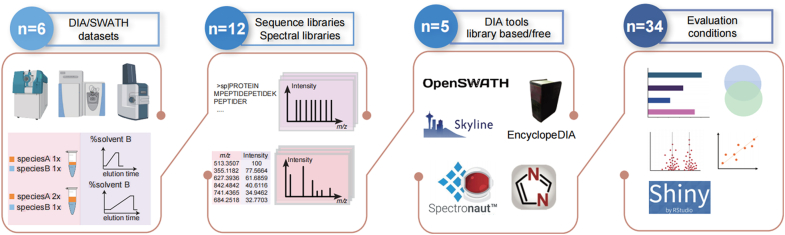
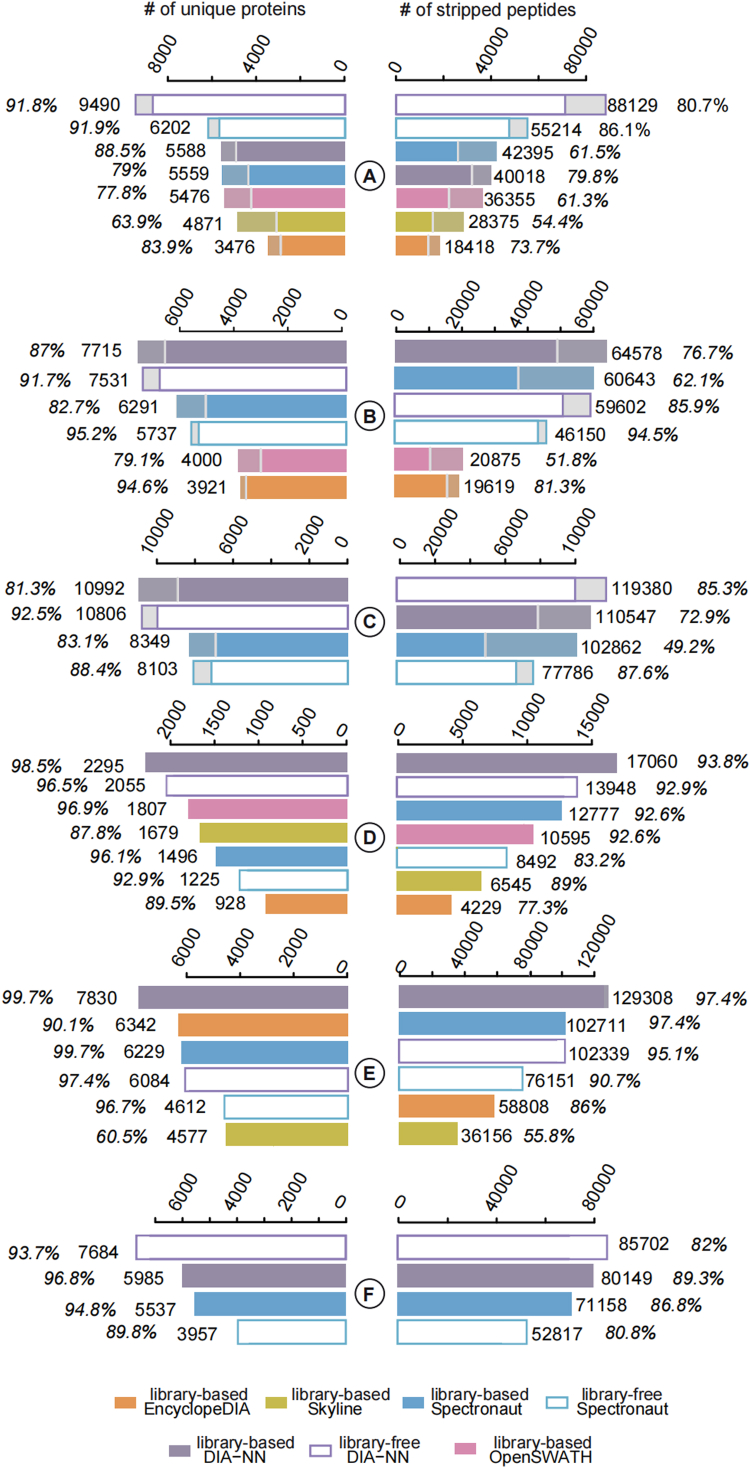
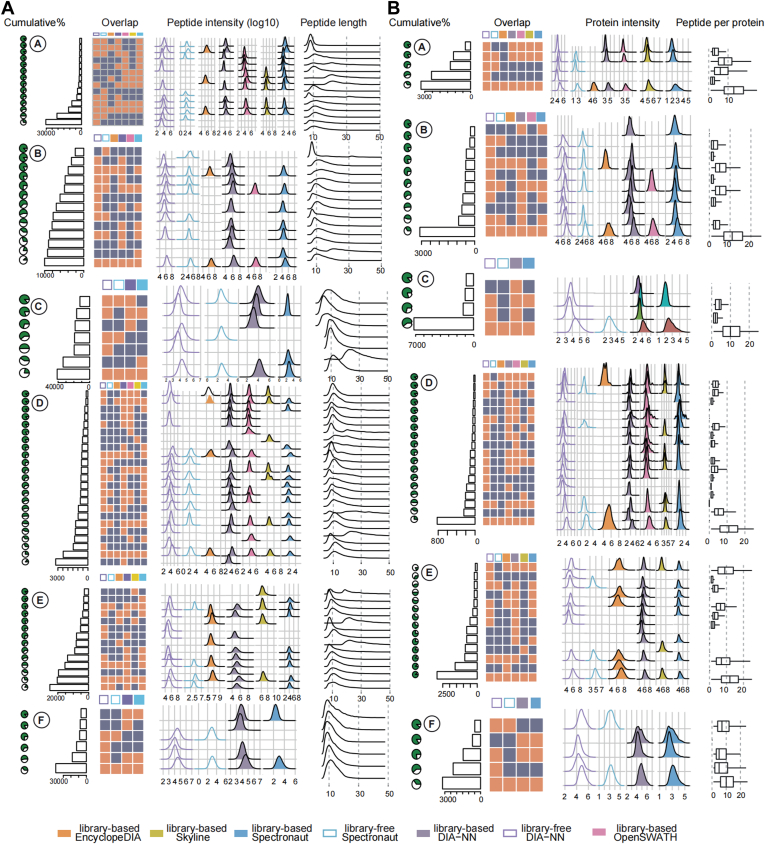
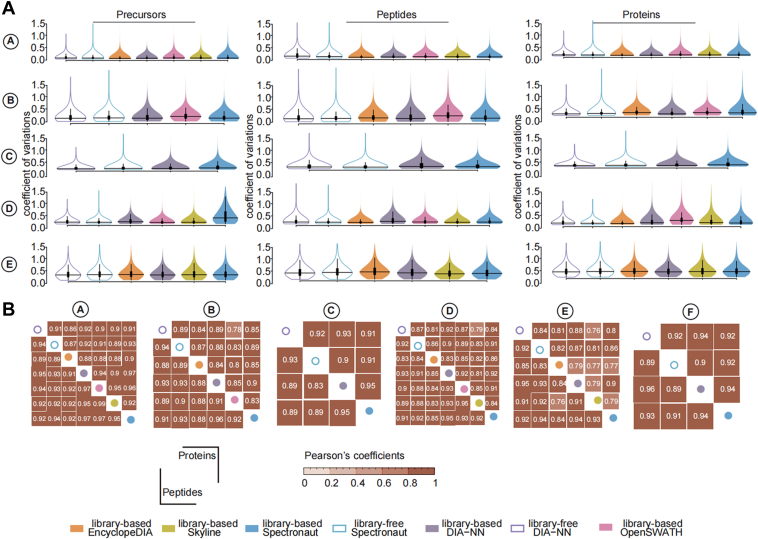
Data-independent acquisition (DIA) mass spectrometry-based proteomics generates reproducible proteome data. The complex processing of the DIA data has led to the development of multiple data analysis tools. In this study, we assessed the performance of five tools (OpenSWATH, EncyclopeDIA, Skyline, DIA-NN, and Spectronaut) using six DIA datasets obtained from TripleTOF, Orbitrap, and TimsTOF Pro instruments. By comparing identification and quantification metrics and examining shared and unique cross-tool identifications, we evaluated both library-based and library-free approaches. Our findings indicate that library-free approaches outperformed library-based methods when the spectral library had limited comprehensiveness. However, our results also suggest that constructing a comprehensive library still offers benefits for most DIA analyses. This study provides comprehensive guidance for DIA data analysis tools, benefiting both experienced and novice users of DIA-mass spectrometry technology.

Keywords: DIA-NN; EncyclopeDIA; OpenSWATH; Skyline; Spectronaut; data-independent acquisition; mass spectrometry; proteomics.


Conflict of interest statement

Conflict of interest T. G. is shareholder of Westlake Omics, Inc. W. G., L. H., D. L., and L. L. were employees of Westlake Omics, Inc. when they participated in this project.

Figures

None
Graphical abstract
Fig. 2
Fig. 2
Study details.A, details of the DIA datasets were used to evaluate the data analysis tools. B, for each dataset, the composition of their spectral and sequence libraries is detailed here. C, three main aspects enclose the most relevant features of the DIA data analysis tools that we evaluated: RT alignment, peak group scoring, and the FDR model. D, details of the metrics used to evaluate the identification and quantification results. DIA, data-independent acquisition; FDR, false discovery rate; RT, retention time.
Fig. 6
Fig. 6
Evaluation of quantification in multispecies datasets. The plots show the distributions of the log2(A and B) against log10(B) of the intensity values for datasets AC at peptide and protein levels. The tools are indicated with color legend in the middle. The species names are indicated at the right for each dataset. Solid lines indicate the true quantification ratios.
Fig. 1
Fig. 1
Study workflow. The study workflow involves the utilization of six datasets generated from three types of mass spectrometers. These datasets are used to benchmark five DIA data analysis tools: OpenSWATH, EncylcopeDIA, Skyline, Spectronaut, and DIA-NN. For each dataset, a total of 12 libraries, consisting of six sequence libraries and six spectral libraries, are analyzed using the five DIA data analysis tools. The performance evaluation of the data analysis tools comprises 34 different tests. The tests assess various aspects, including the numbers of identified peptides/proteins, overlaps between identifications, CVs, and cross-tool correlations. An R-shiny server is developed. DIA, data-independent acquisition.
Fig. 3
Fig. 3
Evaluation of peptide and protein identifications. Stripped peptides (top bars) and unique proteins (bottom bars) are plotted for each dataset (named as AF in Fig. 2A). Search modes are library-free (hollow bars) or library-based (solid bars). The solid color region below the middle white line indicates the identifications that passes the truthfulness validation.
Fig. 4
Fig. 4
Characterization of cross-tool identifications. A, identified peptides. B, identified proteins. From top to bottom, the results from datasets AF are shown. The “overlap” column highlights in red when overlapping identifications across tools are found. The rows describe the intersecting combinations. The cumulative count percentage is indicated in the leftmost pie charts. The ridge plots represent the distribution of the log10 peptide/protein intensity derived from different tools. Peptide lengths are indicated for peptides and peptides per proteins are indicated for proteins.
Fig. 5
Fig. 5
Evaluation of DIA quantification.A, the CVs are calculated at the precursor, peptide, and protein level, and are here plotted for the DIA data analysis tools evaluated in this study. The median values were indicated as text below the violins. B, Pearson’s correlations of the peptide and protein intensity were derived from each tool pair. DIA, data-independent acquisition.

References

    1. Aebersold R., Mann M. Mass-spectrometric exploration of proteome structure and function. Nature. 2016;537:347–355. - PubMed
    1. Guo T., Kouvonen P., Koh C.C., Gillet L.C., Wolski W.E., Röst H.L., et al. Rapid mass spectrometric conversion of tissue biopsy samples into permanent quantitative digital proteome maps. Nat. Med. 2015;21:407–413. - PMC - PubMed
    1. Gillet L.C., Navarro P., Tate S., Röst H., Selevsek N., Reiter L., et al. Targeted data extraction of the MS/MS spectra generated by data-independent acquisition: a new concept for consistent and accurate proteome analysis. Mol. Cell Proteomics. 2012;11:O111–016717. - PMC - PubMed
    1. Meier F., Brunner A.D., Frank M., Ha A., Bludau I., Voytik E., et al. diaPASEF: parallel accumulation-serial fragmentation combined with data-independent acquisition. Nat. Methods. 2020;17:1229–1236. - PubMed
    1. Venable J.D., Dong M.Q., Wohlschlegel J., Dillin A., Yates J.R. Automated approach for quantitative analysis of complex peptide mixtures from tandem mass spectra. Nat. Methods. 2004;1:39–45. - PubMed

Publication types

LinkOut - more resources