

Treatment of adult ALL patients with third-generation CD19-directed CAR T cells: results of a pivotal trial
- PMID: 37481608
- PMCID: PMC10363324
- DOI: 10.1186/s13045-023-01470-0
Treatment of adult ALL patients with third-generation CD19-directed CAR T cells: results of a pivotal trial
Abstract
Background: Third-generation chimeric antigen receptor (CAR)-engineered T cells (CARTs) might improve clinical outcome of patients with B cell malignancies. This is the first report on a third-generation CART dose-escalating, phase-1/2 investigator-initiated trial treating adult patients with refractory and/or relapsed (r/r) acute lymphoblastic leukemia (ALL).
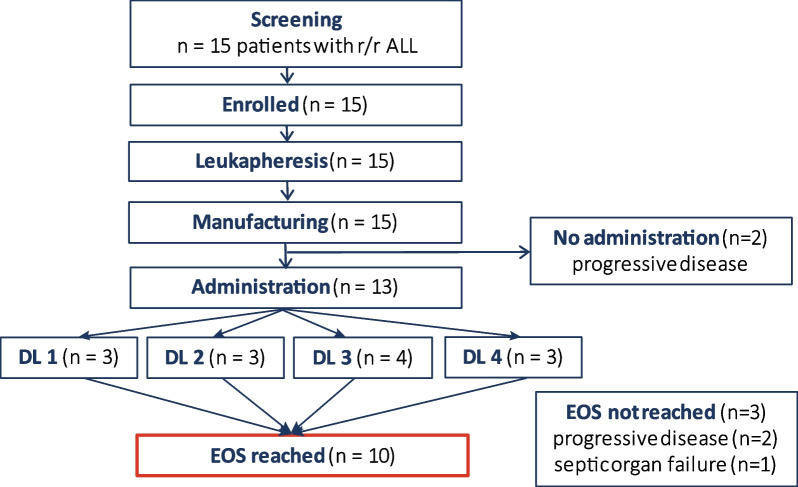
Methods: Thirteen patients were treated with escalating doses of CD19-directed CARTs between 1 × 10⁶ and 50 × 106 CARTs/m2. Leukapheresis, manufacturing and administration of CARTs were performed in-house.
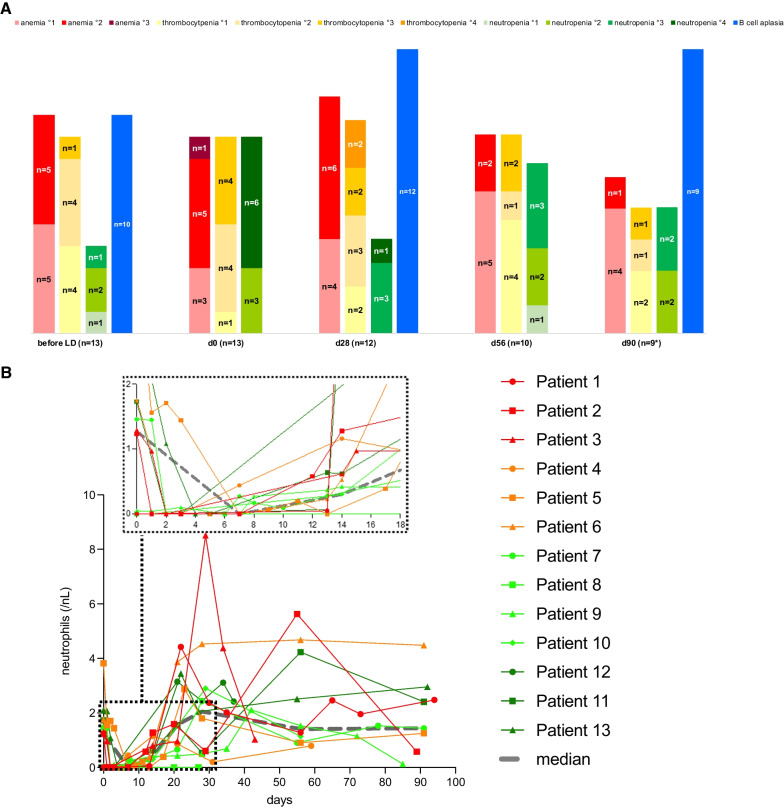
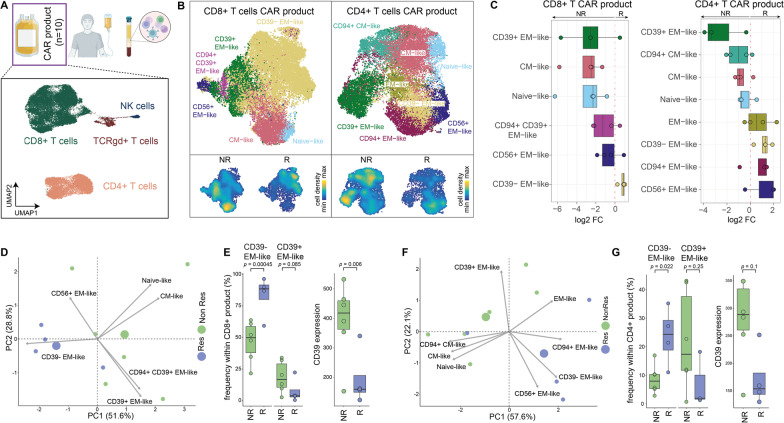
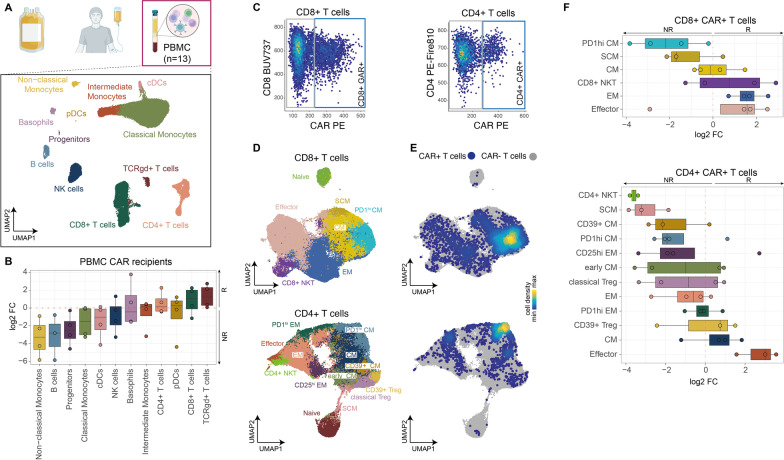
Results: For all patients, CART manufacturing was feasible. None of the patients developed any grade of Immune effector cell-associated neurotoxicity syndrome (ICANS) or a higher-grade (≥ grade III) catokine release syndrome (CRS). CART expansion and long-term CART persistence were evident in the peripheral blood (PB) of evaluable patients. At end of study on day 90 after CARTs, ten patients were evaluable for response: Eight patients (80%) achieved a complete remission (CR), including five patients (50%) with minimal residual disease (MRD)-negative CR. Response and outcome were associated with the administered CART dose. At 1-year follow-up, median overall survival was not reached and progression-free survival (PFS) was 38%. Median PFS was reached on day 120. Lack of CD39-expression on memory-like T cells was more frequent in CART products of responders when compared to CART products of non-responders. After CART administration, higher CD8 + and γδ-T cell frequencies, a physiological pattern of immune cells and lower monocyte counts in the PB were associated with response.
Conclusion: In conclusion, third-generation CARTs were associated with promising clinical efficacy and remarkably low procedure-specific toxicity, thereby opening new therapeutic perspectives for patients with r/r ALL. Trial registration This trial was registered at www.
Clinicaltrials: gov as NCT03676504.
Keywords: Acute lymphoblastic leukemia (ALL); CART-associated toxicities; CD39; Cytokine release syndrome (CRS); Cytopenia; Immune effector cell-associated neurotoxicity syndrome (ICANS); Investigator-initiated trial (IIT); Third-generation chimeric antigen receptor (CAR) T cells.
© 2023. The Author(s).
Conflict of interest statement
AS: Travel grants from Hexal and Jazz Pharmaceuticals. Research grant from Therakos/Mallinckrodt. Consultancy BMS, Janssen-Cilag. Co-founder and part-time employee of TolerogenixX LtD. of TolerogenixX Ltd. CMT: research support from Bayer AG. Advisory board member Pfizer, Janssen-Cilag GmbH. Grants and/or provision of investigational medicinal products from Pfizer, Daiichi Sankyo, BiolineRx. FL: Advisory roles for Novartis, Incyte, Sanofi Aventis and Bristol-Myers Squibb. GB: Research support from Novartis; Consultancy for Novartis, Pfizer, Gilead, Celgene; Honoraria from Jazz, Celgene, Gilead; Travel support from Neovii, Jazz, Gilead. JC: Travel grants: Pfizer, Ipsen, Medac; Adboard: Pfizer, Merck, Ipsen, MSD; Consultancy: Pfizer, Merck, Medac. JK: Consultancy Novartis, Global Blood Therapeutics, bluebird bio. MB: consulting fees from Amgen and PRMA, research funding from Amgen, honoraria/travel grants from Jazz, Celgene, Novartis, Pfizer and Amgen, advisory board member for Incyte and Amgen. MLS: consultancy for Kite/Gilead, Takeda. MS: research grants from Apogenix, Hexal and Novartis. Travel grants from Hexal and Kite. Financial support for educational activities and conferences from bluebird bio, Kite and Novartis. Advisory board member of MSD. (Co-)PI of clinical trials of MSD, GSK, Kite and BMS. Co-Founder and shareholder of TolerogenixX Ltd. PD: consultancy AbbVie, AstraZeneca, Gilead, Janssen, Novartis, Riemser, Roche; speakers bureau AbbVie, Gilead, Novartis, Riemser, Roche; research support from Neovii and Riemser. None of the mentioned sources supported the work described within this manuscript. PDe: honorarium from MSD. PWu: Research support from the German Red Cross Blood Service Baden-Württemberg – Hessen gGmbH. Advisory Board Member of Sanofi-Aventis. TS: Consultant AbbVie, Takeda, Astellas, Amgen, Bristol-Myers Squibb, Gilead, Ridgeline Discoveries. Honorarium: Pfizer, AbbVie, Jazz Pharmaceuticals. Financial support congress participation: AbbVie, Jazz Pharmaceuticals., ADH, AHK, AKei, AKul, AKun, AN, BM, BN, DH, DV, DW, FK, JF, LJS, LW, MG, MRi, NG, PP, PW, SH, SLa, SY: none.
Figures
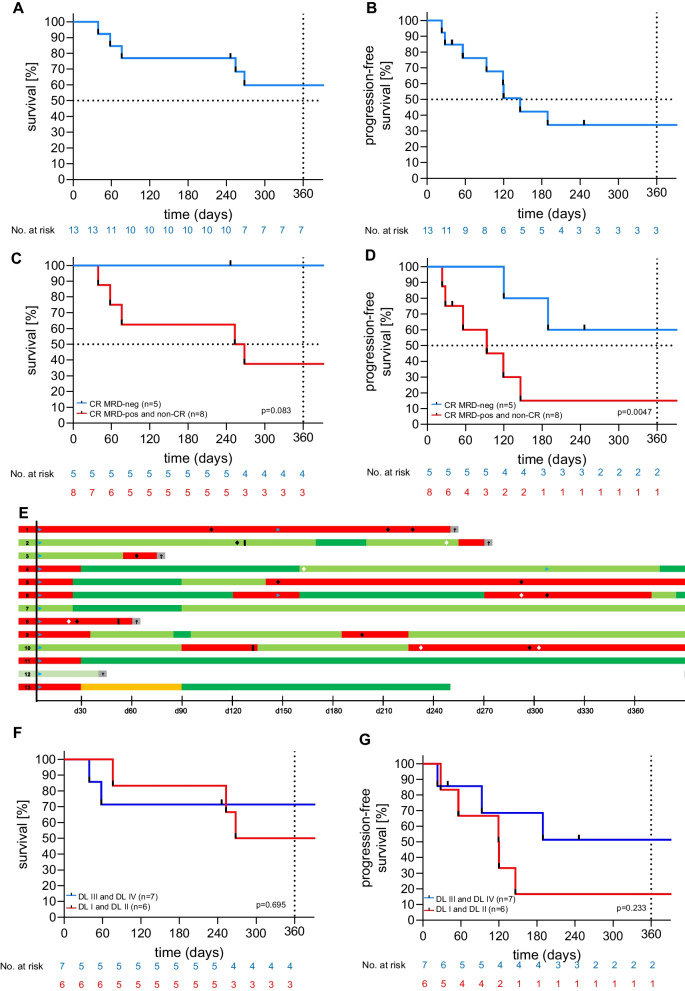
 : CART therapy.
 : allogeneic stem cell transplantation.
 : antibody treatment.
 : chemotherapy.
 : progressive disease (PD),
 : partial remission (PR),
 : stable disease (SD),
 : MRD-positive complete remission (CR),
 : MRD-negative complete remission/metabolic CR (CR*), †: death
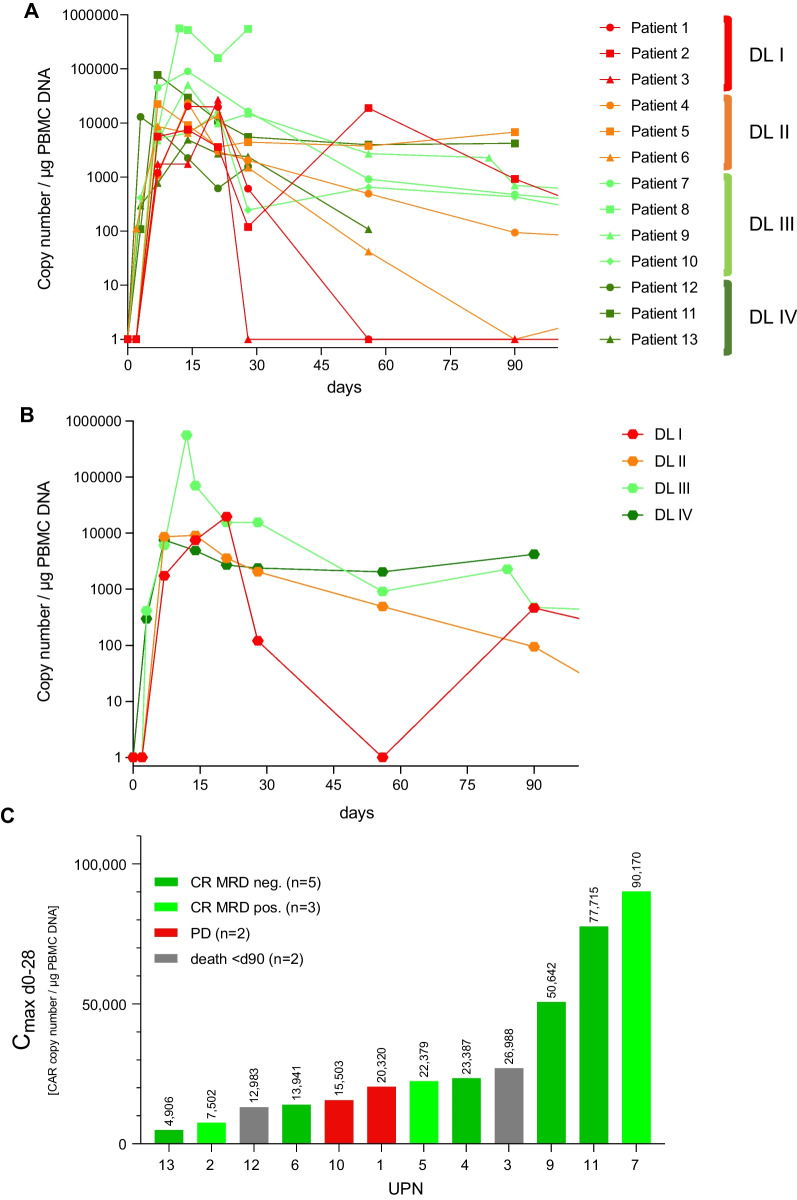
References
-
- European Medicines Agency. Yescarta - axicabtagene ciloleucel. 2022. Available from: https://www.ema.europa.eu/en/medicines/human/EPAR/yescarta.
-
- European Medicines Agency. Kymriah - tisagenlecleucel. 2022. Available from: https://www.ema.europa.eu/en/medicines/human/EPAR/kymriah.
-
- European Medicines Agency. Tecartus - brexucabtagene autoleucel. 2022. Available from: https://www.ema.europa.eu/en/medicines/human/EPAR/tecartus.
-
- European Medicines Agency. Breyanzi - lisocabtagene maraleucel. 2022. Available from: https://www.ema.europa.eu/en/medicines/human/EPAR/breyanzi.
Publication types
MeSH terms
Substances
Associated data
LinkOut - more resources
Full Text Sources
Other Literature Sources
Medical
Research Materials
