. 2023 Oct 4;31(10):2872-2886.
doi: 10.1016/j.ymthe.2023.07.016. Epub 2023 Jul 22.

Dual-locus, dual-HDR editing permits efficient generation of antigen-specific regulatory T cells with robust suppressive activity

Affiliations

Dual-locus, dual-HDR editing permits efficient generation of antigen-specific regulatory T cells with robust suppressive activity

Martina S Hunt et al. Mol Ther. .

Abstract

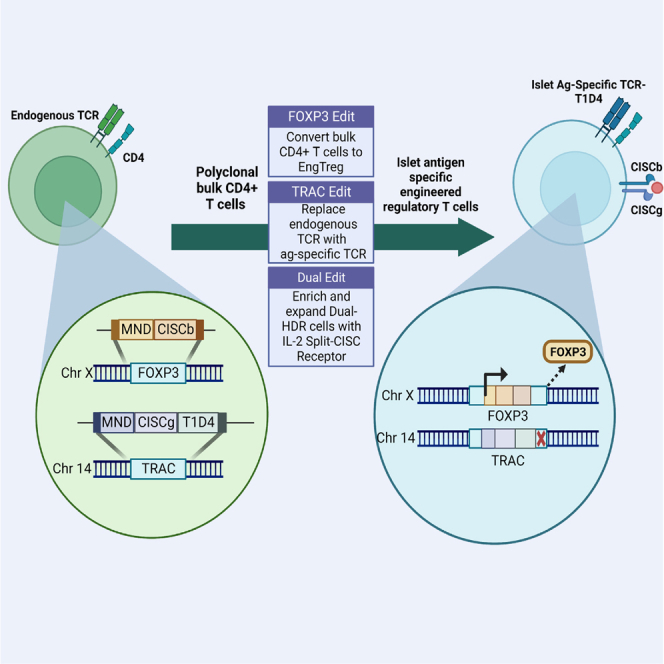
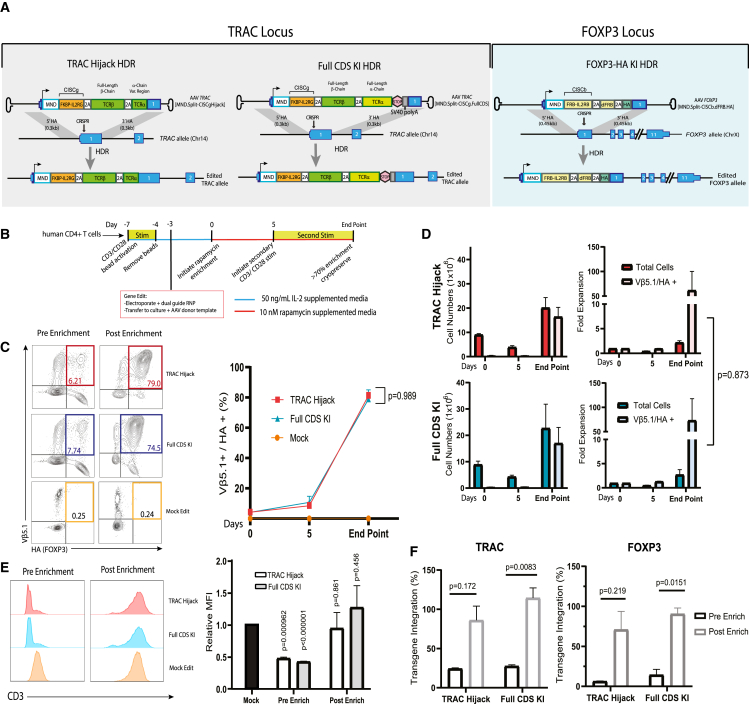
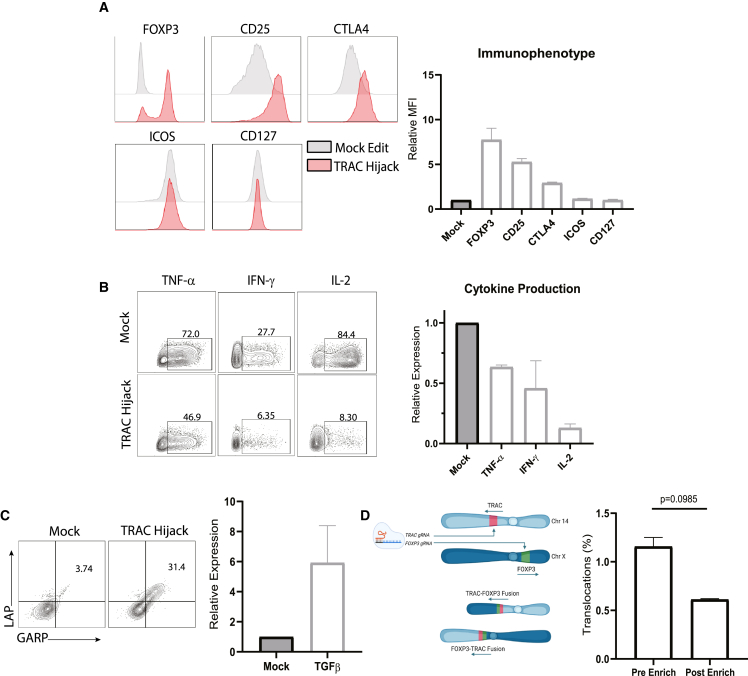
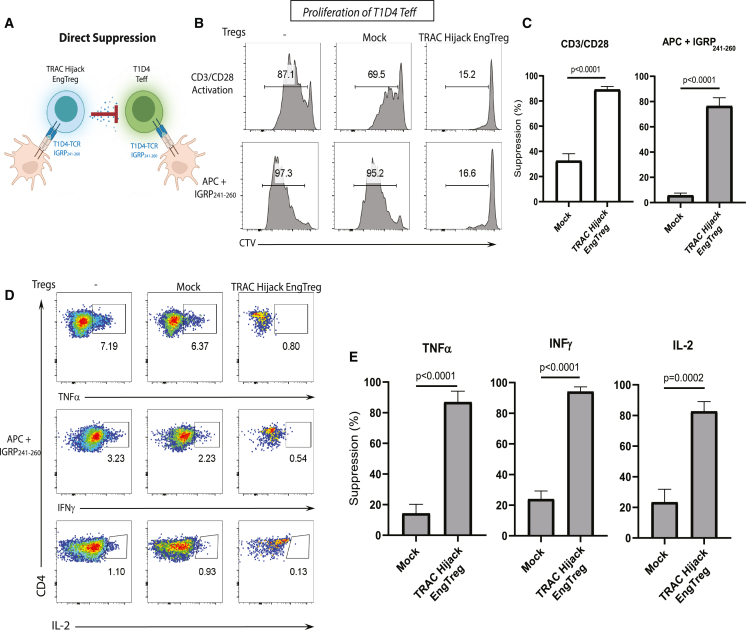
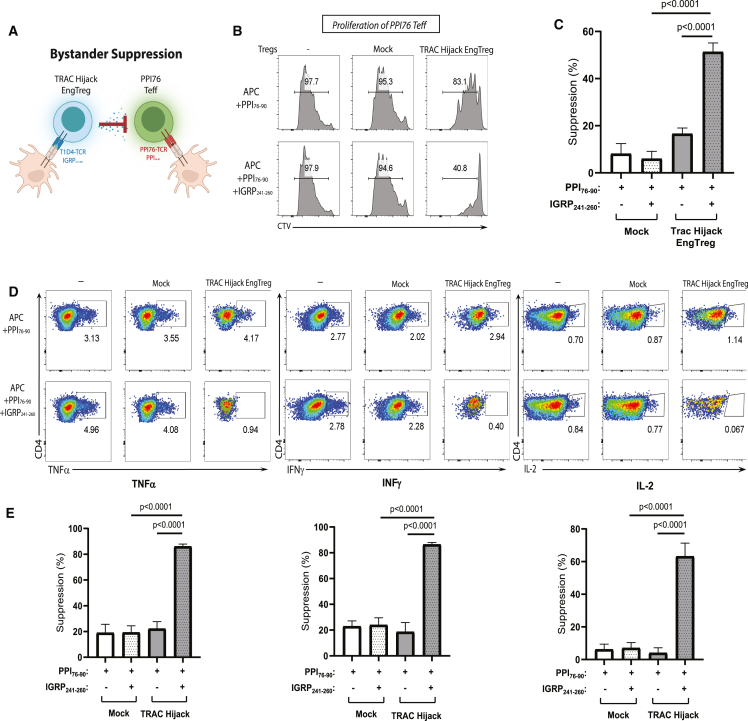
Adoptive regulatory T (Treg) cell therapy is predicted to modulate immune tolerance in autoimmune diseases, including type 1 diabetes (T1D). However, the requirement for antigen (ag) specificity to optimally orchestrate tissue-specific, Treg cell-mediated tolerance limits effective clinical application. To address this challenge, we present a single-step, combinatorial gene editing strategy utilizing dual-locus, dual-homology-directed repair (HDR) to generate and specifically expand ag-specific engineered Treg (EngTreg) cells derived from donor CD4+ T cells. Concurrent delivery of CRISPR nucleases and recombinant (r)AAV homology donor templates targeting FOXP3 and TRAC was used to achieve three parallel goals: enforced, stable expression of FOXP3; replacement of the endogenous T cell receptor (TCR) with an islet-specific TCR; and selective enrichment of dual-edited cells. Each HDR donor template contained an alternative component of a heterodimeric chemically inducible signaling complex (CISC), designed to activate interleukin-2 (IL-2) signaling in response to rapamycin, promoting expansion of only dual-edited EngTreg cells. Using this approach, we generated purified, islet-specific EngTreg cells that mediated robust direct and bystander suppression of effector T (Teff) cells recognizing the same or a different islet antigen peptide, respectively. This platform is broadly adaptable for use with alternative TCRs or other targeting moieties for application in tissue-specific autoimmune or inflammatory diseases.

Keywords: AAV6; CISC; CRISPR; Treg; ag-specific; dual-HDR; enrichment.


Conflict of interest statement

Declaration of interests D.J.R. is a scientific co-founder and scientific advisory board (SAB) member of GentiBio, Inc. and scientific co-Founder and SAB member of BeBiopharma, Inc. D.J.R. received past and current funding from GentiBio, Inc. for related work. J.B. is a scientific co-founder and SAB member of GentiBio, Inc. J.B. received past and current funding from GentiBio, Inc. for related work. D.J.R., P.J.C., and J.B. are inventors on patents describing methods for generating ag-specific engineered regulatory T cells and/or use of the CISC platform.

Figures

None
Graphical abstract
Figure 1
Figure 1
Biallelic dual-HDR editing at the TRAC locus using Split-CISC cassettes allows selective enrichment and expansion of dual-edited cells (A) Schematic showing the TRAC locus and AAV donor templates designed to introduce the CISC elements via CRISPR-meditated HDR, with each donor template carrying one-half of the CISC heterodimer. Successful biallelic editing of the TRAC locus (bottom) is predicted to generate one allele (allele A) with the MND promoter driving expression of a GFP fluorophore and cis-linked Split-CISCb (FRB-IL-2RB fusion protein) and a second allele (allele B) with MND driving expression of an mCherry fluorophore and cis-linked Split-CISCg (FKBP-IL-2RG fusion protein) and dFRB. (B) Representative flow panels resulting from HDR editing of primary human CD4+ T cells using no AAV donor (mock), AAV TRAC[MND.GFP.Split-CISCb] alone (GFP edit), AAV TRAC[MND.mCherry.Split-CISCg.dFRB] alone (mCherry edit), or a 50:50 mixture of both AAV donor templates (dual edit). Numbers indicate the proportion of single- or dual-edited cells, respectively. (C) Dual-edited T Cells were expanded in the presence of 50 ng/mL IL-2, 10 nM rapamycin, 100 nM AP21967, or DMSO for 7 days. Left panel: Representative flow plots from days 0 and 7. Right panel: percentage of GFP+/mCherry+ (double-positive) cells over time (p value from two-way ANOVA). (D) Fold expansion of GFP+/mCherry+ cells cultured in rapamycin for 7 days. Data are presented as mean ± SEM for 3 technical replicates. Data shown are representative of 3 replicates.
Figure 2
Figure 2
Dual-locus, dual-HDR editing generates islet-specific EngTreg cells that can be enriched in vitro to high purity (A) Schematic showing editing strategies and anticipated outcomes following HDR. Left and center, gray panels: alternative strategies for TRAC locus editing using CRISPR targeting exon 1 and AAV donor templates designed to introduce the MND promoter driving expression of Split-CISCg and cis-linked islet ag-specific TCR (T1D4). The alternative AAV donors were designed to capture downstream components of endogenous TRAC (TRAC[MND.Split-CISCg.Hijack]) or to introduce the full-length exogenous TCR (AAV TRAC[MND.Split-CISCg.FullCDS], respectively. Right, light blue panel: editing strategy at the FOXP3 locus, targeting the first coding exon using an AAV donor (FOXP3[MND.Split-CISCb.dFRB.HA]) designed to introduce the MND promoter driving expression of Split-CISCb and endogenous FOXP3 with an N-terminal HA epitope tag. (B) Schematic showing the strategy to generate islet ag-specific EngTreg cells via HDR editing of primary human CD4+ T cells, followed by enrichment of dual-edited cells. The timing of CD3/CD28 bead stimulation, culture in 50 ng/mL IL-2-supplemented medium, and culture in 10 nM rapamycin-supplemented medium are shown. Mock-edited cells were stimulated identically using CD3/CD28 and electroporated (but not exposed to nuclease or AAV) and subsequently cultured in 50 ng/mL IL-2 alone . (C) Left panels: representative flow plots showing Vβ5.1/HA staining of TRAC Hijack, Full CDS Knock in (KI) EngTreg, and mock-edited cells pre enrichment (enrichment day 0) and post rapamycin enrichment (day of cryopreservation). Right panel: graph showing the proportion of Vβ5.1+/HA+ (double-positive) cells on enrichment days 0 and 5 and on the day of cryopreservation (p value from two-way ANOVA). (D) Quantification of total cell number and Vβ5.1+/HA+ cell number (left) and relative fold expansion (right) of TRAC Hijack and Full CDS KI EngTreg cells during cell production (p value from unpaired t test). (E) Representative flow cytometry for CD3 surface expression in TRAC Hijack and Full CDS KI EngTreg cells. Left panel: pre-enrichment (3 days post editing). Right panel: post rapamycin enrichment (day of cryopreservation). Mock-edited cells are shown for comparison; the graph shows CD3 MFI pre and post rapamycin enrichment relative to mock-edited T cells (p value from multiple unpaired t tests comparing groups with mock edit MFI). (F) Droplet digital PCR (ddPCR) data quantifying on-target transgene integration at the TRAC and FOXP3 loci, respectively, pre and post enrichment. ddPCR values were normalized using a control X-chromosomal genomic locus (∼10 kb downstream of the FOXP3 target site) (p value from paired t test). Full CDS KI EngTreg cells were manufactured using 3 peripheral blood mononuclear cell (PBMC) donors, with data from all donors represented in (C–F). TRAC hijack EngTreg cells were manufactured using the same 3 PBMC donors. (C) and (D) show data from donors 1 and 2. (E) and (F) show data from donors 2 and 3. All data are presented as mean ± SEM.
Figure 3
Figure 3
Dual-locus, dual-HDR-edited EngTreg cells exhibit a Treg cell immunophenotype and cytokine profile Shown is characterization of TRAC Hijack EngTreg cells compared with mock-edited cells. (A) Left panel: immunophenotype of enriched TRAC Hijack EngTreg cells and mock-edited controls. Right panel: cryopreserved cells were immunophenotyped using flow cytometry for Treg cell markers following a 3-day rest post thaw. The graph shows relative MFI fold change for each indicated phenotypic marker normalized to mock-edited controls. (B) TRAC Hijack EngTreg cells were treated with Monensin to halt secretion of cytokines and stimulated with PMA/ionomycin for 5 h to assess production of the proinflammatory cytokines TNF-α, IFN-γ, and IL-2. Representative flow plots (left panel) and graphs (right panel) show relative cytokine production in EngTreg cells normalized to mock-edited controls. (C) Cryopreserved TRAC Hijack EngTreg cells were stimulated with CD3/CD28 beads for 24 h and assessed, using flow cytometry, for LAP and GARP expression to identify TGF-β cytokine production. Representative flow plots (left panel) and graph (right panel) show proportion of LAP/GARP double-positive EngTreg cells compared with mock-edited controls. (D) Left panel: schematic illustrating dual sgRNA delivery targeting TRAC and FOXP3 (on chr14 and chrX, respectively) and potential balanced chromosomal translocations leading to unicentric chromosomes. Right panel: graph comparing frequency of TRAC:FOXP3 balanced translocation measured via a ddPCR assay (using primers flanking the predicted fusion site) in gDNA extracted from EngTreg cells pre vs. post rapamycin enrichment (p value is from paired t test). For (A–D), data represent 2 biological replicates, with (D) including 3 technical replicates, and are presented as mean ± SEM.
Figure 4
Figure 4
Dual-locus, dual-HDR-edited islet-specific EngTreg cells display robust on-target suppressive function (A) Schematic of direct suppression between TRAC hijack EngTreg cells bearing the T1D4 TCR and Teff cells with matched TCR specificity to IGRP241–260 in the context of ag-specific stimulation. (B) Representative flow cytometry histograms for the in vitro suppression assay in the presences of CD3/CD28 activation beads or APCs displaying IGRP241–260. Fluorescence of the CTV-labeled Teff cells is shown for the Treg cell treatment groups indicated at the top of each column after 4 days in co-culture. (C) Graphs show the percent suppression of Teff cell proliferation in response to non-specific (CD3/CD28 activation) vs. specific TCR engagement (APC+ IGRP241–260). Percentage of suppression was calculated as ([%] Teff cell proliferation without Treg cells – [%] Teff cell proliferation with Treg cells) / ([%]) Teff proliferation without Treg cells) × 100. (D) Representative flow cytometry plots for pro-inflammatory cytokine production in T1D4 Teff cells co-cultured with different EngTreg cell populations after ag-specific stimulation. (E) Quantification of percent suppression of inflammatory cytokine production (TNF-α, IFNγ, and IL-2) by mock-edited vs. TRAC Hijack EngTreg cells. Data are presented as mean ± SEM for 2 biological replicates with 2 or 3 technical replicates for CD3/CD28 stimulation or APC stimulation and cytokine production suppression, respectively. All p values are from unpaired t tests compared with mock-edited cells.
Figure 5
Figure 5
Dual-HDR-edited islet-specific EngTreg cells display bystander suppression of Teff cells with distinct ag specificity (A) Schematic of bystander suppression between TRAC hijack EngTreg cells bearing the T1D4 TCR and Teff cells bearing the PPI76 TCR specific to PPI76–90 in the context of ag-specific stimulation. (B) Representative flow cytometry histograms for the in vitro suppression assay after 4 days in culture. Fluorescence of the CTV-labeled Teff cells is shown for the Treg cell treatment groups indicated at the top of each column. Ag-specific stimulation conditions are indicated for each column. (C) Graphs show the percent suppression of PPI76 Teff cell proliferation. (D) Representative flow cytometry plots for pro-inflammatory cytokine production in PPI76 Teff cells co-cultured with no cells, mock-edited, or TRAC Hijack EngTreg cell populations after PPI76–90 ag-specific stimulation or mixed ag stimulation. (E) Quantification of percent suppression of inflammatory cytokine production by mock-edited and TRAC Hijack EngTreg cells. Data are presented as mean ± SD for 2 biological replicates with 3 technical replicates. All p values are from unpaired t tests compared with mock-edited cells.

References

    1. Raffin C., Vo L.T., Bluestone J.A. Treg cell-based therapies: challenges and perspectives. Nat. Rev. Immunol. 2020;20:158–172. - PMC - PubMed
    1. Ferreira L.M.R., Muller Y.D., Bluestone J.A., Tang Q. Next-generation regulatory T cell therapy. Nat. Rev. Drug Discov. 2019;18:749–769. - PMC - PubMed
    1. Honaker Y., Hubbard N., Xiang Y., Fisher L., Hagin D., Sommer K., Song Y., Yang S.J., Lopez C., Tappen T., et al. Gene editing to induce FOXP3 expression in human CD4(+) T cells leads to a stable regulatory phenotype and function. Sci. Transl. Med. 2020;12 - PubMed
    1. Yang S.J., Singh A.K., Drow T., Tappen T., Honaker Y., Barahmand-Pour-Whitman F., Linsley P.S., Cerosaletti K., Mauk K., Xiang Y., et al. Pancreatic islet-specific engineered T(regs) exhibit robust antigen-specific and bystander immune suppression in type 1 diabetes models. Sci. Transl. Med. 2022;14 - PubMed
    1. Fraietta J.A., Nobles C.L., Sammons M.A., Lundh S., Carty S.A., Reich T.J., Cogdill A.P., Morrissette J.J.D., DeNizio J.E., Reddy S., et al. Disruption of TET2 promotes the therapeutic efficacy of CD19-targeted T cells. Nature. 2018;558:307–312. - PMC - PubMed

MeSH terms

LinkOut - more resources