. 2023 Aug 29;42(8):112830.
doi: 10.1016/j.celrep.2023.112830. Epub 2023 Jul 22.

Premature aging and reduced cancer incidence associated with near-complete body-wide Myc inactivation

Affiliations

Premature aging and reduced cancer incidence associated with near-complete body-wide Myc inactivation

Huabo Wang et al. Cell Rep. .

Abstract

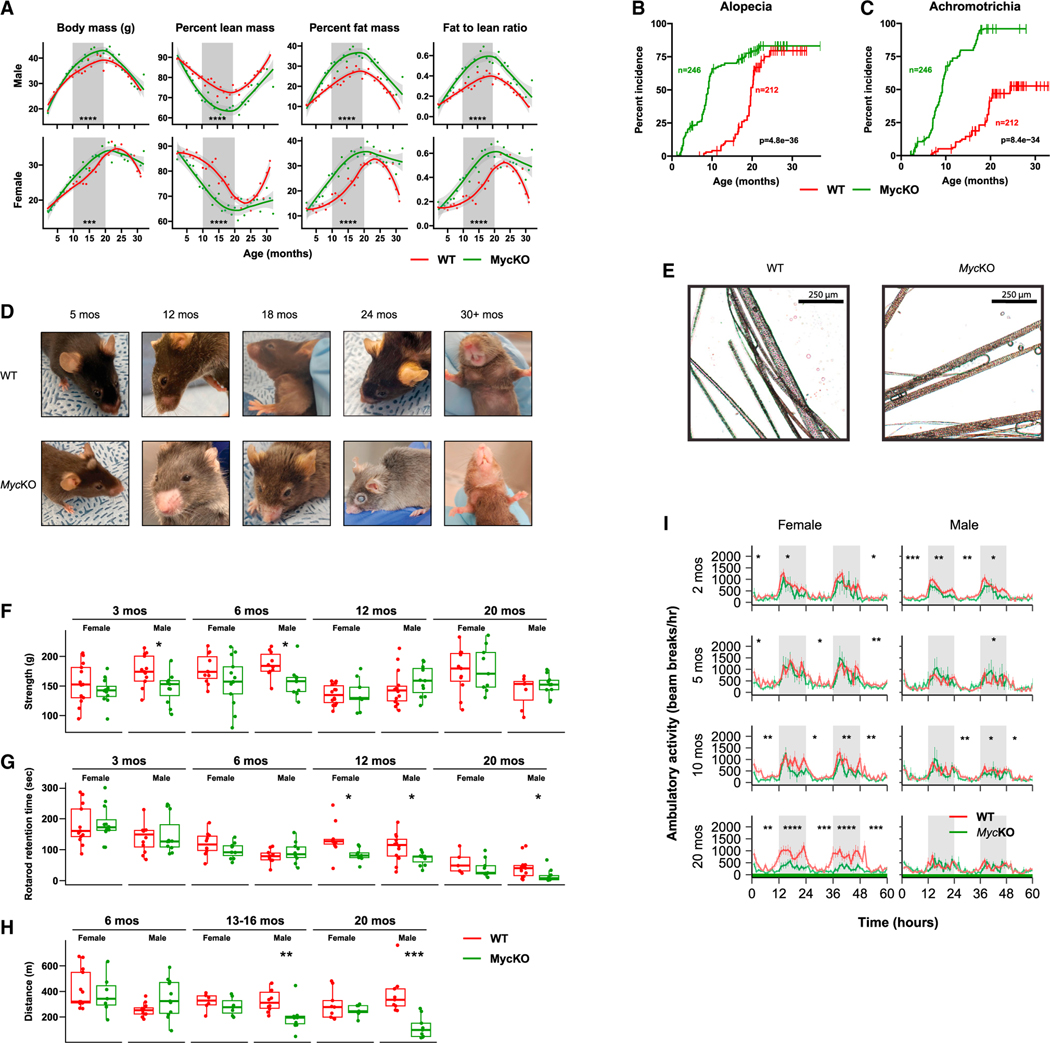
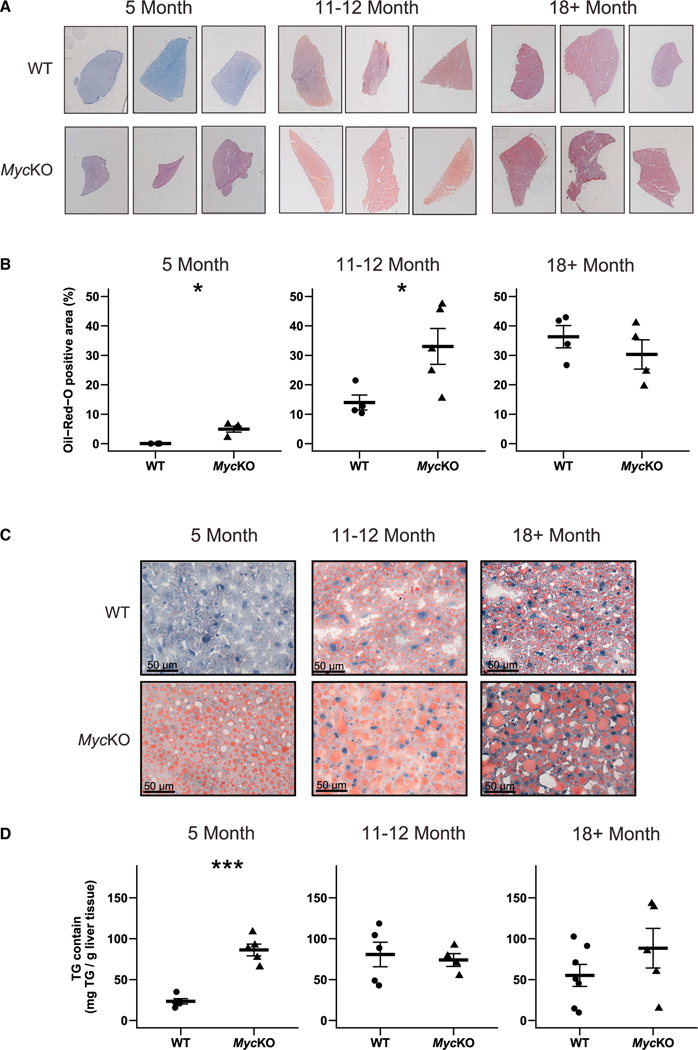
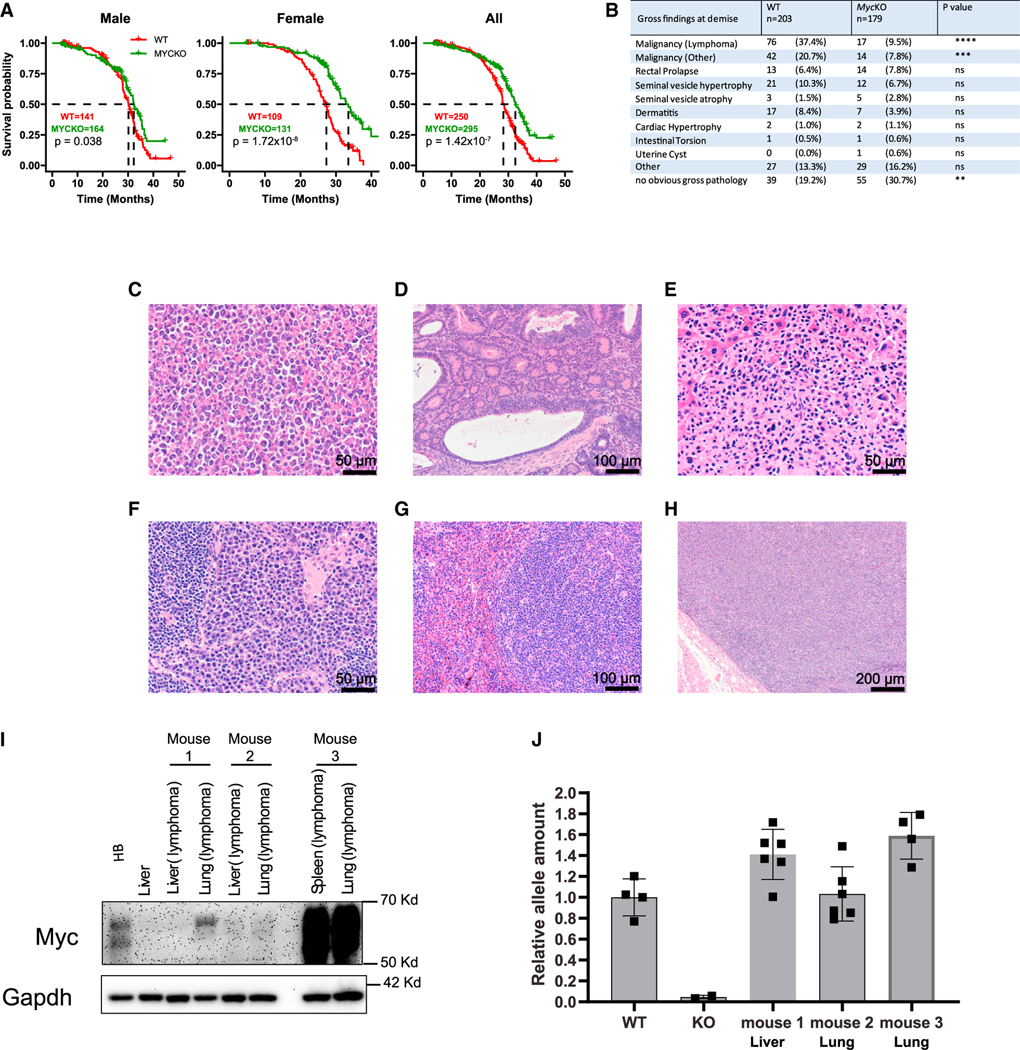
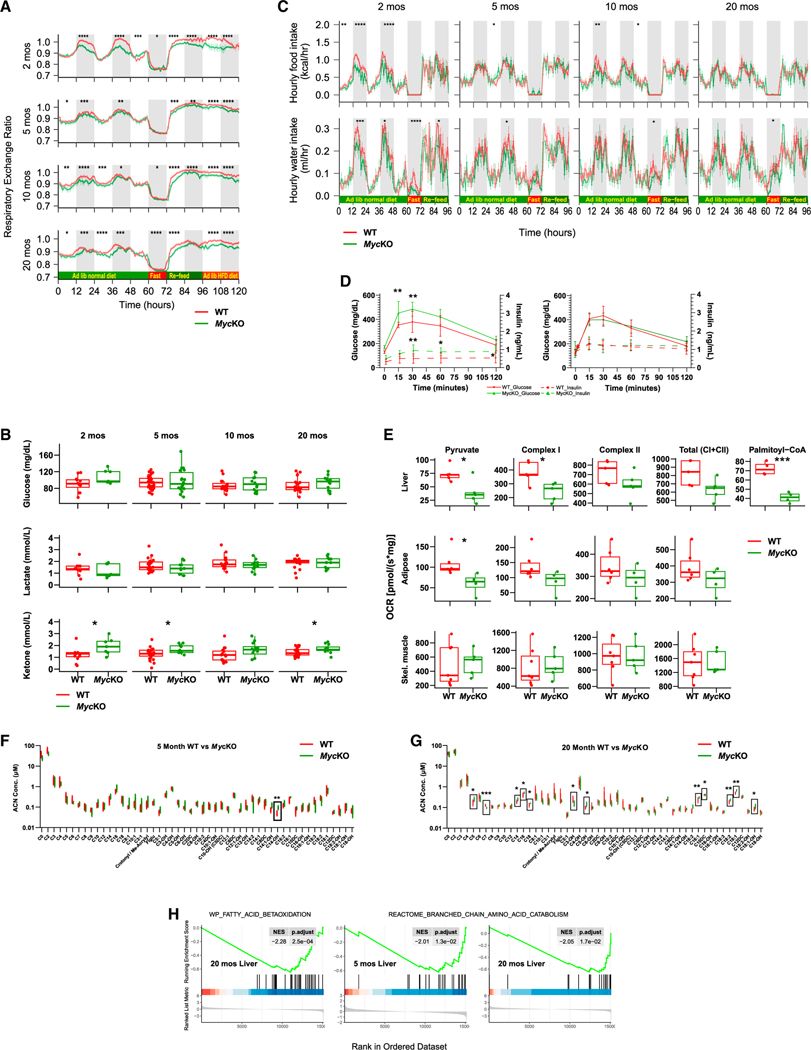
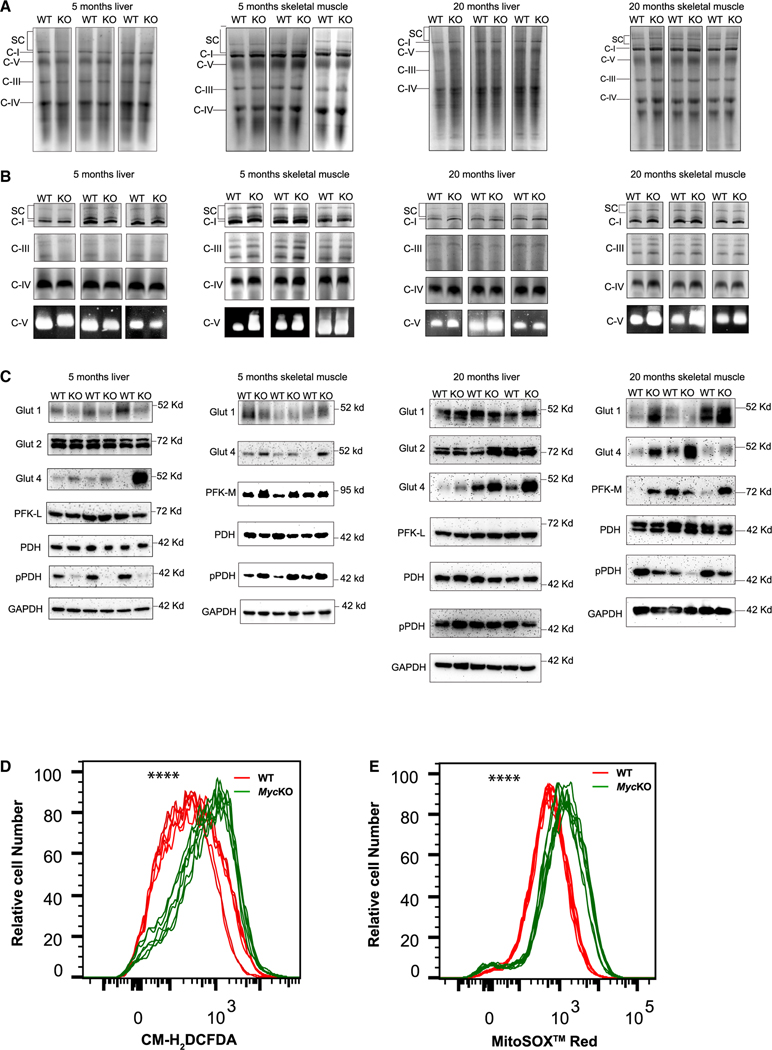
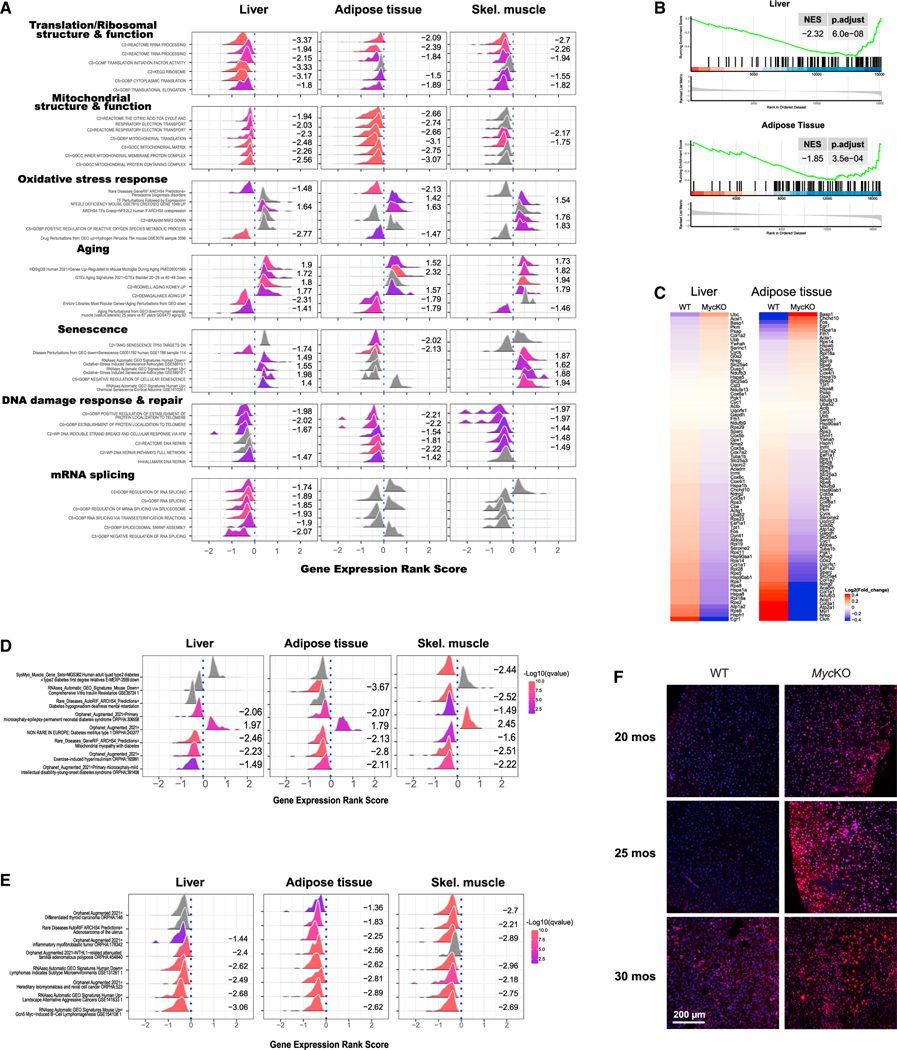
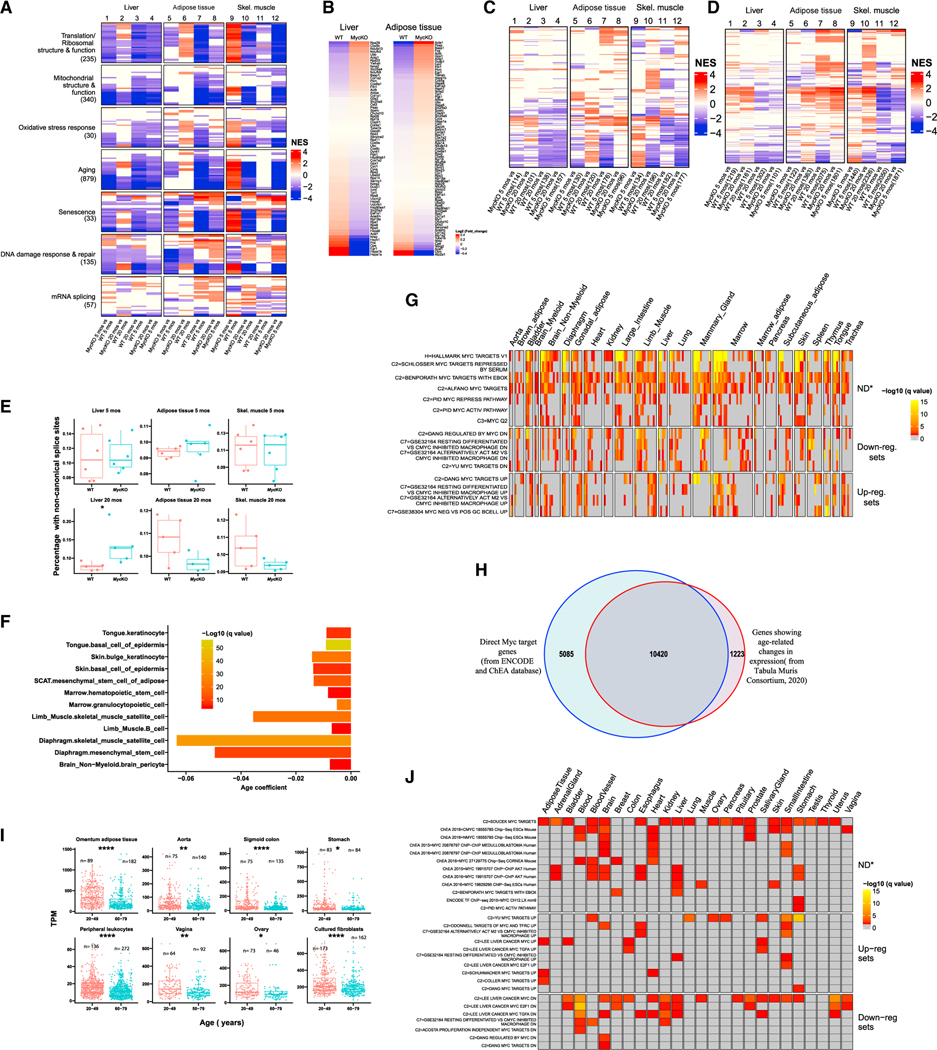
MYC proto-oncogene dysregulation alters metabolism, translation, and other functions in ways that support tumor induction and maintenance. Although Myc+/- mice are healthier and longer-lived than control mice, the long-term ramifications of more complete Myc loss remain unknown. We now describe the chronic consequences of body-wide Myc inactivation initiated postnatally. "MycKO" mice acquire numerous features of premature aging, including altered body composition and habitus, metabolic dysfunction, hepatic steatosis, and dysregulation of gene sets involved in functions that normally deteriorate with aging. Yet, MycKO mice have extended lifespans that correlate with a 3- to 4-fold lower lifetime cancer incidence. Aging tissues from normal mice and humans also downregulate Myc and gradually alter many of the same Myc target gene sets seen in MycKO mice. Normal aging and its associated cancer predisposition are thus highly linked via Myc.

Keywords: CP: Cancer; aging.


Conflict of interest statement

Declaration of interests The authors declare no competing interests.

Figures

Figure 1.
Figure 1.. Young MycKO mice display aging-related phenotypes
(A) Weight and body composition of male and female WT and MycKO mice. Each point represents the mean of measurements performed on 10–20 animals performed over 2–3 days. Times during which differences existed between the two groups are indicated by gray shading. (B) Premature alopecia in MycKO mice. (C) Premature achromotrichia in MycKO mice. (D) Appearance of representative WT and MycKO mice. See Video S1 for additional examples. (E) Close-up images of fur from 20-month-old WT and MycKO mice showing the interspersion of dark and gray strands in the former cohort versus the greater uniformity of gray color among individual strands in the latter. (F) Four-limb GripMeter testing performed on male and female animals. n = 9–13. (G) Rotarod testing of WT and MycKO mice. n = 5–14. (H) Treadmill running. Cohorts of WT and MycKO mice were allowed to maintain a continuous pace on an automated treadmill until becoming exhausted. n = 6–13. (I) Diurnal activity of WT and MycKO mice of the indicated ages as measured in metabolic cages. n = 5–10 males and 5–10 females at each age. White and gray-shaded regions of the plots denote day and night, respectively. (A, F, G, and H) Unpaired t test; (B and C) log rank test; (I) ANOVA; *p < 0.05, **p < 0.01, ***p < 0.001, ****p < 0.0001. Error bars: standard error of the mean (SEM).
Figure 2.
Figure 2.. MycKO mice prematurely develop NAFLD
(A) Representative oil red O (ORO)-stained liver sections of WT and MycKO mice. (B) Quantification of ORO-stained sections. At least 3 liver sections from 4 or 5 mice were scanned, quantified, and combined. (C) Higher-power magnification of the sections from (A) showing a greater prominence of large lipid droplets in MycKO livers. (D) Triglyceride content of WT and MycKO livers. (B and C) Unpaired t test, *p < 0.05, ***p < 0.001. Error bars: standard deviation (SD).
Figure 3.
Figure 3.. MycKO mice have extended lifespans and lower cancer incidence
(A) Natural lifespans of WT and MycKO male, female, and all mice. (B) Incidence of associated gross pathologies in WT and MycKO mice at the time of demise. (C) High-grade lymphoma from a MycKO mouse forming a nodular mass adjacent to a loop of bowel. (D) Well-differentiated MycKO colonic adenocarcinoma. (E) High-grade MycKO lymphoma replacing normal liver parenchyma. (F) Probable MycKO plasmacytoma. (G) Splenic MycKO lymphoma. (H) Lymphoma from the mouse in (G) effacing a lymph node adjacent to the pleural surface. (I) Myc protein expression. Control tissues included normal liver and a hepatoblastoma. Lymphomas from three MycKO mice (#1 to #3) were sampled from the two indicated sites. (J) Myc alleles in MycKO lymphomas (I). Myc copy number quantification was performed on several sections of each tumor (Figure S1). DNAs from WT and MycKO primary MEFs (n = 4 each) served as controls for two copies or zero copies, respectively, of an intact Myc allele. (A) Log rank test; (B) unpaired t test, **p < 0.01, ***p < 0.001, ****p < 0.0001; ns, not significant; (J) error bars: SD.
Figure 4.
Figure 4.. Metabolic defects in MycKO mice are consistent with premature aging
(A) Respiratory exchange ratios (RERs) calculated from the formula RER = VCO2/VO2. At 60 h, mice were fasted for 12 h and then provided with ad lib standard (re-feed) or high-fat diets (HFD) for consecutive 24 h periods. Each point is the mean of n = 11–13 mice/group ± 1 SE. (B) Fasting glucose, lactate, and ketone levels. (C) Hourly food and water intake (A). (D) Glucose tolerance tests (GTTs) and serum insulin levels. Mice were fasted for 5 h and then administered a single i.p. bolus of glucose. n = 5. (E) Oroboros respirometry results performed on mitochondria from the indicated WT and MycKO tissues. Pyruvate responses were determined following the addition of malate and ADP, whereas total complex I activity was determined following the subsequent addition to glutamate.,,. (F) Fifty-one serum acyl carnitine levels in 5 month-old WT and KO mice obtained after overnight fasting. n = 5 mice/group. Also see Figures S4 and S5. (G) The same serum acyl carnitines were assessed in ~20-month-old WT and KO mice as described in (F). n = 5 mice/group. Boxes indicate significant intergroup differences. Also see Figures S4 and S5. (H) Gene set enrichment analysis (GSEA) for liver transcripts involved in FAO from 20-month-old MycKO mice and additional negative enrichment in 5- and 20-month-old MycKO mice for genes comprising the BCAA catabolic pathway. Results were generated from RNA-seq data obtained from liver, adipose tissue, and skeletal muscle of each of the indicated cohorts, but were significant only in the liver as shown. (A and C) ANOVA, (B, D, E, F, and G) unpaired t test, *p < 0.05, **p < 0.01, ***p < 0.001, ****p < 0.0001. Error bars: SD.
Figure 5.
Figure 5.. ETC structure and function and glucose handling differ between WT and MycKO livers and skeletal muscle
(A) BNGE profiles of liver and skeletal muscle ETC complexes I–IV, complex V, and supercomplexes (SCs) from mitochondria of 5- and 20-month-old mice. SCs comprise higher-order assemblies of complexes I, III, and IV. (B) In situ enzymatic activity of complexes I, III, IV, and V from (A). (C) Immunoblot analyses of proteins involved in glucose and pyruvate transport and metabolism from the tissues shown in (A) and (B). (D) ROS production by WT and MycKO MEFs measured by the oxidation of CM-H2DCFDA. n = 6. (E) Mitochondrial-specific ROS production measured by the superoxide-mediated oxidation of MitoSOX red. n = 6. Unpaired t test, ****p < 0.0001.
Figure 6.
Figure 6.. Tissues from 5-month-old MycKO mice are enriched for aging- and senescence-associated transcripts
(A) GSEA from tissues of 5-month-old WT and MycKO mice. clusterProfiler displays representative examples of the most recurrent and prominent of the gene sets within each category., Numbers to the right of each profile indicate its normalized enrichment score. Curves shown in gray and lacking enrichment scores indicate gene sets that were not significantly enriched. Values >0 along the abscissas indicate gene sets that were upregulated in MycKO tissues, whereas values <0 indicate gene sets that were downregulated. See Figure S7 for standard GSEA plots of these. (B and C) GSEA and heatmap for transcripts that correlate with aging in most tissues and across species in livers and adipose tissue of 5-month-old WT and MycKO mice. (D) Gene sets associated with types 1 and 2 diabetes selectively enriched in the indicated tissues of 5-month-old MycKO mice. (E) Gene sets associated with cancer selectively enriched in the indicated tissues of 5-month-old MycKO mice. (F) Examples of immunostaining for γ-H2AX in the indicated mice depicting double-stranded DNA breaks. Shown are merged micrographs: γ-H2AX immunostaining (red) and DAPI staining (blue).
Figure 7.
Figure 7.. Gene expression differences in young and old mouse tissues reflect declines in Myc and Myc target genes
(A) Age- and Myc-dependent gene set enrichment differences among 5- and 20-month-old WT and MycKO tissues. n = 5. The total number of gene sets for which significant enrichment was observed is indicated beneath each category. Colored lines within each category represent a single gene set, the top 30 of which are shown for each category. Data S1 lists all relevant gene sets and others depicted here. (B) Heatmap for the 79 transcripts shown in Figures 6B and 6C that correlate with aging in most tissues examined and across species. (C) Heatmap of individual gene sets related to types 1 and 2 diabetes, including those depicted in Figure 6D from 5- and 20-month-old WT and MycKO mice. (D) Heatmap for the expression of individual gene sets related to cancer, including those depicted in Figure 6E from 5- and 20-month-old WT and MycKO mice. (E) Transcriptome-wide quantification of non-canonically spliced transcripts. Unpaired t test, *p < 0.05. (F) Significant declines in Myc transcript levels in 12 of 90 single-cell populations derived from 23 individual young (1–3 months) and old (18–30 months) mousetissues. Results are expressed as q values based upon correlation coefficients that compared transcript levels across aging populations. (G) Overrepresentation analysis of 58 Myc target gene sets analyzed using the above-cited single-cell RNA-seq data from young versus old mice.103 Gene sets for which significant dysregulation was observed in at least 40 of the 90 single-cell populations are shown, although 74 of the cell populations (82.2%) showed enriched representation of at least one gene set (Data S1). Down-reg. sets, downregulated in response to Myc overexpression; Up-reg. sets, upregulated in response to Myc overexpression; ND, sets comprising both positive and negative targets whose overall direction of response could not be determined. (H) Overlap between direct Myc target genes and those that undergo significant age-related changes in expression (q < 0.05)., Gene expression differences were compared from 76 single-cell populations derived from 23 tissues from 1- to 3- and 18- to 30-month-old mice. (I) Myc transcript differences in young and old human tissues. Results are from the Broad Institute’s GTEx database. (J) Enrichment of Myc target gene sets (see Figures S6A–S6C) in aging and senescent human tissues and cell lines. (E and I) Unpaired t test, *p < 0.05, **p < 0.01, ****p < 0.0001.

References

    1. Kalkat M, De Melo J, Hickman KA, Lourenco C, Redel C, Resetca D, Tamachi A, Tu WB, and Penn LZ (2017). MYC deregulation in primary human cancers. Genes 8, 151. 10.3390/genes8060151. - DOI - PMC - PubMed
    1. Nesbit CE, Tersak JM, and Prochownik EV (1999). MYC oncogenes and human neoplastic disease. Oncogene 18, 3004–3016. 10.1038/sj.onc.1202746. - DOI - PubMed
    1. Ge Z, Leighton JS, Wang Y, Peng X, Chen Z, Chen H, Sun Y, Yao F, Li J, Zhang H, et al. (2018). Integrated genomic analysis of the ubiquitin pathway across cancer types. Cell Rep. 23, 213–226.e3. 10.1016/j.celrep.2018.03.047. - DOI - PMC - PubMed
    1. Dang CV, O’Donnell KA, Zeller KI, Nguyen T, Osthus RC, and Li F. (2006). The c-Myc target gene network. Semin. Cancer Biol 16, 253–264. 10.1016/j.semcancer.2006.07.014. - DOI - PubMed
    1. Kalkat M, Resetca D, Lourenco C, Chan PK, Wei Y, Shiah YJ,Vitkin N, Tong Y, Sunnerhagen M, Done SJ, et al. (2018). MYC protein interactome profiling reveals functionally distinct regions that cooperate to drive tumorigenesis. Mol. Cell 72, 836–848.e7. 10.1016/j.molcel.2018.09.031. - DOI - PubMed

Publication types

Substances