. 2023 Oct:301:122246.
doi: 10.1016/j.biomaterials.2023.122246. Epub 2023 Jul 12.

Hydrogel-encapsulation to enhance bacterial diagnosis of colon inflammation

Affiliations

Hydrogel-encapsulation to enhance bacterial diagnosis of colon inflammation

Samira Aghlara-Fotovat et al. Biomaterials. 2023 Oct.

Abstract

Bacteria can be genetically programmed to sense and report the presence of disease biomarkers in the gastrointestinal (GI) tract. However, diagnostic bacteria are typically delivered via oral administration of liquid cultures, resulting in poor survival and high dispersal in vivo. These limitations confound recovery and analysis of engineered bacteria from GI or stool samples. Here, we demonstrate that encapsulating bacteria inside of alginate core-shell particles enables robust survival, containment, and diagnostic function in vivo. We demonstrate these benefits by encapsulating a strain engineered to report the presence of the biomarker thiosulfate via fluorescent protein expression in order to diagnose dextran sodium sulfate-induced colitis in rats. Hydrogel-encapsulated bacteria engineered to sense and respond to physiological stimuli should enable minimally invasive monitoring of a wide range of diseases and have applications as next-generation smart therapeutics.

Keywords: Colitis; Diagnostic bacteria; Hydrogel encapsulation; Synthetic biology.


Conflict of interest statement

Declaration of competing interest The authors declare the following financial interests/personal relationships which may be considered as potential competing interests: Omid Veiseh and Jeffrey Tabor reports a relationship with Pana Bio that includes: board membership and equity or stocks. Samira Aghlara-Fotovat, Elena Musteata, Michael D. Doerfert, Moshe Baruch, Jeffrey J. Tabor, Omid Veiseh has patent pending to Pana Bio. Moshe Baruch is current employee of Pana Bio.

Figures

Figure 1.
Figure 1.. Delivery of alginate-encapsulated diagnostic bacteria to the gut.
Engineered bacteria are encapsulated and administered orally. Small molecule biomarkers diffuse through the capsules, activating the expression of a bacterial reporter gene. The capsules are recovered from stool or GI tissue sites for downstream analysis.
Figure 2.
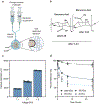
Figure 2.. Fabrication and characterization of alginate capsules.
a) Schematic illustration of capsule synthesis. b) Chemical structure of alginic acid depicting associated pKa of each monomers’ carboxylic acid. c) Capsule diameter as a factor of electrospray voltage. Each data point represents the diameter of one capsule. The blue columns and error bars represent the mean and SD, respectively, of 10 technical replicates collected on the same day. d) Capsule permeability to different molecular weight dextran over 24 hours. Each data point represents the dextran diffusion from one capsule. The blue columns and error bars represent the mean and SD, respectively, of 5 technical replicates collected over the span of one day.
Figure 3.
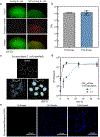
Figure 3.. Encapsulation preserves bacterial viability.
a) Bacterial viability is preserved within capsules. Living bacteria accept only SYTO-9 stain while non-living bacteria accept both SYTO-9 and propidium iodide. Capsule microscopy images are representative of n = 3 biological replicates containing 5 capsules each. b) Bacterial viability (CFU) prior to and following encapsulation was not significantly different (p = 0.715***). Each data point represents the CFU retrieved from one capsule or one capsule core volume of free bacteria. Columns and error bars represent the mean and SD, respectively, of 3 biological replicates collected on the same day. Average bacterial load per capsule is 7.47×10⁴ ± 3.74×10⁴ CFU. c) Dark-field images of hydrogel capsules with and without encapsulated E. coli at varying cell densities. Images are representative of ≥ 60 capsules. Images were processed in photoshop for background removal. d) Bacteria encapsulated at OD600 0.1 can grow inside capsules and reach an average carrying capacity of 2.38×10⁷ ± 1.19×10⁷ CFU/capsule. A similar carrying capacity is reached for bacteria encapsulated at OD600 1. Data points and error bars represent the mean and SD, respectively, of 3 biological replicates collected over the course of 48 hours. e) Bacteria encapsulated at OD600 0.1 were retrieved at 3 timepoints during growth, fixed in 4% PFA, and stained with DAPI for visualization. Each blue cluster represents the stained bacteria inside one capsule.
Figure 4.
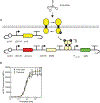
Figure 4.. Engineered E. coli report extracellular thiosulfate levels in capsules
a) Diagram of the engineered strain used for thiosulfate sensing in vivo. ThsS and ThsR encode the sensor histidine kinase and response regulator comprising the thiosulfate-responsive ThsSR two-component system, respectively. P15A and ColE1 are origins of replication of two separate plasmids used to encode the system. J23104, J23100, and J23105 are constitutive promoters used to express the system genes. PphsA342 is the ThsR-activated promoter used to drive sfGFP expression. The constitutive mCherry fluorescent protein is included to enable rapid identification from native stool microbiota. b) Thiosulfate dose-response is preserved following encapsulation of ThsSR sensor bacteria. Data points and error bars represent the mean and SD, respectively, of 3 biological replicates collected on the same day. Fit lines are Hill functions as described in Methods 2.14, and fit parameters are given in Table S1. Dynamic range, K1/2, and hill coefficient are similar prior to and following encapsulation.
Figure 5.
Figure 5.. Encapsulation preserves bacterial viability in the rat GI tract.
a) Encapsulated bacteria survive in acidic conditions. Each data point represents the CFU retrieved from one capsule or one capsule core volume of free bacteria. Columns and error bars represent the mean and SD, respectively, of 3 biological replicates collected on the same day. b) Schematic illustration of capsule delivery, retrieval, and post-collection processing. c) Bacterial viability (CFU) within capsules prior to oral administration (n=3, mean ± SEM) and following retrieval from stool samples (n=10, mean ± SEM) d) Representative darkfield images of encapsulated bacteria prior to gavage and following retrieval from stool samples. Images are representative of all capsules retrieved (between 1–2 mL capsule volume).
Figure 6.
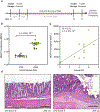
Figure 6.. Encapsulated bacteria diagnose colitis in a rat DSS model.
a) Timeline of disease development, capsule dosing, and sample processing. b) sfGFP expression of encapsulated ThsSR sensor bacteria retrieved from fecal samples prior to and after treatment with DSS. Each data point represents the mean fluorescence of 3 technical replicates collected from each rat. Each technical replicate represents the geometric mean fluorescence of cells collected from 5 capsules (mean ± SEM). c) sfGFP expression of encapsulated ThsSR sensor bacteria correlates positively with animal DAI. Each data point represents the mean fluorescence of 3 technical replicates collected from each rat. d) Representative histological sections from rats with varying degrees of inflammation and different DAI. 5 images were acquired per rat. Rats were sacrificed at day 11 and colon sections were processed. At this point, rats had reached different final DAI states.

References

    1. Sender R, Fuchs S & Milo R Are We Really Vastly Outnumbered? Revisiting the Ratio of Bacterial to Host Cells in Humans. Cell 164, 337–340 (2016). - PubMed
    1. Ley RE, Peterson DA & Gordon JI Ecological and evolutionary forces shaping microbial diversity in the human intestine. Cell 124, 837–848 (2006). - PubMed
    1. Dabke K, Hendrick G & Devkota S The gut microbiome and metabolic syndrome. J. Clin. Invest 129, 4050–4057 (2019). - PMC - PubMed
    1. Hwang J-S, Im C-R & Im S-H Immune Disorders and Its Correlation with Gut Microbiome. Immune Netw. 12, 129–138 (2012). - PMC - PubMed
    1. Cryan JF, O’Riordan KJ, Sandhu K, Peterson V & Dinan TG The gut microbiome in neurological disorders. Lancet Neurol. 19, 179–194 (2020). - PubMed

Publication types

LinkOut - more resources