

Advancing the Economic and Environmental Sustainability of the NEWgenerator Nonsewered Sanitation System
- PMID: 37483306
- PMCID: PMC10360206
- DOI: 10.1021/acsenvironau.3c00001
Advancing the Economic and Environmental Sustainability of the NEWgenerator Nonsewered Sanitation System
Abstract
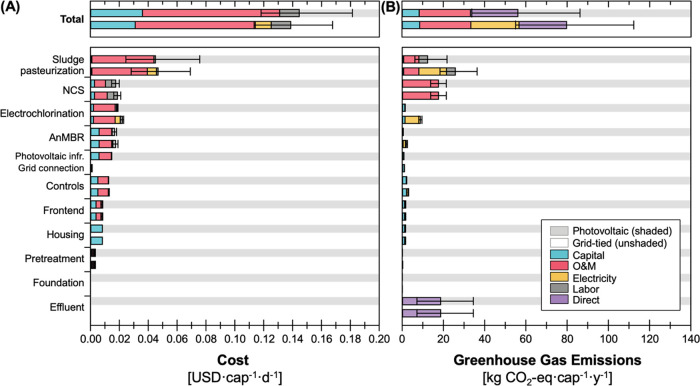
Achieving safely managed sanitation and resource recovery in areas that are rural, geographically challenged, or experiencing rapidly increasing population density may not be feasible with centralized facilities due to space requirements, site-specific concerns, and high costs of sewer installation. Nonsewered sanitation (NSS) systems have the potential to provide safely managed sanitation and achieve strict wastewater treatment standards. One such NSS treatment technology is the NEWgenerator, which includes an anaerobic membrane bioreactor (AnMBR), nutrient recovery via ion exchange, and electrochlorination. The system has been shown to achieve robust treatment of real waste for over 100 users, but the technology's relative life cycle sustainability remains unclear. This study characterizes the financial viability and life cycle environmental impacts of the NEWgenerator and prioritizes opportunities to advance system sustainability through targeted improvements and deployment. The costs and greenhouse gas (GHG) emissions of the NEWgenerator (general case) leveraging grid electricity were 0.139 [0.113-0.168] USD cap-1 day-1 and 79.7 [55.0-112.3] kg CO2-equiv cap-1 year-1, respectively. A transition to photovoltaic-generated electricity would increase costs to 0.145 [0.118-0.181] USD cap-1 day-1 but decrease GHG emissions to 56.1 [33.8-86.2] kg CO2-equiv cap-1 year-1. The deployment location analysis demonstrated reduced median costs for deployment in China (-38%), India (-53%), Senegal (-31%), South Africa (-31%), and Uganda (-35%), but at comparable or increased GHG emissions (-2 to +16%). Targeted improvements revealed the relative change in median cost and GHG emissions to be -21 and -3% if loading is doubled (i.e., doubled users per unit), -30 and -12% with additional sludge drying, and +9 and -25% with the addition of a membrane contactor, respectively, with limited benefits (0-5% reductions) from an alternative photovoltaic battery, low-cost housing, or improved frontend operation. This research demonstrates that the NEWgenerator is a low-cost, low-emission NSS treatment technology with the potential for resource recovery to increase access to safe sanitation.
© 2023 The Authors. Published by American Chemical Society.
Conflict of interest statement
The authors declare the following competing financial interest(s): D.H.Y. and R.A.B. are inventors on patents related to the NEWgenerator and are co-founders of BioReNEW, Inc.
Figures


Similar articles
-
Financial Viability and Environmental Sustainability of Fecal Sludge Treatment with Pyrolysis Omni Processors.ACS Environ Au. 2022 Sep 21;2(5):455-466. doi: 10.1021/acsenvironau.2c00022. Epub 2022 Jul 29. ACS Environ Au. 2022. PMID: 36164351 Free PMC article.
-
Mitigation of global greenhouse gas emissions from waste: conclusions and strategies from the Intergovernmental Panel on Climate Change (IPCC) Fourth Assessment Report. Working Group III (Mitigation).Waste Manag Res. 2008 Feb;26(1):11-32. doi: 10.1177/0734242X07088433. Waste Manag Res. 2008. PMID: 18338699 Review.
-
The NEWgeneratorTM non-sewered sanitation system: Long-term field testing at an informal settlement community in eThekwini municipality, South Africa.J Environ Manage. 2021 Oct 15;296:112921. doi: 10.1016/j.jenvman.2021.112921. Epub 2021 Jul 21. J Environ Manage. 2021. PMID: 34303262 Free PMC article.
-
Understanding the greenhouse gas emissions from China's wastewater treatment plants: Based on life cycle assessment coupled with statistical data.Ecotoxicol Environ Saf. 2023 Jul 1;259:115007. doi: 10.1016/j.ecoenv.2023.115007. Epub 2023 May 18. Ecotoxicol Environ Saf. 2023. PMID: 37209571
-
Upflow anaerobic sludge blanket reactor--a review.Indian J Environ Health. 2001 Apr;43(2):1-82. Indian J Environ Health. 2001. PMID: 12397675 Review.
Cited by
-
Defining Economic and Environmental Typologies across 77 Countries to Prioritize Opportunities for Nonsewered Sanitation.Environ Sci Technol. 2025 Jul 29;59(29):15101-15114. doi: 10.1021/acs.est.5c02064. Epub 2025 Jul 13. Environ Sci Technol. 2025. PMID: 40653643 Free PMC article.
-
Anaerobic Digestion as a Core Technology in Addressing the Global Sanitation Crisis: Challenges and Opportunities.Environ Sci Technol. 2023 Dec 5;57(48):19078-19087. doi: 10.1021/acs.est.3c05291. Epub 2023 Nov 13. Environ Sci Technol. 2023. PMID: 37956995 Free PMC article. Review.
References
-
- United Nations . Resolution 64/292: The Human Right to Water and Sanitation, 2010. https://documents.un.org/prod/ods.nsf/home.xsp (accessed 2023-04-14).
-
- United Nations . Resolution 70/169: The Human Rights to Safe Drinking Water and Sanitation, 2015. https://documents.un.org/prod/ods.nsf/home.xsp (accessed 2023-04-14).
-
- United Nations . Resolution 70/1. Transforming Our World: The 2030 Agenda for Sustainable Development, 2015. https://documents.un.org/prod/ods.nsf/home.xsp (accessed 2023-04-14)
-
- World Health Organization and United Nations Children’s Fund . Progress on Household Drinking Water, Sanitation and Hygiene 2000–2020: Five Years into the SDGs; 2021. https://www.who.int/publications/i/item/9789240030848 (accessed 2023-04-14).
-
- United Nations Department of Economic and Social Affairs . The Sustainable Development Goals Report 2021; United Nations, 2021.
LinkOut - more resources
Full Text Sources
Research Materials
Miscellaneous
