. 2023 Jul 6:14:1151311.
doi: 10.3389/fimmu.2023.1151311. eCollection 2023.

Comparison of vaccination and booster rates and their impact on excess mortality during the COVID-19 pandemic in European countries

Affiliations

Comparison of vaccination and booster rates and their impact on excess mortality during the COVID-19 pandemic in European countries

Olga Matveeva et al. Front Immunol. .

Abstract

Aim: To evaluate the effect of vaccination/booster administration dynamics on the reduction of excess mortality during COVID-19 infection waves in European countries.

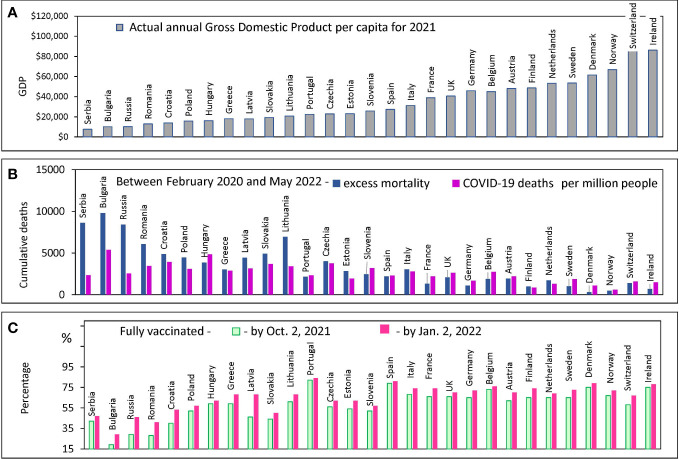
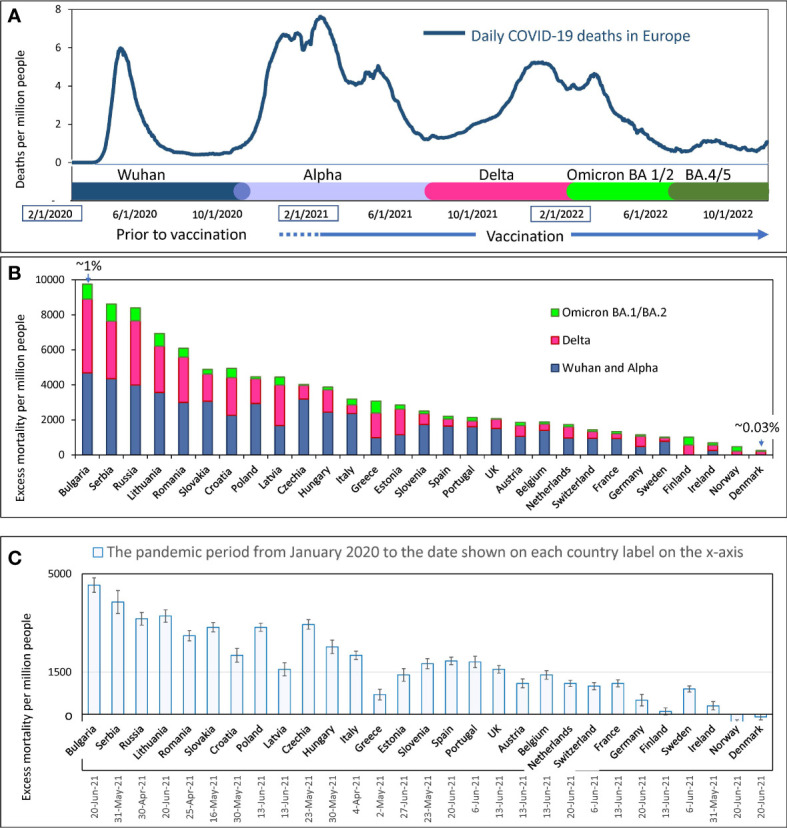
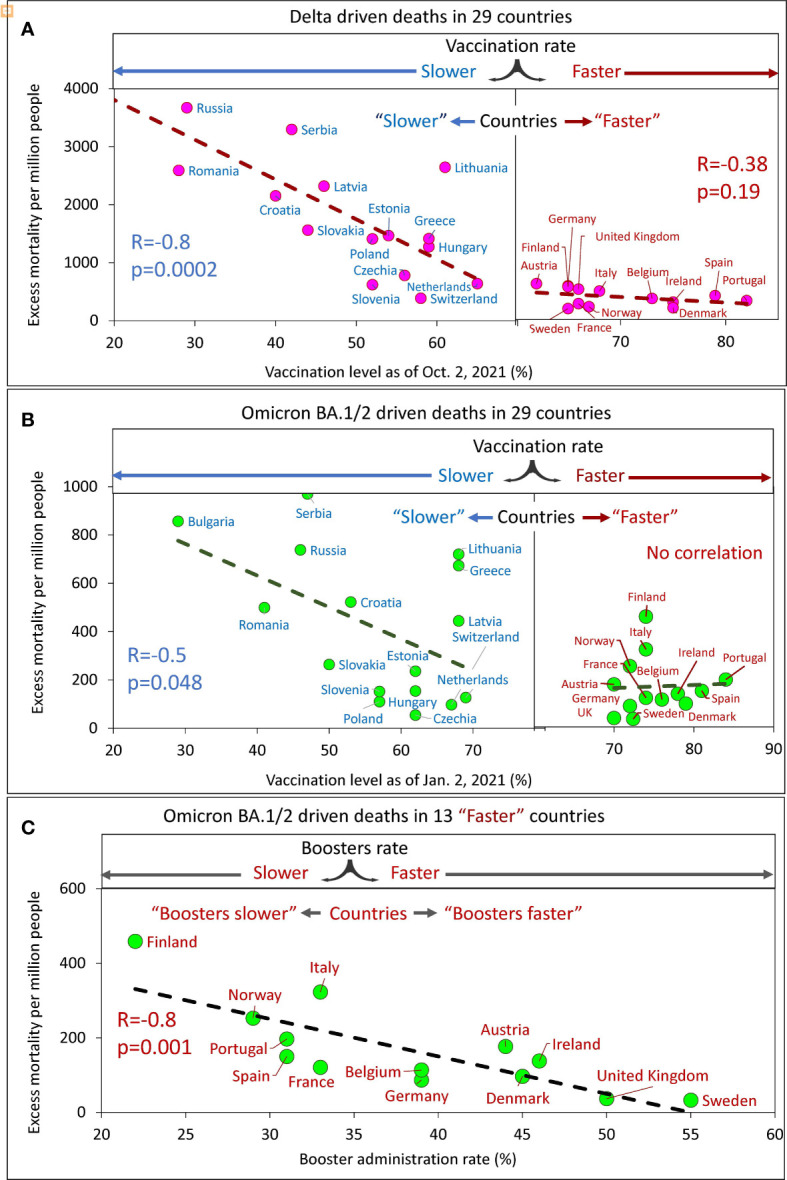
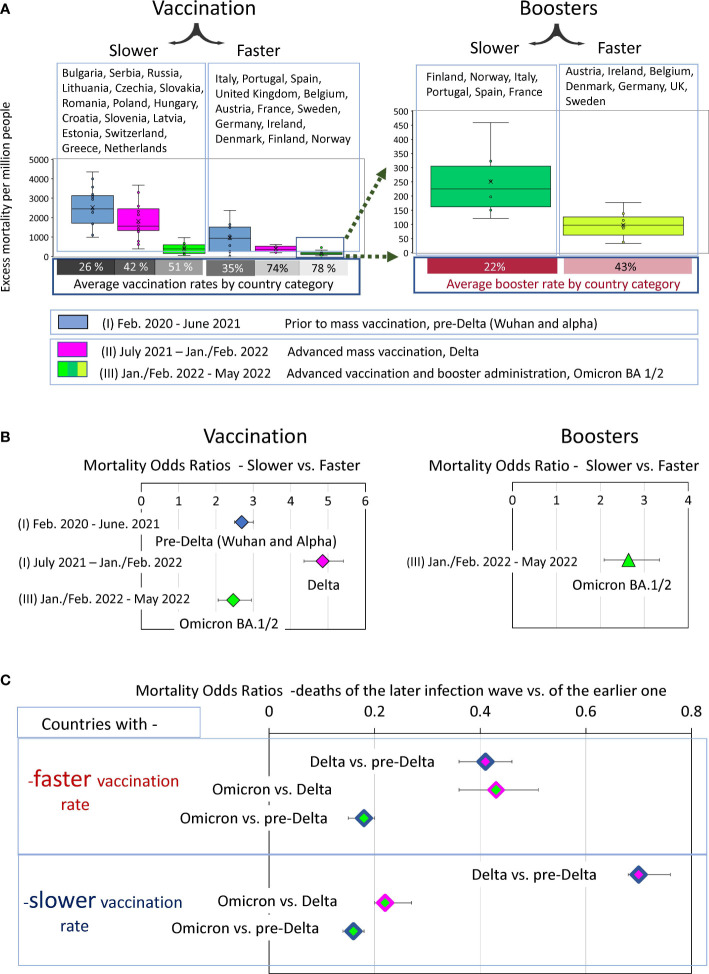
Methods: We selected twenty-nine countries from the OurWorldInData project database according to their population size of more than one million and the availability of information on dominant SARS-CoV-2 variants during COVID-19 infection waves. After selection, we categorized countries according to their "faster" or "slower" vaccination rates. The first category included countries that reached 60% of vaccinated residents by October 2021 and 70% by January 2022. The second or "slower" category included all other countries. In the first or "faster" category, two groups, "boosters faster'' and "boosters slower" were created. Pearson correlation analysis, linear regression, and chi-square test for categorical data were used to identify the association between vaccination rate and excess mortality. We chose time intervals corresponding to the dominance of viral variants: Wuhan, Alpha, Delta, and Omicron BA.1/2.

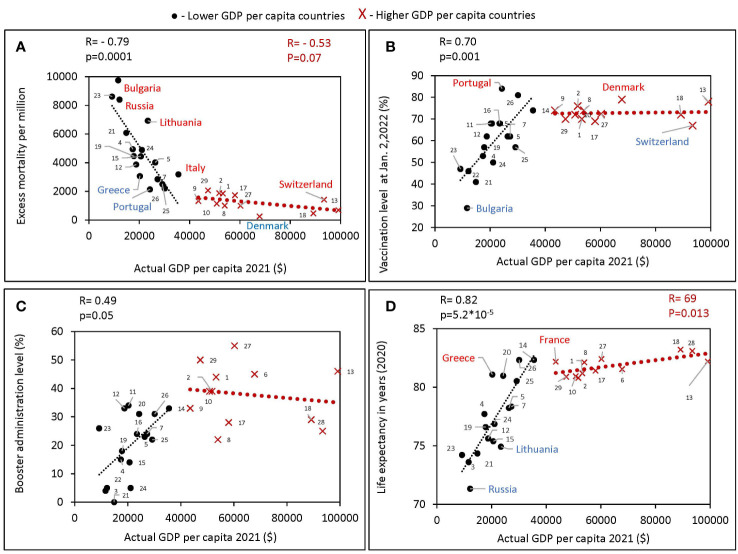
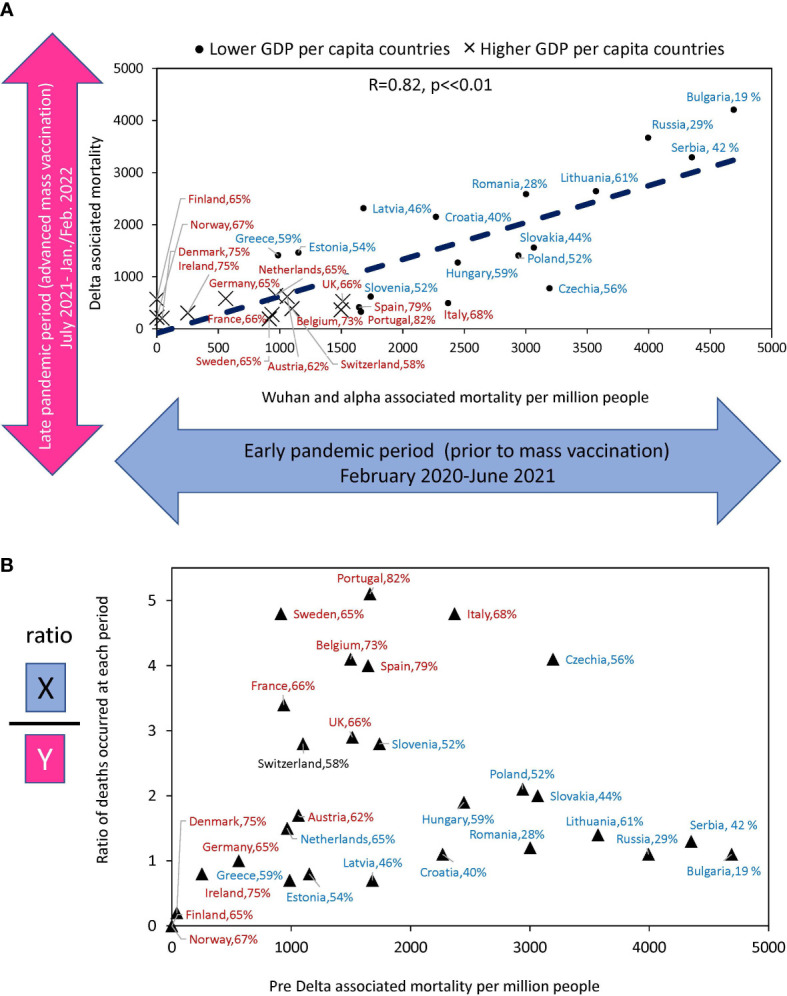
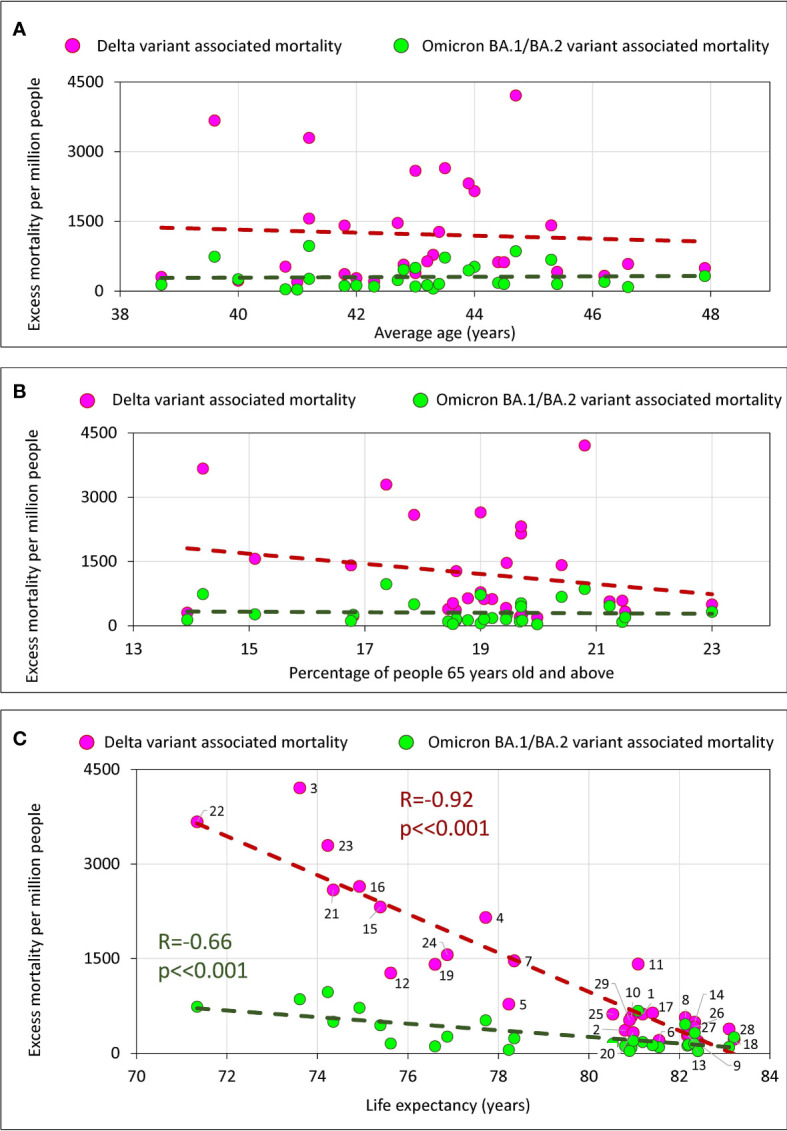
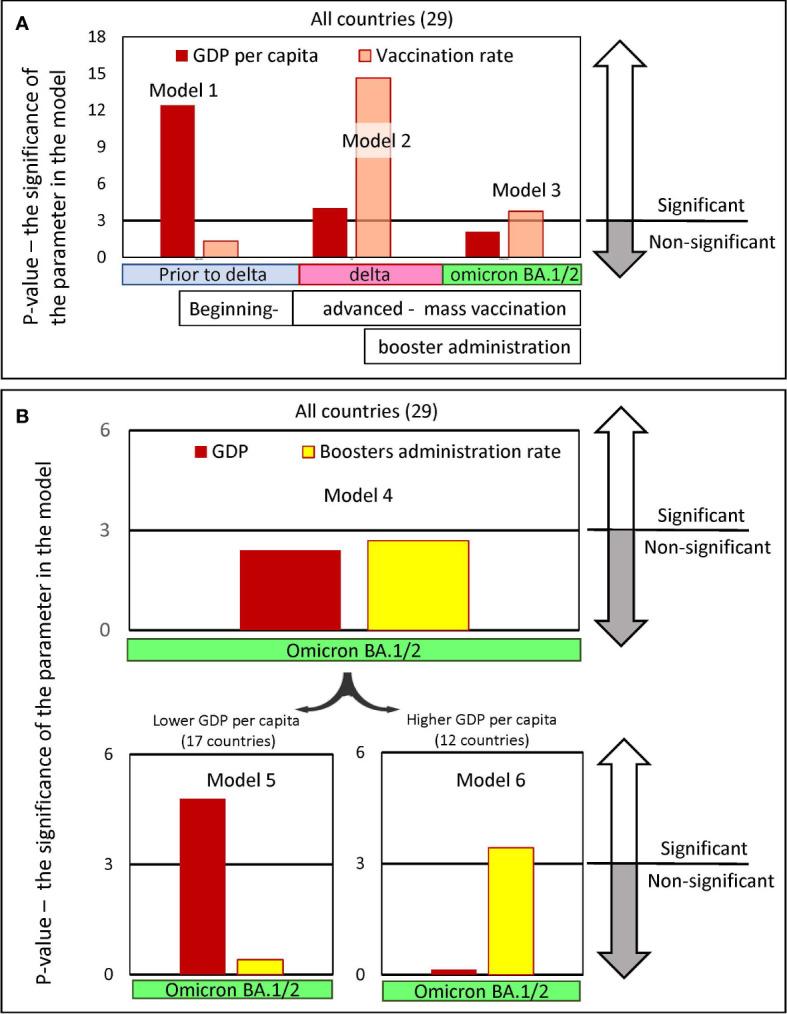
Results and discussion: The "faster" countries, as opposed to the "slower" ones, did better in protecting their residents from mortality during all periods of the SARS-CoV-2 pandemic and even before vaccination. Perhaps higher GDP per capita contributed to their better performance throughout the pandemic. During mass vaccination, when the Delta variant prevailed, the contrast in mortality rates between the "faster" and "slower" categories was strongest. The average excess mortality in the "slower" countries was nearly 5 times higher than in the "faster" countries, and the odds ratio (OR) was 4.9 (95% CI 4.4 to 5.4). Slower booster rates were associated with significantly higher mortality during periods dominated by Omicron BA.1 and BA.2, with an OR of 2.6 (CI 95%. 2.1 to 3.3). Among the European countries we analyzed, Denmark, Norway, and Ireland did best, with a pandemic mortality rate of 0.1% of the population or less. By comparison, Bulgaria, Serbia, and Russia had a much higher mortality rate of up to 1% of the population.

Conclusion: Thus, slow vaccination and booster administration was a major factor contributing to an order of magnitude higher excess mortality in "slower" European countries compared to more rapidly immunized countries.

Keywords: COVID-19; European countries; GDP; SARS-CoV-2; booster administration; excess mortality; vaccination rate.


Conflict of interest statement

OM was employed by the company Sendai Viralytics. The remaining author declare that the research was conducted in the absence of any commercial or financial relationships that could be construed as a potential conflict of interest.

Figures

Figure 1
Figure 1
Country characteristics: GDP, Mortality and Vaccination Rates. Countries are ranked in order of increasing GDP per capita in 2021 in all panels. Standard deviations and error bars are not shown. (A) Actual annual GDP values from the World bank database for 29 European countries. (B) Excess mortality estimates, and COVID-19 confirmed deaths from the OWID database (C) The percentage of people who received two doses of vaccine (primary series) at certain dates.
Figure 2
Figure 2
Relationship between GDPs per capita and various characteristics of European countries obtained during different periods of the pandemic. All estimates of excess mortality in the scatter plots are per million population. Higher GDP per capita countries were defined in this study as those with a GDPs equal to or greater than the threshold of $40,000, lower GDPs per capita countries defined as those with a GDPs per capita below the threshold. Countries were numbered according to the alphabetical order of their names as follows: Austria 1, Belgium 2, Bulgaria 3, Croatia 4, Czechia 5, Denmark 6, Estonia 7, Finland 8, France 9, Germany 10, Greece 11, Hungary 12, Ireland 13, Italy 14, Latvia 15, Lithuania 16, Netherlands 17, Norway 18, Poland 19, Portugal 20, Romania 21, Russia 22, Serbia 23, Slovakia 24, Slovenia 25, Spain 26, Sweden 27, Switzerland 28, United Kingdom 29. (A) Excess mortality during the COVID-19 pandemic from February 1, 2020, to May 30, 2022, in relation to actual GDP per capita as of 2021. (B) Vaccination rates, as of October 2, versus actual GDP per capita. (C) Boosters administration rates, as of January 2, versus actual GDP per capita. (D) Life expectancy versus actual GDP per capita.
Figure 3
Figure 3
Mortality during COVID-19 pandemics in Europe (A) Visualization of infection waves as weekly averaged confirmed COVID-19 deaths in Europe during the pandemic through October 15, 2022. Different time intervals are highlighted in distinct colors. Information on excess mortality and dominant virus variants in each time interval was taken from the OWID database. The information is shown in more detail in the Supplementary Figure 1 . (B) Excess mortality estimates for each European country for the COVID-19 pandemic period from February 2020 to May 2022. Estimates are from the OWID database and are derived from the Karlinsky-Kobak model. Each column represents three different time intervals, which are highlighted with the same colors as in “A”. (C) Karlinsky - Kobak model estimates of excess mortality values over the time from the beginning of the pandemic up to the summer of 2021 with the standard deviation intervals.
Figure 4
Figure 4
Relationship between estimates of excess deaths occurring earlier and later during the COVID-10 pandemic. (A) The relationship between deaths that occurred in the country during Delta domination relative to deaths whose culprits were pre-Delta virus variants (Alpha and Wuhan). (B) The ratio of excess death numbers that occurred in the two periods for the same countries versus to excess death numbers in the first period. The names of countries that fall into the “faster” vaccination category are shown in brown font. The names of countries tht fall into “slower” vaccination category are in blue. The percentage of the country population that got primary vaccines series by the time Delta variant arrived is shown after the name of the country.
Figure 5
Figure 5
Excess mortality and vaccination rates in European countries estimated for different time intervals. (A) Delta associated excess mortality by country vs. vaccination rates. (B) Omicron BA.1/2 associated excess mortality by country vs. vaccination rates. (C) Omicron BA.1/2 associated excess mortality by country vs. boosters’ administration rate in the “faster” vaccination rate country category.
Figure 6
Figure 6
Excess mortality and the average age of the population in the country, the percentage of the elderly, and life expectancy in the country. (A) Excess mortality and the average age of the population in the country. (B) Excess mortality and the percentage of the elderly population (65+) in the country. (C) Relationship between excess mortality and life expectancy.
Figure 7
Figure 7
Significance levels of input parameters in linear regression models predicting pandemic excess mortality. The regression models were created to predict excess mortality. Mortality was chosen as the dependent variable, while GDP per capita and the vaccine immunization rate of the country’s population were chosen as the independent variables. The models’ outputs are presented in Table 2 in Supplementary Material . Each figure column represents a negative natural logarithmic value of the significance level of the corresponding model input parameter. The pandemic periods, for which we built models, differed in the dominance of the viral variant. Wuhan and Alpha variants dominated Europe, before July 2021, afterwards the Delta variant dominated until January/February 2022 and later until May 2022 Omicron BA.½. (A) Input parameters are GDP and vaccination rates in the country, achieved in the respective time periods. Models 1-3 were created for the set of all 29 countries. (B) Input parameters are GDP and the level of boosters in the country reached by a certain time. Model 4 was created for the set of all 29 countries, and models 5 and 6 were created only for countries subsets with GDP per capita below or above 40K, respectively. There are 17 countries in the first subset and 12 in the second.
Figure 8
Figure 8
Analysis of COVID-19 associated excess deaths averaged for country categories. (A) Distribution of excess mortality values in two categories of countries at three different time intervals of the pandemic, visualized as boxplots. (B) Odds ratio of dying in each time interval depending on the country category. (C) Odds ratio of dying in later infection waves versus the previous infection waves depending on the country category.

Update of

Similar articles

Cited by

References

    1. VaccineTracker . European Centre for disease prevention and control, COVID-19 vaccine tracker. Available at: https://vaccinetrackerecdceuropaeu/public/extensions/COVID-19/vaccine-tr... (Accessed November 24, 20222).
    1. Webster P. Russian COVID-19 vaccine in jeopardy after Ukraine invasion. Nat Med (2022). doi: 10.1038/d41591-022-00042-y - DOI - PubMed
    1. Euronews . Slovakia Is second EU country to roll out russia’s Sputnik V COVID-19 vaccine (2021). Available at: https://www.euronews.com/my-europe/2021/06/07/slovakia-is-second-eu-coun....
    1. WHO . The sinovac-CoronaVac COVID-19 vaccine: what you need to know (2021). Available at: https://www.who.int/news-room/feature-stories/detail/the-sinovac-covid-1....
    1. Harder T, Kulper-Schiek W, Reda S, Treskova-Schwarzbach M, Koch J, Vygen-Bonnet S, et al. . Effectiveness of COVID-19 vaccines against SARS-CoV-2 infection with the delta (B.1.617.2) variant: second interim results of a living systematic review and meta-analysis, 1 January to 25 august 2021. Euro Surveill (2021) 26(41):2100920. doi: 10.2807/1560-7917.ES.2021.26.41.2100920 - DOI - PMC - PubMed

Publication types

Supplementary concepts