

Hydropower: A low-hanging sour-sweet energy option for India
- PMID: 37484265
- PMCID: PMC10361295
- DOI: 10.1016/j.heliyon.2023.e17151
Hydropower: A low-hanging sour-sweet energy option for India
Abstract
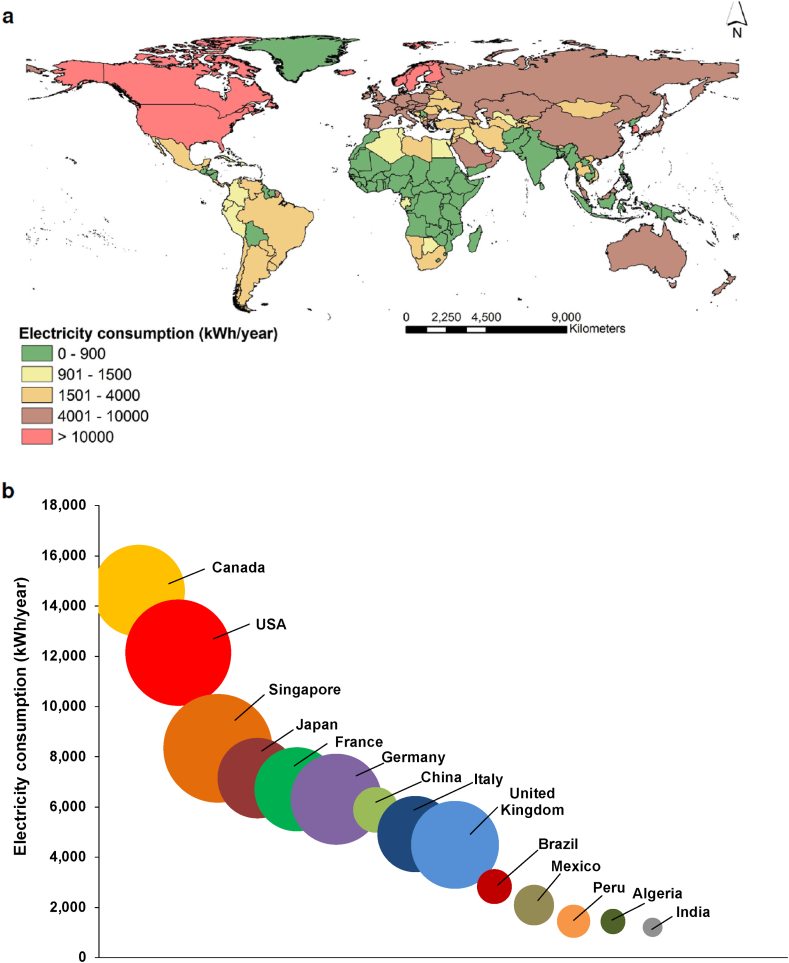
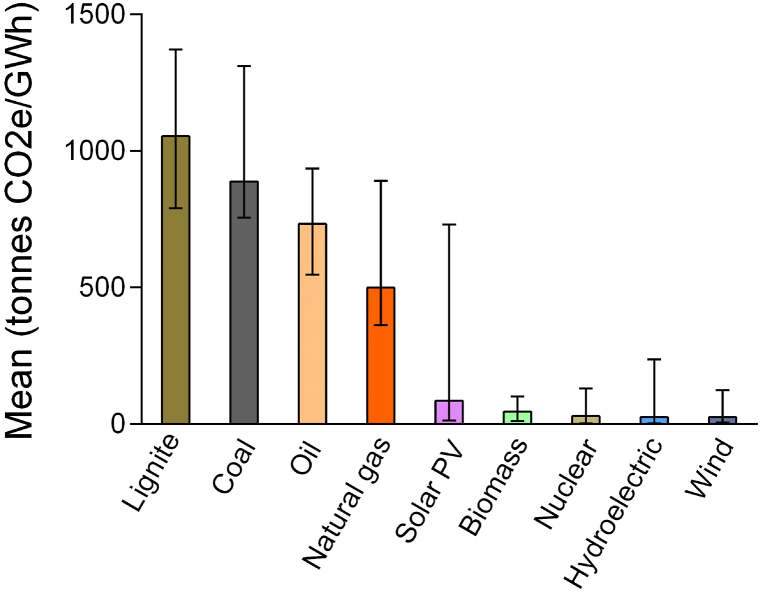
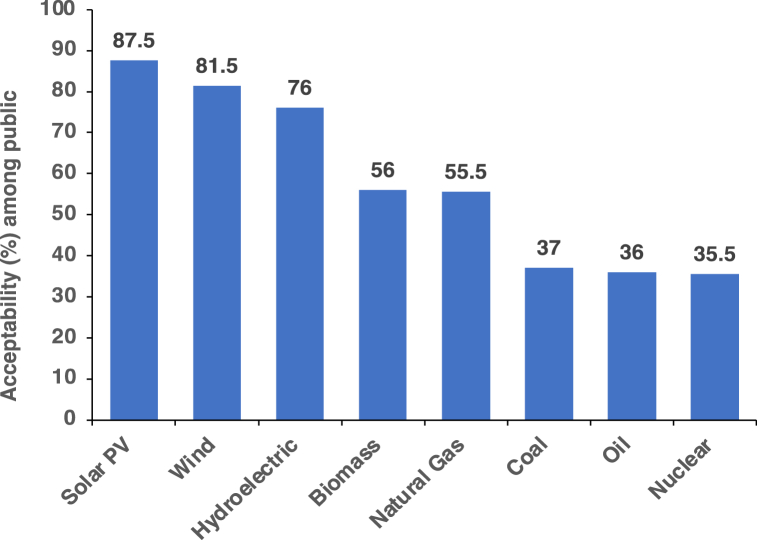
India is the world's second largest populous nation, fifth largest economy with seventh largest geographical area but experiences high energy poverty. With the lowest per capita energy consumption among world's top ten economies, India ranks at 137 out of 218 nations. Hydropower has the potential to alleviate India's energy asymmetry as well as realize its sustainable growth aspiration of a low-carbon regime. However, hydropower in India has been plagued by debates on human displacement, loss of biodiversity, increased risk of natural disasters, and socio-economic conflicts making it an unpopular energy alternative. Here, we review and address various concerns related to India's hydropower sector, examine scientific evidence, analyze energy policy imperatives, geopolitical considerations, and future directions for a sustainable hydropower policy in India in the context of ongoing climate change. Evidence indicates that besides electricity generation, hydropower infrastructure helps: (i) avert floods, (ii) mitigate the impacts of global warming, and (iii) ensure redistribution of water to arid regions and improve water security. As a part of sustainable hydropower policy, we propose that most of the ecological and social problems associated with hydropower development can be avoided to a great extent through careful planning, proper project design, responsible ownership, and public participation. As short-term measures, we propose: (i) entrepreneurs and planners follow credible and transparent pre-project investigations, (ii) mandatory implementation of environmental management plans, and (iii) better accountability and transparency of statutory bodies as well as hydropower developers. For long-term measures, we suggest: (i) create a 'National Institute of Energy & Environmental Sustainability' to oversee post-project hydropower developmental activities, (ii) streamline various bureaucratic and institutional procedures, and (ii) establish a trans-boundary water management system for seamless and coordinated implementation of hydropower development programs across upstream-downstream nations.
Keywords: Dams; Energy poverty; Environmental management plans; Global warming; Greenhouse gases; Hydropower.
© 2023 The Authors. Published by Elsevier Ltd.
Conflict of interest statement
The authors declare that they have no known competing financial interests or personal relationships that could have appeared to influence the work reported in this paper. MKP declares that he was an Independent Director on the Board of Directors of a public sector undertaking, namely Tehri Hydro Development Corporation.
Figures
Similar articles
-
Hydropower and sustainability: resilience and vulnerability in China's powersheds.J Environ Manage. 2009 Jul;90 Suppl 3:S286-93. doi: 10.1016/j.jenvman.2008.07.029. Epub 2008 Nov 13. J Environ Manage. 2009. PMID: 19013007
-
Increased hydropower but with an elevated risk of reservoir operations in India under the warming climate.iScience. 2023 Jan 14;26(2):105986. doi: 10.1016/j.isci.2023.105986. eCollection 2023 Feb 17. iScience. 2023. PMID: 36756370 Free PMC article.
-
Sustainable hydropower in the 21st century.Proc Natl Acad Sci U S A. 2018 Nov 20;115(47):11891-11898. doi: 10.1073/pnas.1809426115. Epub 2018 Nov 5. Proc Natl Acad Sci U S A. 2018. PMID: 30397145 Free PMC article.
-
Socio-environmental impacts of hydropower construction in Burundi.Heliyon. 2024 Nov 2;10(21):e40084. doi: 10.1016/j.heliyon.2024.e40084. eCollection 2024 Nov 15. Heliyon. 2024. PMID: 39559193 Free PMC article. Review.
-
Current status of running renewable energy in Bangladesh and future prospect: A global comparison.Heliyon. 2023 Mar 15;9(3):e14308. doi: 10.1016/j.heliyon.2023.e14308. eCollection 2023 Mar. Heliyon. 2023. PMID: 36967906 Free PMC article. Review.
References
-
- Varma R. Sushil, Bridging the electricity demand and supply gap using dynamic modeling in the Indian context. Energy Pol. 2019;132:515–535. doi: 10.1016/j.enpol.2019.06.014. - DOI
-
- Bandyopadhyay J. A critical look at the report of the world commission on dams in the context of the debate on large dams on the Himalayan Rivers. Int. J. Water Resour. Dev. 2002;18:127–145. doi: 10.1080/07900620220121701. - DOI
-
- MoP Power. 2022. Sector at a Glance: All India.https://powermin.gov.in/en/content/power-sector-glance-all-india (accessed October 15, 2022)
Publication types
LinkOut - more resources
Full Text Sources
Research Materials
