. 2023 Jun 3;9(6):e16982.
doi: 10.1016/j.heliyon.2023.e16982. eCollection 2023 Jun.

Comparison of NET quantification methods based on immunofluorescence microscopy: Hand-counting, semi-automated and automated evaluations

Affiliations

Comparison of NET quantification methods based on immunofluorescence microscopy: Hand-counting, semi-automated and automated evaluations

Timo Henneck et al. Heliyon. .

Abstract

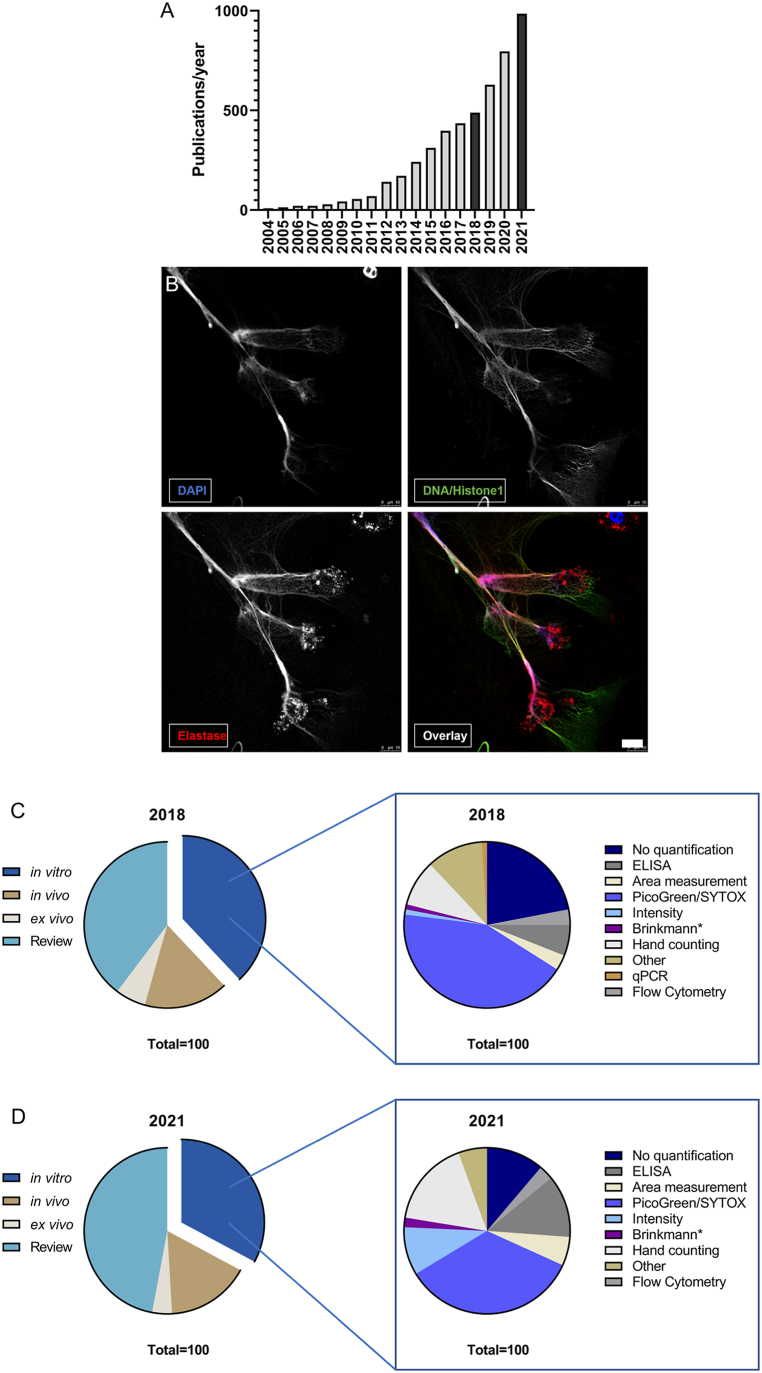
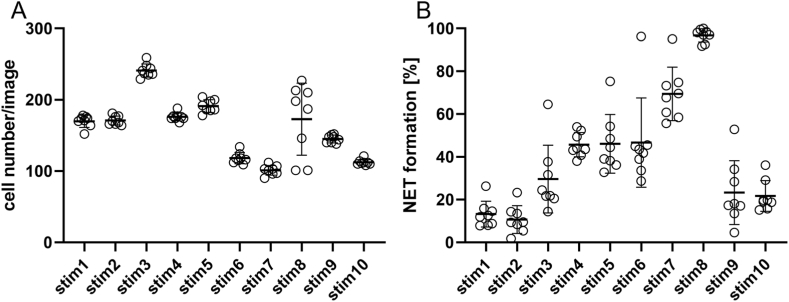
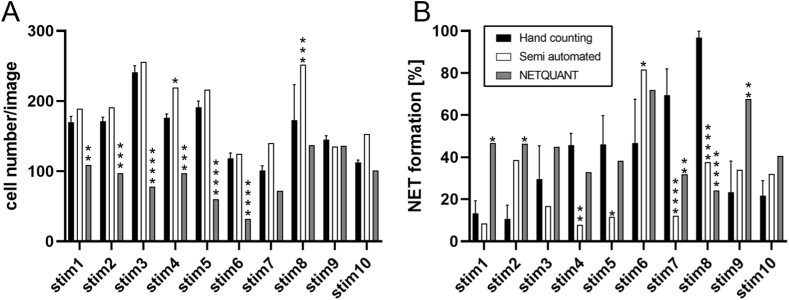
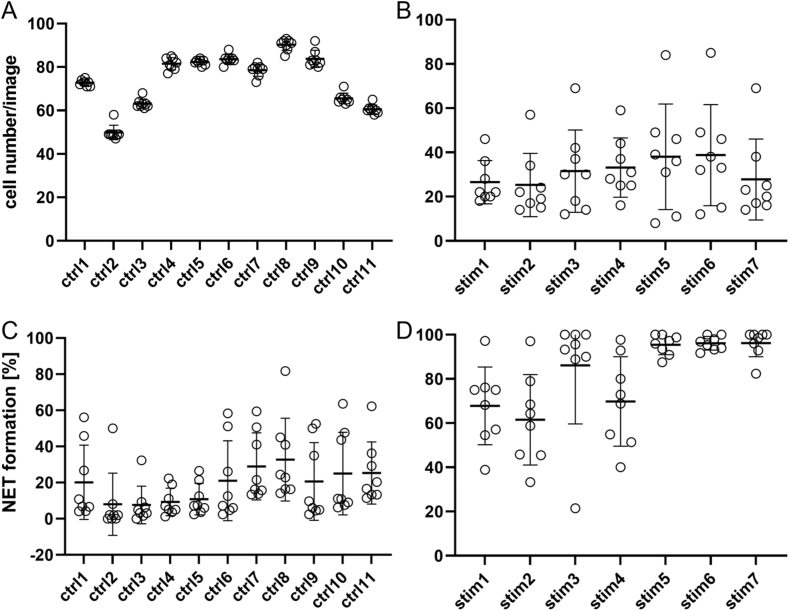
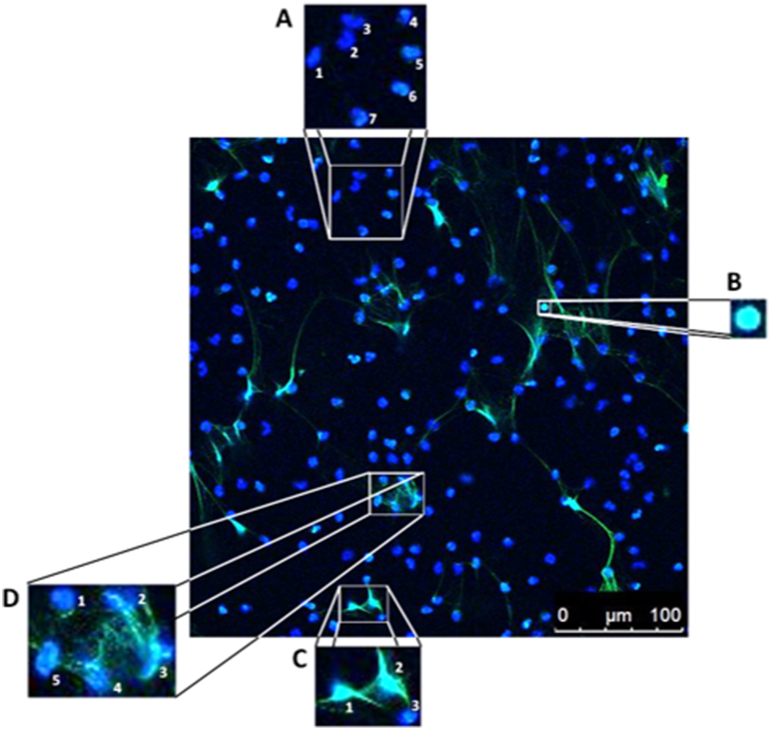
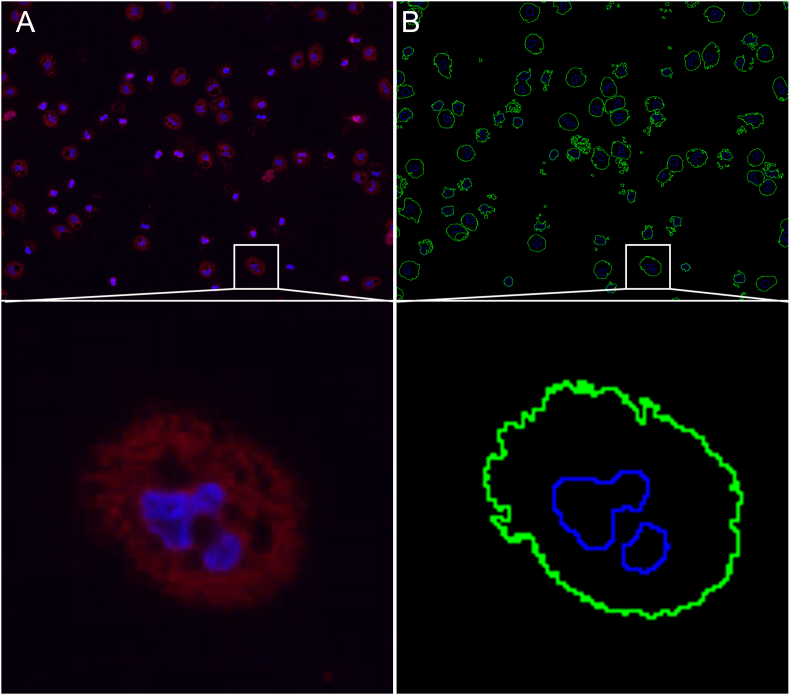
Formation of neutrophil extracellular traps was first described in 2004, showing that NETs are composed of decondensed chromatin fibers and nuclear and granule components. Free DNA is often used to quantify NETs, but to differentiate NETosis from necrotic DNA-release, immunofluorescence microscopy with NET-specific markers is required. Although evaluation by hand is time-consuming and difficult to standardize, it is still widespread. Unfortunately, no standardized method and only limited software tools are available for NET evaluation. This study provides an overview of recent techniques in use and aims to compare two published computer-based methods with hand counting. We found that the selected semi-automated quantification method and fully automated quantification via NETQUANT differed significantly from results obtained by hand and exhibited problems in detection of complex NET structures with partially illogical results. In contrast to that, trained persons were able to adapt to varying settings. Future approaches aimed at developing deep-learning algorithms for fast and reproducible quantification of NETs are needed.

Keywords: Cell counting; ImageJ; In vitro; NETQUANT; NETs; Quantification.


Conflict of interest statement

The authors declare that they have no known competing financial interests or personal relationships that could have appeared to influence the work reported in this paper

Figures

Fig. 1
Fig. 1
Increasing interest in NET research and the associated techniques used for NET quantification. A shows the number of publications listed by Pubmed under the term “neutrophil extracellular trap”. Since the first description in 2004, NETs are a research topic with increasing representation in literature. B Exemplary immunofluorescence micrograph of NET formation by human neutrophils stimulated with Simvastatin (10 μM, 3 h) and stained with DAPI and antibodies against DNA/Histone1 complex (green) and neutrophil elastase (red). The image is presented with the individual channels and an overlay. Individual channels highlight the advantage of antibody staining over pure DNA intercalating dyes by exposing more details of NET structures. The image was acquired as stated in the methods section with the following modifications: additional staining against neutrophil elastase (primary antibody: anti-neutrophil elastase, rabbit, polyclonal, Millipore, Cat# 3864, secondary antibody: Alexa Fluor 633, goat anti-rabbit, Thermo Scientific Cat#: A21070), and image acquisition with HCX PL APO lambda blue 63.0×1.40 OIL UV objective. Scale bar 10 μm. C provides an overview of NET research and the proportion of research categories in 2018. Most publications were reviews (39.72%), followed by in vitro research (37.98%). In vivo and ex vivo studies were described to a lesser extent. Within the group of in vitro studies, the NET quantification methods were counted. A total of 22% of the studies did not show quantification data. Most publications used tools for quantification with DNA intercalating dyes, followed by hand counting of NETs on micrographs by immunofluorescence microscopy (9%) and ELISA (6%). D shows the same analysis for the year 2021 where reviews made up 47.01% of the published articles, while in vitro research still accounted for 32.83% of the screened articles. In the group of in vitro studies, the number of studies which did not quantify NET formation decreased to 11.21%. Analysis of NET formation via DNA intercalating dyes was still the most favored method (34.58%), but other techniques were used more frequently. Hand counting increased to 16.82% of the studies and ELISA techniques were used in 12.15% of these. Also, area and intensity measurements were used more frequently, while flow cytometry and program-based analysis of micrographs only played a minor role in both years.
Fig. 2
Fig. 2
Overview of fluorescence images of NETs with subsequent evaluation by hand counting or semi-automated quantification. NET-negative cells are morphologically seen as small, round, or lobulated nuclei that are stained with DAPI (a blue-fluorescent DNA stain). NET-positive cells show green extracellular off-shoots including any cells that attach to the NET or are distinguished by their blurry rim, enlarged and decondensed (puffy) green nucleus. Green indicates positive staining for DNA-histone-1-complexes as marker for NETs. For hand counting, all cells were counted with the Cell Counter plugin for ImageJ for individually marking each cell. Here, NET-negative cells were labeled in magenta with the number 4, and NET-positive cells were marked in yellow with the number 5. The workflow of NET quantification with the semi-automated approach is shown in ImageJ. Images were separated into respective channels for DAPI (blue) and DNA/Histone complex (green). After converting to the 8-Bit format, values for the background threshold and minimal size were determined. The program determined the events for each channel and respective values were used for manual calculation of NET formation rates.
Fig. 3
Fig. 3
Manual quantification of cell number and NET formation derived from image set 1. The graph depicts values for each image derived from the individual examiners (circles) as well as mean and standard deviation for each image (bars). A: Cell counts determined by the individual examiners. B: Determination of NET formation by the individual examiners.
Fig. 4
Fig. 4
Comparison of NET quantification by hand counting semi-automated quantification and NETQUANT. A: Cell numbers for Image set 1 determined by all three methods, showing significantly fewer cell counts by NETQUANT in the majority of the images. B: NET formation determined by all methods revealed a significant difference between hand counting and NETQUANT as well as the semi-automated method. Statistical analysis was performed by Two-Way ANOVA with Dunnett correction for multiple comparison. Semi-automated and NETQUANT values were compared with hand counting. Data are given as mean ± SD. (*p < 0.05, **p < 0.01, ***p < 0.001, ****p < 0.0001).
Fig. 5
Fig. 5
Cell number and NET formation of control and stimulated groups determined by hand counting from image set 2. Eight individual examiners (circles) determined the cell number and NET formation. Averages of all values (vertical bars) are given with respective standard deviation. A shows the cell number in the control group and B the cell number of the stimulated group. C shows the NET formation determined in the control group and D the stimulated group; both groups show differences in the individual values for NET formation.
Fig. 6
Fig. 6
Comparison of hand counting, NETQUANT, and semi-automated quantification for image set 2. A shows the cell count for the control group with the semi-automated methods giving unrealistically high values for some images. Significant differences by both semi-automated and NETQUANT compared to hand counting were apparent. In B, the pattern remained similar to A, where the semi-automated method showed remarkably higher values of cell counts in several cases. C depicts NET formation values by all three methods, with the semi-automated method showing significantly higher results than both other methods in the control group, even exceeding 100% NET formation. D shows NET formation of the stimulated group where NETQUANT exhibited values within the range of hand counting, while the semi -automated method revealed significant differences. Statistical analysis was performed by Two-Way ANOVA with Dunnett correction for multiple comparison. Semi -automated and NETQUANT values were compared to hand counting. Data are given as mean ± SD. (*p < 0.05, **p < 0.01, ***p < 0.001, ****p < 0.0001).
figs1
figs1
figs2
figs2
figs3
figs3
figs4
figs4
figs5
figs5

References

    1. Mayadas T.N., Cullere X., Lowell C.A. The multifaceted functions of neutrophils. Annu. Rev. Pathol. 2014;9:181–218. doi: 10.1146/annurev-pathol-020712-164023. - DOI - PMC - PubMed
    1. Brinkmann V., Reichard U., Goosmann C., Fauler B., Uhlemann Y., Weiss D.S., Weinrauch Y., Zychlinsky A. Neutrophil extracellular traps kill bacteria. Science (1979) 2004;303:1532–1535. doi: 10.1126/science.1092385. - DOI - PubMed
    1. Fuchs T.A., Abed U., Goosmann C., Hurwitz R., Schulze I., Wahn V., Weinrauch Y., Brinkmann V., Zychlinsky A. Novel cell death program leads to neutrophil extracellular traps. JCB (J. Cell Biol.) 2007;176:231–241. doi: 10.1083/jcb.200606027. - DOI - PMC - PubMed
    1. Papayannopoulos V., Metzler K.D., Hakkim A., Zychlinsky A. Neutrophil elastase and myeloperoxidase regulate the formation of neutrophil extracellular traps. JCB (J. Cell Biol.) 2010;191:677–691. doi: 10.1083/jcb.201006052. - DOI - PMC - PubMed
    1. Neumann A., Berends E.T.M., Nerlich A., Molhoek E.M., Gallo R.L., Meerloo T., Nizet V., Naim H.Y., von Köckritz-Blickwede M. The antimicrobial peptide LL-37 facilitates the formation of neutrophil extracellular traps. Biochem. J. 2014;464:3–11. doi: 10.1042/BJ20140778. - DOI - PubMed

LinkOut - more resources