

doi: 10.3368/jhr.59.2.0720-11064r1.
Epub 2021 Jun 9.
DISTRIBUTIONAL EFFECTS OF EDUCATION ON HEALTH
Affiliations
- PMID: 37484544
- PMCID: PMC10361687
- DOI: 10.3368/jhr.59.2.0720-11064r1
Item in Clipboard
DISTRIBUTIONAL EFFECTS OF EDUCATION ON HEALTH
J Hum Resour.
2023 Jul.
Abstract
This paper studies distributional effects of education on health. In 1972, England, Scotland, and Wales raised their minimum school-leaving age from 15 to 16 for students born after 9/1/1957. Using a regression discontinuity design and objective health measures for 129,000 individuals, we find that education reduced body size and increased blood pressure in middle age. The reduction in body size was concentrated at the upper tail of the distribution with an 8 percentage point reduction in obesity. The increase in blood pressure was concentrated at the lower tail of the distribution with no effect on stage 2 hypertension.
Keywords: I10; I20.
Figures
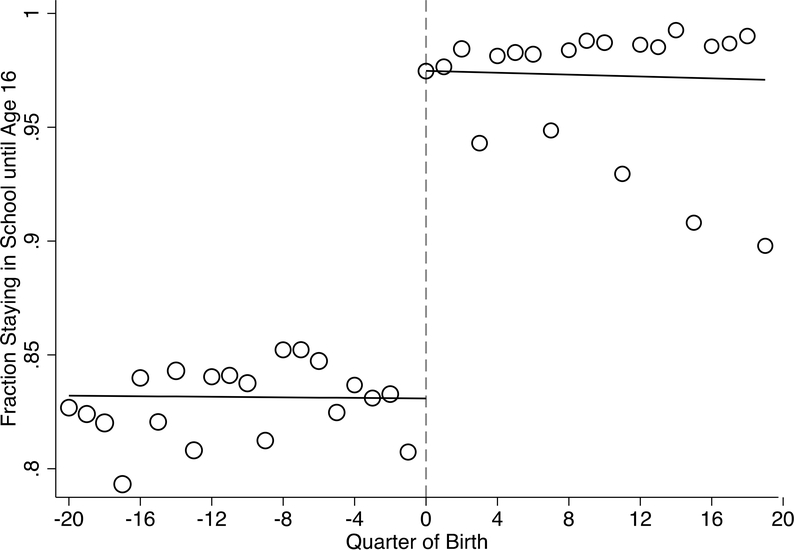
Notes: The figure shows the fraction of study participants who stayed in school until age 16 by quarter of birth. The dashed vertical line marks the first birth cohort affected by the 1972 school-leaving age reform. Cohorts born to the right of the line had to stay in school until age 16 while cohorts born before could leave at age 15. The curves show linear trends in quarter of birth that capture birth cohort trends. The circumference of each circle reflects the number of participants born in that quarter. N = 129,370.

Notes: The figure shows the fraction of study participants with a CSE or O-level qualification by quarter of birth. The dashed vertical line marks the introduction of the policy. Cohorts born to the right of the line had to stay in school until age 16 while cohorts born before could leave at age 15. The curves show quadratic polynomials in quarter of birth that capture birth cohort trends. The circumference of each circle reflects the number of participants born in that quarter. N = 128,169.
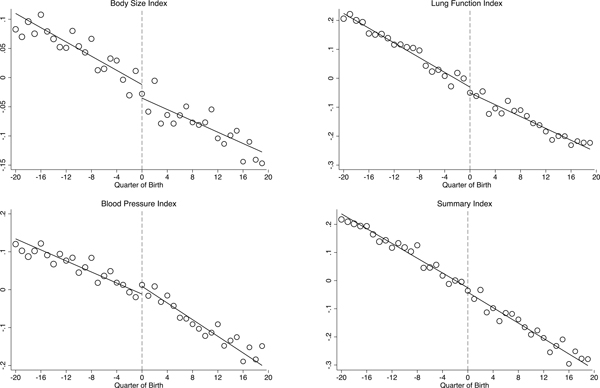
Notes: These figures show average health by quarter of birth. See Table 2 for number of observations.
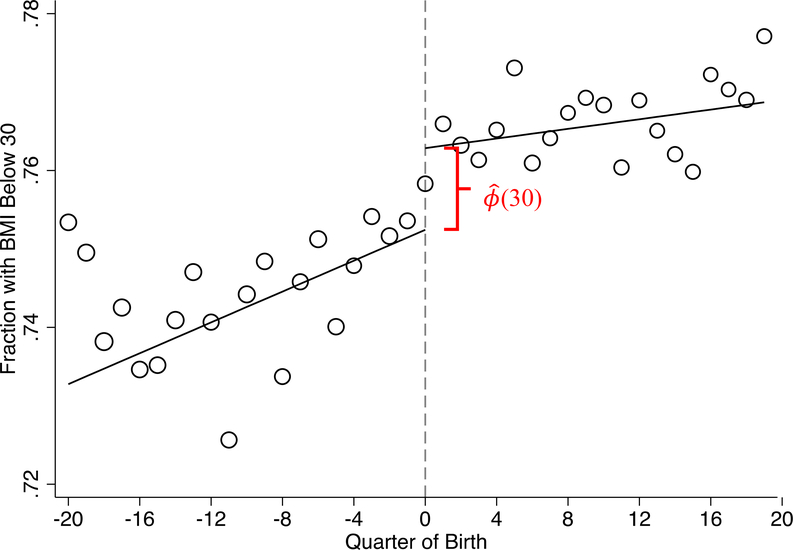
Notes: The figure shows the fraction of study participants with a BMI below 30 by quarter of birth. The dashed vertical line marks the introduction of the policy. Cohorts born to the right of the line had to stay in school until age 16 while cohorts born before could leave at age 15. The curves show linear trends in quarter of birth that capture birth cohort trends. The circumference of each circle reflects the number of participants born in that quarter. N = 128,856.

Notes: The figure shows the pre- and post-reform CDFs of body mass index for compliers. See section III.C for an explanation of how the figure is constructed. N = 128,856
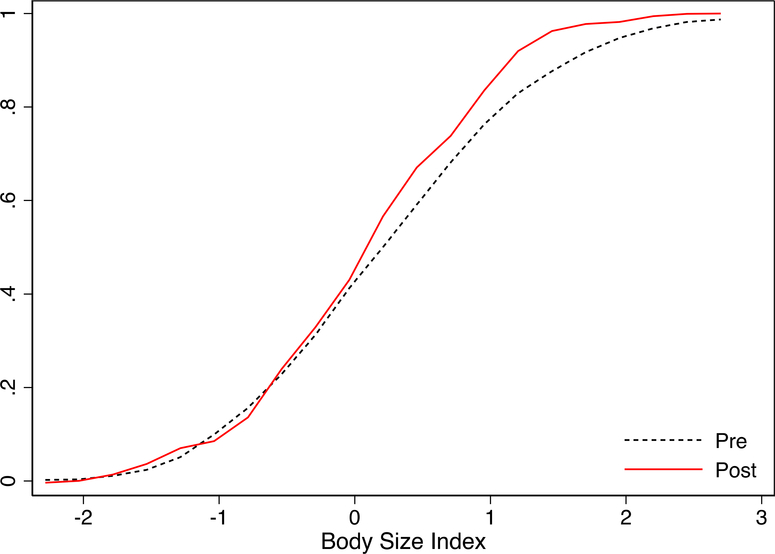
Notes: The figure shows the pre- and post-reform CDFs of the body size index for compliers. See section III.C for an explanation of how the figure is constructed. N = 127,366.

Notes: The figure shows the pre- and post-reform CDFs of the lung function index for compliers. See section III.C for an explanation of how the figure is constructed. N = 103,682.

Notes: The figure shows the pre- and post-reform CDFs of the blood pressure index for compliers. See section III.C for an explanation of how the figure is constructed. N = 129,165.

Notes: The figure shows the pre- and post-reform CDFs of diastolic blood pressure for compliers. See section III.C for an explanation of how the figure is constructed. N = 129,165.
References
-
- Allen Naomi, Sudlow Cathie, Downey Paul, Peakman Tim, Danesh John, Elliott Paul, Gallacher John, Green Jane, Matthews Paul, Pell Jill, Sprosen Tim, and Collins Rory. 2012. “UK Biobank: Current Status and What It Means for Epidemiology.” Health Policy and Technology 1(3): 123–126.
-
- Albouy Valerie, and Lequien Laurent. 2009. “Does Compulsory Education Lower Mortality?.” Journal of Health Economics 28(1): 155–168. - PubMed
-
- Anderson Michael L. 2008. “Multiple Inference and Gender Differences in the Effects of Early Intervention: A Reevaluation of the Abecedarian, Perry Preschool, and Early Training Projects.” Journal of the American Statistical Association 103(484): 1481–1495.
-
- Anderson TW, & Darling DA 1952. Asymptotic Theory of Certain” Goodness of Fit” Criteria Based on Stochastic Processes. the Annals of Mathematical Statistics, 193–212.
-
- Aune Dagfinn, Sen Abhijit, Prasad Manya, Norat Teresa, Janszky Imre, Tonstad Serena, Romundstad Pål, and Vatten Lars J.. 2016. “BMI and All-Cause Mortality: Systematic Review and Non-Linear Dose-Response Meta-Analysis of 230 Cohort Studies With 3.74 Million Deaths Among 30.3 Million Participants.” bmj 353. - PMC - PubMed
Grants and funding
LinkOut - more resources
Full Text Sources