. 2023 Jul 20;7(7):e513.
doi: 10.1002/pld3.513. eCollection 2023 Jul.

Physiological and molecular responses of different rose (Rosa hybrida L.) cultivars to elevated ozone levels

Affiliations

Physiological and molecular responses of different rose (Rosa hybrida L.) cultivars to elevated ozone levels

Hua Wang et al. Plant Direct. .

Abstract

The increasing ground-level ozone (O3) pollution resulting from rapid global urbanization and industrialization has negative effects on many plants. Nonetheless, many gaps remain in our knowledge of how ornamental plants respond to O3. Rose (Rosa hybrida L.) is a commercially important ornamental plant worldwide. In this study, we exposed four rose cultivars ("Schloss Mannheim," "Iceberg," "Lüye," and "Spectra") to either unfiltered ambient air (NF), unfiltered ambient air plus 40 ppb O3 (NF40), or unfiltered ambient air plus 80 ppb O3 (NF80). Only the cultivar "Schloss Mannheim" showed significant O3-related effects, including foliar injury, reduced chlorophyll content, reduced net photosynthetic rate, reduced stomatal conductance, and reduced stomatal apertures. In "Schloss Mannheim," several transcription factor genes-HSF, WRKY, and MYB genes-were upregulated by O3 exposure, and their expression was correlated with that of NCED1, PP2Cs, PYR/PYL, and UGTs, which are related to ABA biosynthesis and signaling. These results suggest that HSF, WRKY, and MYB transcription factors and ABA are important components of the plant response to O3 stress, suggesting a possible strategy for cultivating O3-tolerant rose varieties.

Keywords: molecular response; ozone; physiological responses; rose; sensitivity.


Conflict of interest statement

The authors have no conflict of interest to declare.

Figures
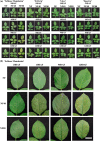
FIGURE 1
FIGURE 1
O3 foliar injury symptoms were detected in the leaves of “Schloss Mannheim” but not the other rose cultivars under three O3 treatments at 30, 60, 90, and 120 DAF. (a) O3 foliar symptoms of “Schloss Mannheim,” “Iceberg,” “Lüye,” and “Spectra.” (b) The chlorotic spots on the leaves of the sensitive cv. “Schloss Mannheim.” NF, control treated with unfiltered ambient air; NF40, elevated O3 with the targeted addition of 40 ppb O3; NF80, elevated O3 with the targeted addition of 80 ppb O3. Note: bar, 2 cm in images of compound leaves (a) and 1 cm in images of lobules (b).
FIGURE 2
FIGURE 2
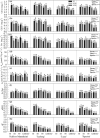
Effects of O3 on chloroplast pigment contents, gas‐exchange and chlorophyll fluorescence parameters in rose cultivars “Schloss Mannheim,” “Iceberg,” “Lüye,” and “Spectra” under three treatments at 30, 60, 90, and 120 DAF. (a) Mean value (mean ± SE) of chlorophyll a (mg g−1 fresh leaf) contents. (b) Mean value (mean ± SE) of chlorophyll b (mg g−1 fresh leaf) contents. (c) Mean value (mean ± SE) of carotenoid (mg g−1 fresh leaf) contents. (d) Mean value (mean ± SE) of net photosynthesis rates (Asat). (e) Mean value (mean ± SE) of stomatal conductance (gs). (f) Mean value (mean ± SE) of efficiency of excitation energy capture by open PSII reaction centers (F v′/F m′). (g) Mean value (mean ± SE) of quantum yield of PSII electron transport (ΦPSII). (h) Mean value (mean ± SE) of photochemical quenching (qP). Different letters above the bars indicate significant differences between treatments (one‐way ANOVA followed by Duncan's test: p < .05), while same letters above the bars indicate non‐significant differences between treatments (one‐way ANOVA followed by Duncan's test: p > .05). Ozone, time, and species indicate O3 treatments, different time points, and different cultivars.
FIGURE 3
FIGURE 3
Effects of O3 on leaf stomata of rose cultivars “Schloss Mannheim,” “Iceberg,” “Lüye,” and “Spectra” at 120 DAF. (a) Scanning electron microscopy images of the abaxial (lower) and adaxial (upper) leaf surfaces at 120 DAF under various magnifications. (b) Mean value (mean ± SE, n = 50) of stomatal length, width, area, and aperture changes under different O3 treatments. Bar, 100 and 20 μm in SEM images obtained at 500X and 2,000X magnification. Different letters above the bars indicate significant differences between treatments (one‐way ANOVA followed by Duncan's test: p < .05), while same letters above the bars indicate non‐significant differences between treatments (one‐way ANOVA followed by Duncan's test: p > .05).
FIGURE 4
FIGURE 4
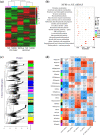
RNA‐seq and weighted gene coexpression network analysis (WGCNA) was conducted using leaves samples from O3 stress and control treatments collected at 60 and 120DAF in O3‐sensitive cultivar “Schloss Mannheim.” (a) Expression profiles of the ozone responsive DEGs based on fragments per kilobase of transcript per million fragments mapped (FPKM) values. (b) Kyoto Encyclopedia of Genes and Genomes (KEGG) enrichment analyses of ozone responsive DEGs. (c) Hierarchical clustering showing 23 modules of coexpressed genes. (d) WGCNA analysis for differentially expressed genes. Corresponding p values of module‐sample correlations are indicated in parenthesis. The panel on the left side shows the 23 modules. The color scale on the right side shows module‐trait correlation from −1 (blue) to 1 (red).
FIGURE 5
FIGURE 5
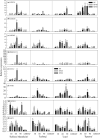
Expression analysis of TF genes, ABA biosynthesis, and signaling‐related genes in response to O3 treatment (NF, NF40, or NF80) in rose cultivars “Schloss Mannheim,” “Iceberg,” “Lüye,” and “Spectra” at 30, 60, 90, and 120 DAF. Different letters above the bars indicate significant differences between treatments at p < .05.
FIGURE 6
FIGURE 6
Principal component analysis biplot of the physiological parameters and gene expressions levels in response to O3 in the leaves of O3 sensitive cultivar. Black dots indicate physiological parameters; white dots indicate TF‐related and ABA signaling‐related gene expression levels; gray dots indicate ABA biosynthesis‐related gene expression levels.
FIGURE 7
FIGURE 7
Model depicting plant responses to O3 stress.

References

    1. Ainsworth, E. A. (2017). Understanding and improving global crop response to ozone pollution. The Plant Journal, 90, 886–897. 10.1111/tpj.13298 - DOI - PubMed
    1. Ashrafuzzaman, M. , Haque, Z. , Ali, B. , Mathew, B. , Yu, P. , Hochholdinger, F. , de Abreu Neto, J. B. , McGillen, M. R. , Ensikat, H. J. , & Manning, W. J. (2018). Ethylenediurea (EDU) mitigates the negative effects of ozone in rice: Insights into its mode of action. Plant, Cell & Environment, 41, 2882–2898. 10.1111/pce.13423 - DOI - PubMed
    1. Beijing Gardening and Greening Bureau . (2017). Collection of Beijing urban gardening and afforestation survey, monograph. Beijing Publishing House.
    1. Carvalho, D. R. A. , Vasconcelos, M. W. , Lee, S. , Koning‐Boucoiran, C. F. S. , Vreugdenhil, D. , Krens, F. A. , Heuvelink, E. , & Carvalho, S. M. P. (2016). Gene expression and physiological responses associated to stomatal functioning in Rosa × hybrida grown at high relative air humidity. Plant Science, 253, 154–163. 10.1016/j.plantsci.2016.09.018 - DOI - PubMed
    1. Chappelka, A. H. , & Samuelson, L. J. (1998). Ambient ozone effects on forest trees of the eastern United States: A review. New Phytologist, 139, 91–108. 10.1046/j.1469-8137.1998.00166.x - DOI

LinkOut - more resources