. 2023 Jul 5:11:981425.
doi: 10.3389/fcell.2023.981425. eCollection 2023.

HURP localization in metaphase is the result of a multi-step process requiring its phosphorylation at Ser627 residue

Affiliations

HURP localization in metaphase is the result of a multi-step process requiring its phosphorylation at Ser627 residue

Stylianos Didaskalou et al. Front Cell Dev Biol. .

Abstract

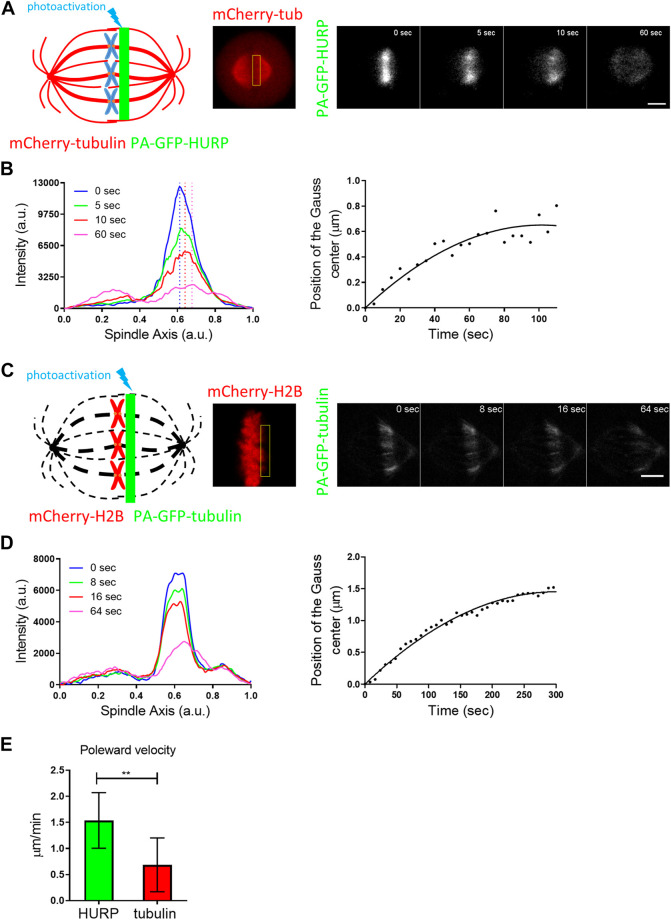
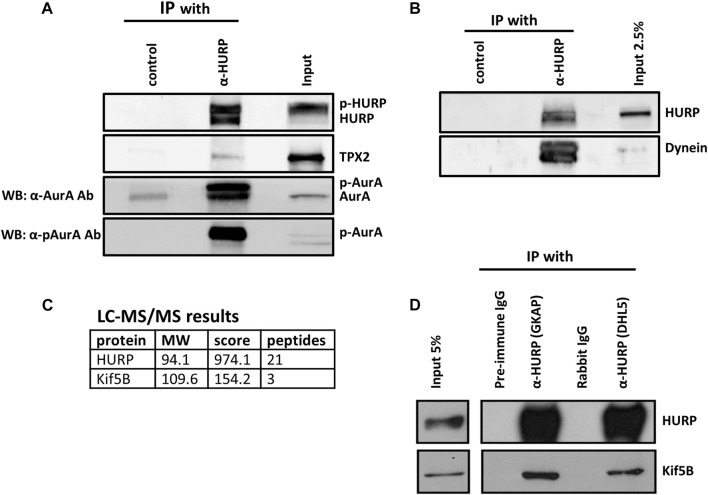
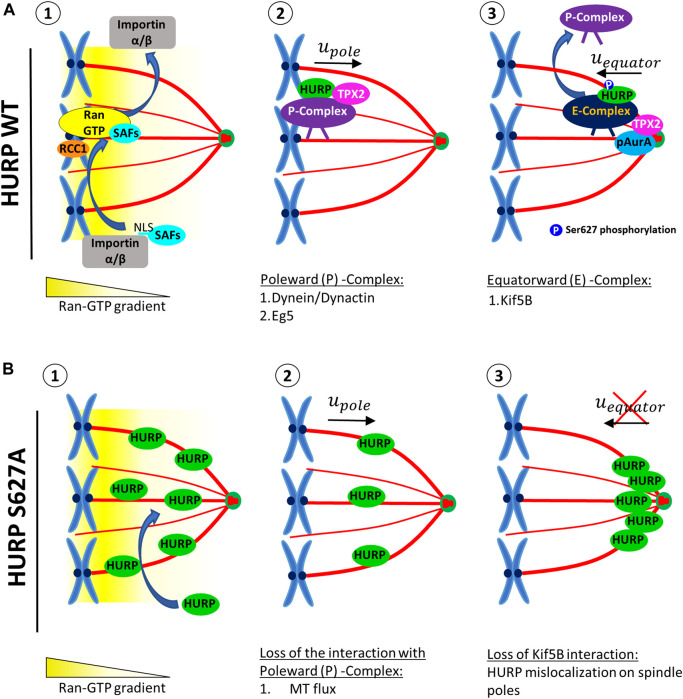
Faithful chromosome segregation during cell division requires accurate mitotic spindle formation. As mitosis occurs rapidly within the cell cycle, the proteins involved in mitotic spindle assembly undergo rapid changes, including their interactions with other proteins. The proper localization of the HURP protein on the kinetochore fibers, in close proximity to chromosomes, is crucial for ensuring accurate congression and segregation of chromosomes. In this study, we employ photoactivation and FRAP experiments to investigate the impact of alterations in microtubule flux and phosphorylation of HURP at the Ser627 residue on its dynamics. Furthermore, through immunoprecipitations assays, we demonstrate the interactions of HURP with various proteins, such as TPX2, Aurora A, Eg5, Dynein, Kif5B, and Importin β, in mammalian cells during mitosis. We also find that phosphorylation of HURP at Ser627 regulates its interaction with these partners during mitosis. Our findings suggest that HURP participates in at least two distinct complexes during metaphase to ensure its proper localization in close proximity to chromosomes, thereby promoting the bundling and stabilization of kinetochore fibers.

Keywords: Aurora A; FRAP (fluorescence recovery after photobleaching); HURP dynamics; HURP localization; HURP phosphorylation; TPX2; mitosis; photoactivation.


Conflict of interest statement

The authors declare that the research was conducted in the absence of any commercial or financial relationships that could be construed as a potential conflict of interest.

Figures

FIGURE 1
FIGURE 1
Endogenous HURP dynamics after photobleaching half of the mitotic spindle. (A) Left: Representative image of HeLa Kyoto cell endogenously expressing eGFP-HURP, arrested in metaphase. Immunofluorescence was performed against α-tubulin and DNA was counterstained with Hoechst. Right: Endogenous eGFP-HURP and α-tubulin intensity plot profiles along HeLa Kyoto metaphase spindle long axis. Bold-lines indicate the average of n = 16 cells, and the green dashed-lines indicate the 95% CI. (B) Schematic representation of a FRAP experiment performed on HeLa Kyoto cells endogenously expressing eGFP-HURP, counterstained with SiR-tubulin and arrested in metaphase. Tubulin signal was used as a spatial reference for drawing a polygon (bleaching geometry) to photobleach HURP molecules. Time-point 0 s represents the first acquired frame post photobleaching. (C) Representative images of control (upper panel) and Nocodazole (lower panel) treated HeLa Kyoto cells at different timepoints post photobleaching. (D) Left: Fluorescence recovery curves of eGFP-HURP in control and Nocodazole treated cells. Bold-lines indicate the mean and dashed-lines represent the ± S.D. Right: One-phase exponential fitting resulted in half-lives of t1/2=25±5sec for control cells, (n = 18 cells) and t1/2=22±5sec for Nocodazole treated cells (n = 20 cells) (mean ± S.D.; *p = 0.032). (E) Left: eGFP-HURP fluorescence decay curves of the unbleached spindle half in control and Nocodazole treated cells. Bold-lines indicate the mean and dashed-lines represent the ±S.D. Right: One-phase decay fitting resulted in half-lives of t1/2=27±5sec for control, (n = 18 cells) and t1/2=23±5sec for Nocodazole treated cells (n = 20 cells). (mean ± S.D.; *p = 0.016). (F) Spindle-bound endogenous eGFP-HURP quantification (relative to SiR-tubulin signal), derived from the pre-photobleached frames. (control, n = 23 cells; Nocodazole, n = 30 cells). Scale bar denotes 5 μm.
FIGURE 2
FIGURE 2
Endogenous HURP spatial dynamics after photobleaching half of the mitotic spindle. (A) Schematic representation of spatial dynamics analysis. SiR-tubulin signal was used as a mask for metaphase spindle compartmentalization in six regions. The fluorescence decay curves of the unbleached spindle half and the fluorescence recovery curves of the bleached spindle half were generated. Bold-lines indicate the mean value and dashed-lines represent the ± S.D. (B) Fluorescence recovery half-lives were quantified by one-phase exponential fitting. (control, n = 16 cells; Nocodazole, n = 13 cells). Bars represent the mean value ± S.D. (C) Fluorescence decay half-lives were quantified by one-phase decay fitting. (control, n = 17 cells; Nocodazole, n = 13 cells). Bars represent the mean value ±S.D.
FIGURE 3
FIGURE 3
PA-GFP-HURP molecules photoactivated at the chromosome zone (A) Left: Schematic representation of photoactivation experiments in cells co-expressing PA-GFP-HURP and mCherry-tubulin in HeLa Kyoto cells. A 2 μm-wide area perpendicular to the spindle long axis (green stripe) was used to photoactivate PA-GFP-HURP molecules. Middle: mCherry-tubulin signal was used as a spatial reference to photoactivate PA-GFP-HURP molecules at the chromosome zone and register moving spindles during data processing. Right: Representative images of PA-GFP-HURP molecules at different timepoints post photoactivation. Scale bar denotes 5 μm. (B) Left: Representative pole to pole fluorescence intensity profiles showing the distribution of the photoactivated PA-GFP-HURP molecules near the chromosomes, at different timepoints post photoactivation. The t=0sec represents the first timepoint post photoactivation. The vertical dashed-lines designate the center of fluorescence distribution of photoactivated PA-GFP-HURP molecules at the corresponding timepoints. Right: Representative plot showing the center of fluorescence distribution over time, fitted by a second order polynomial to calculate PA-GFP-HURP poleward velocity. (C) Left: Schematic representation of photoactivation experiments in cells co-expressing PA-GFP-tubulin and mCherry-H2B, in HeLa Kyoto cells. A 2 μm-wide area perpendicular to the spindle long axis (green stripe) was used to photoactivate PA-GFP-tubulin molecules. Dark dashed-lines represent the expected mitotic spindle shape. Middle: mCherry-H2B signal was used as a spatial reference in order to photoactivate PA-GFP-tubulin at the chromosome zone, as well as to register cell movements during data processing. Right: Representative images of PA-GFP-tubulin at different timepoints post photoactivation. Scale bar denotes 5 μm. (D) Left: Representative pole to pole fluorescence intensity profiles showing the distribution of the photoactivated PA-GFP-tubulin molecules near the chromosomes, at different timepoints post photoactivation. The t=0sec represents the first timepoint post photoactivation. Right: Representative plot showing the center of fluorescence distribution over time, fitted by a second order polynomial to calculate PA-GFP-tubulin poleward velocity (MT flux). (E) Comparison of PA-GFP-tubulin and PA-GFP-HURP poleward velocities. Values indicate the mean ± S.D. (PA-GFP-tubulin, n = 7 cells; PA-GFP-HURP, n = 14 cells; **p = 0.0042).
FIGURE 4
FIGURE 4
PA-GFP-HURP molecules photoactivated at the pole zone (A) Left: Schematic representation of photoactivation experiments in cells co-expressing PA-GFP-HURP and mCherry-tubulin. A 2 μm-wide area perpendicular to the spindle long axis (green stripe) was used to photoactivate PA-GFP-HURP molecules. Middle: mCherry-tubulin signal was used as a spatial reference to photoactivate PA-GFP-HURP molecules at the pole zone and register moving spindles during data processing. Right: Representative images PA-GFP-HURP molecules at different timepoints post photoactivation. Scale bar denotes 5 μm. (B) Left: Representative pole to pole fluorescence intensity profiles showing the distribution of the photoactivated PA-GFP-HURP molecules near the poles at different timepoints post photoactivation. The t=0sec represents the first timepoint post photoactivation. Right: Representative plot showing the center of fluorescence distribution over time, fitted by a second order polynomial to calculate PA-GFP-HURP poleward velocity.
FIGURE 5
FIGURE 5
HURP interacting partners during mitosis (A) Co-immunoprecipitation assays using an antibody against HURP in HeLa Kyoto mitotic cell extracts. Rabbit IgG or anti-GFP rabbit polyclonal antibody were used as the respective controls. HURP and bound complexes were analyzed by Western blot using antibodies against HURP, TPX2 and two antibodies against Aurora A, as indicated on the left side (α-AurA antibody, or α-pAurA antibody). Input represents 6% of the total amount of protein used for the immunoprecipitation assay for HURP and p-Aurora A, 2% for TPX2, 5% for Aurora A. (B) Co-immunoprecipitation assay using an antibody against HURP in HeLa Kyoto mitotic cell extracts. Anti-GFP rabbit polyclonal antibody was used as a control. HURP and bound complexes were analyzed by Western blot using antibodies against HURP and Dynein. Input represents 2.5% of the total amount of protein used for the immunoprecipitation assay. (C) HeLa Kyoto mitotic extracts were immunoprecipitated using an antibody against HURP. The isolated complexes were analyzed by LC-MS/MS. Kif5B was identified as a possible partner of HURP. (D) Co-immunoprecipitation assays using either an antibody against the middle part (GKAP) or the N-terminal part of HURP (DHL5), in HeLa Kyoto mitotic cell extracts. Pre-immune IgG or Rabbit IgG were used as the respective controls. HURP and bound complexes were analyzed by Western blot using antibodies against HURP and Kif5B. Input represents 5% of the total amount of protein used for the immunoprecipitation assay.
FIGURE 6
FIGURE 6
Aurora A-dependent HURP phosphorylation at the Ser627 alters HURP localization and recovery dynamics after photobleaching (A) Schematic representation of WT HURP. Four potential Aurora A phosphorylation sites (blue lines) are located in the C-terminus. Black arrow indicates the Serine residue that is mutated to Alanine to create the HURP S627A mutant. (B) Left: Representative images of HeLa Kyoto cells transfected with either eGFP-HURP WT or eGFP-HURP S627A mutant and arrested at metaphase using MG132. Immunofluorescence has been performed against α-tubulin. DNA was counterstained with Hoechst. Right: Intensity plot profiles along metaphase spindle long axis of HeLa Kyoto cells transfected with either eGFP-HURP WT or eGFP-HURP S627A mutant. Lines indicate the mean values whereas dots represent the ± S.D. (eGFP-HURP WT, n = 46 cells; eGFP-HURP S627A mutant, n = 69 cells). (C) Representative images of cells expressing eGFP-HURP WT (upper panel) or eGFP-HURP S627A (lower panel) at different timepoints post photobleaching. Scale bars denote 5 μm. (D) Left: Fluorescence recovery curves of eGFP-HURP. Bold-lines indicate the mean value and dashed-lines represent the ±S.D. Right: One-phase exponential fitting resulted in half-lives of t1/2=22±7sec for HURP WT (n = 17 cells), and t1/2=47±16sec for HURP S627A (n = 26 cells) (mean ± S. D.; ****p < 0.0001). (E) Left: eGFP-HURP fluorescence decay curves of the unbleached spindle half. Bold-lines indicate the mean value and dashed-lines represent the ± S.D. Right: One-phase decay fitting resulted in half-lives of t1/2=26±9sec for HURP WT (n = 14 cells), and t1/2=63±28sec for HURP S627A (n = 23 cells) (mean ± S. D.; ****p < 0.0001). (F) Co-immunoprecipitation assays using an antibody against GFP in HeLa Kyoto mitotic extracts. HeLa Kyoto cells were transfected with eGFP, eGFP- HURP WT, or eGFP-HURP S627A, and bound complexes were analyzed by Western blot using antibodies against Kif5B, TPX2, Importin β, Aurora A, and GFP. Input lanes represent 4% of the total amount of protein used for the immunoprecipitation assays.
FIGURE 7
FIGURE 7
A proposed model for the localization of HURP in the vicinity of chromosomes on the metaphase spindle, involving a two-step process. (A) In the presence of high Ran-GTP concentration (1), SAFs including HURP are released from the inhibitory binding of Importins α/β near the chromosomes. HURP, along with other MAPs and motors, bind to MTs and forms the Poleward Complex (P-Complex). The P-Complex includes HURP, TPX2, Dynein/Dynactin, and Eg5. It is then transported towards the spindle pole in a Dynein/Dynactin-dependent manner (2). As the P-Complex reaches the intermediate zone, it interacts with the active Aurora A kinase (pAurA). TPX2 promotes hyperactivation of Aurora A, leading to the phosphorylation of HURP, at least at the Ser627 residue. This phosphorylation event disrupts the Poleward Complex and a new HURP complex is formed (Equatorward (E)-Complex), now containing at least a kinesin, such as Kif5B, which moves towards the equator (3). (B) The HURP S627A mutant molecules can bind to MTs independently of the Ran-GTP gradient due to the loss of inhibitory binding of Importin β to HURP (1). These mutant molecules bound to the spindle move towards the poles, possibly due to MT flux (2). However, since the mutant HURP molecules are unable to be phosphorylated at Ser627 by Aurora A and cannot interact with Kif5B, they cannot form an E-Complex and instead accumulate at the spindle poles (3).

References

    1. Bayliss R., Burgess S. G., McIntyre P. J. (2017). Switching Aurora-A kinase on and off at an allosteric site. FEBS J. 284, 2947–2954. 10.1111/febs.14069 - DOI - PubMed
    1. Bayliss R., Sardon T., Vernos I., Conti E. (2003). Structural basis of Aurora-A activation by TPX2 at the mitotic spindle. Mol. Cell 12, 851–862. 10.1016/s1097-2765(03)00392-7 - DOI - PubMed
    1. Castrogiovanni C., Inchingolo A. V., Harrison J. U., Dudka D., Sen O., Burroughs N. J., et al. (2022). Evidence for a HURP/EB free mixed-nucleotide zone in kinetochore-microtubules. Nat. Commun. 13, 4704. 10.1038/s41467-022-32421-x - DOI - PMC - PubMed
    1. Chen J., Liu Q. J., Wang D., Zhou X. Y., Xiong D., Li H. J., et al. (2014). Hepatoma upregulated protein expression is involved in the pathogenesis of human breast carcinogenesis. Oncol. Lett. 8, 2543–2548. 10.3892/ol.2014.2614 - DOI - PMC - PubMed
    1. Dudka D., Castrogiovanni C., Liaudet N., Vassal H., Meraldi P. (2019). Spindle-length-dependent HURP localization allows centrosomes to control kinetochore-fiber plus-end dynamics. Curr. Biol. 29, 3563–3578.e6. 10.1016/j.cub.2019.08.061 - DOI - PubMed