

Hidden Markov movement models reveal diverse seasonal movement patterns in two North American ungulates
- PMID: 37484933
- PMCID: PMC10361361
- DOI: 10.1002/ece3.10282
Hidden Markov movement models reveal diverse seasonal movement patterns in two North American ungulates
Abstract
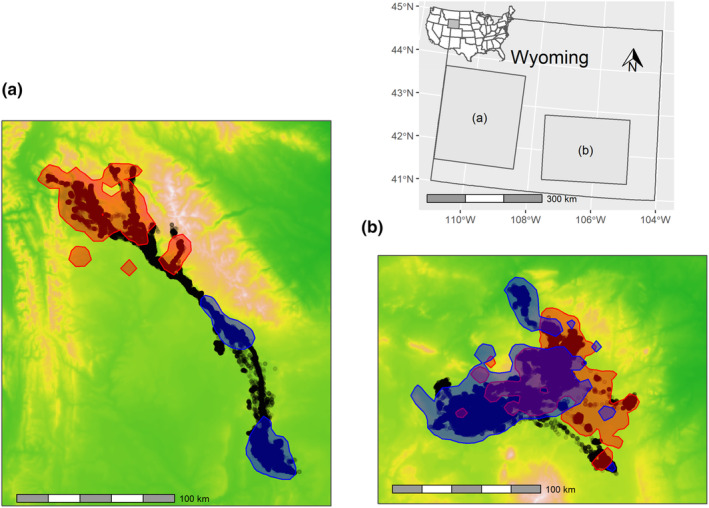
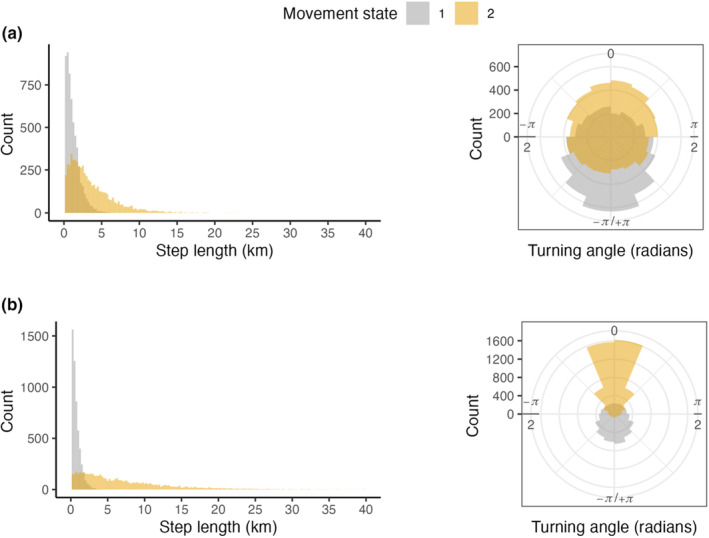
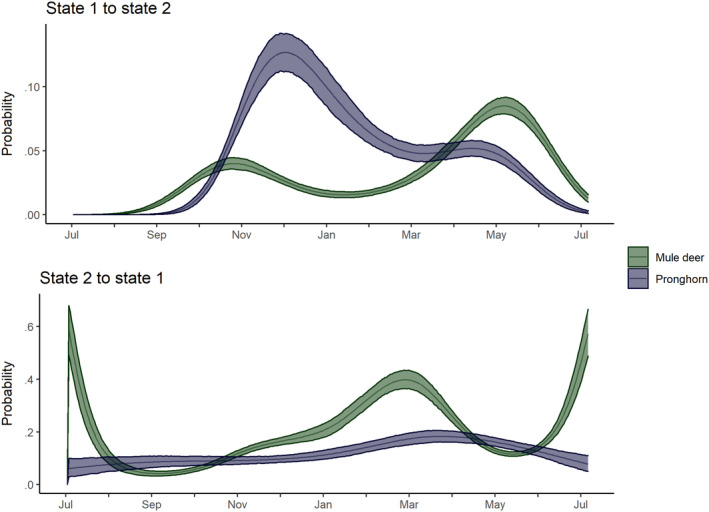
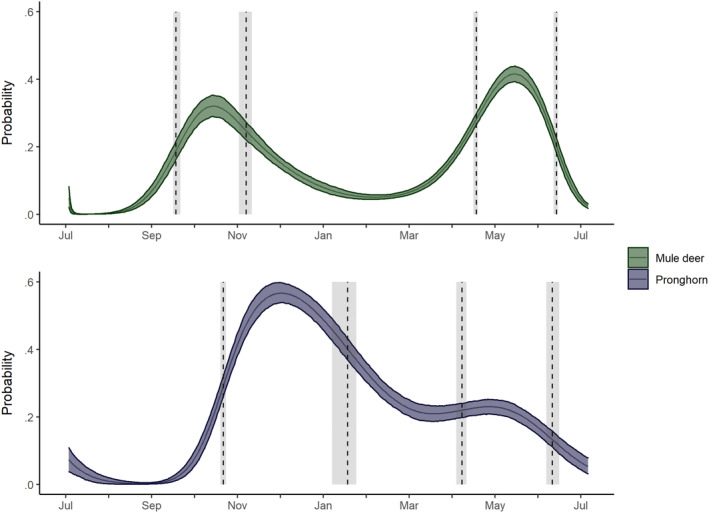
Animal movement is the mechanism connecting landscapes to fitness, and understanding variation in seasonal animal movements has benefited from the analysis and categorization of animal displacement. However, seasonal movement patterns can defy classification when movements are highly variable. Hidden Markov movement models (HMMs) are a class of latent-state models well-suited to modeling movement data. Here, we used HMMs to assess seasonal patterns of variation in the movement of pronghorn (Antilocapra americana), a species known for variable seasonal movements that challenge analytical approaches, while using a population of mule deer (Odocoileus hemionus), for whom seasonal movements are well-documented, as a comparison. We used population-level HMMs in a Bayesian framework to estimate a seasonal trend in the daily probability of transitioning between a short-distance local movement state and a long-distance movement state. The estimated seasonal patterns of movements in mule deer closely aligned with prior work based on indices of animal displacement: a short period of long-distance movements in the fall season and again in the spring, consistent with migrations to and from seasonal ranges. We found seasonal movement patterns for pronghorn were more variable, as a period of long-distance movements in the fall was followed by a winter period in which pronghorn were much more likely to further initiate and remain in a long-distance movement pattern compared with the movement patterns of mule deer. Overall, pronghorn were simply more likely to be in a long-distance movement pattern throughout the year. Hidden Markov movement models provide inference on seasonal movements similar to other methods, while providing a robust framework to understand movement patterns on shorter timescales and for more challenging movement patterns. Hidden Markov movement models can allow a rigorous assessment of the drivers of changes in movement patterns such as extreme weather events and land development, important for management and conservation.
Keywords: Hidden Markov movement model; migration; movement; mule deer; pronghorn.
© 2023 The Authors. Ecology and Evolution published by John Wiley & Sons Ltd. This article has been contributed to by U.S. Government employees and their work is in the public domain in the USA.
Conflict of interest statement
We declare no conflicts of interest.
Figures
References
-
- Aikens, E. O. , Monteith, K. L. , Merkle, J. A. , Dwinnell, S. P. H. , Fralick, G. L. , & Kauffman, M. J. (2020). Drought reshuffles plant phenology and reduces the foraging benefit of green‐wave surfing for a migratory ungulate. Global Change Biology, 26(8), 4215–4225. 10.1111/gcb.15169 - DOI - PubMed
-
- Alerstam, T. , Hedenström, A. , & Åkesson, S. (2003). Long‐distance migration: Evolution and determinants. Oikos, 103(2), 247–260. 10.1034/j.1600-0706.2003.12559.x - DOI
-
- Apollonio, M. , Belkin, V. V. , Borkowski, J. , Borodin, O. I. , Borowik, T. , Cagnacci, F. , Danilkin, A. A. , Danilov, P. I. , Faybich, A. , Ferretti, F. , Gaillard, J. M. , Hayward, M. , Heshtaut, P. , Heurich, M. , Hurynovich, A. , Kashtalyan, A. , Kerley, G. I. H. , Kjellander, P. , Kowalczyk, R. , … Yanuta, G. (2017). Challenges and science‐based implications for modern management and conservation of European ungulate populations. Mammal Research, 62(3), 209–217. 10.1007/s13364-017-0321-5 - DOI
-
- Beumer, L. T. , Pohle, J. , Schmidt, N. M. , Chimienti, M. , Desforges, J. P. , Hansen, L. H. , Langrock, R. , Pedersen, S. H. , Stelvig, M. , & van Beest, F. M. (2020). An application of upscaled optimal foraging theory using hidden Markov modelling: Year‐round behavioural variation in a large arctic herbivore. Movement ecology, 8, 1–6. - PMC - PubMed
-
- Bunnefeld, N. , Börger, L. , van Moorter, B. , Rolandsen, C. M. , Dettki, H. , Solberg, E. J. , & Ericsson, G. (2011). A model‐driven approach to quantify migration patterns: Individual, regional and yearly differences. Journal of Animal Ecology, 80(2), 466–476. 10.1111/j.1365-2656.2010.01776.x - DOI - PubMed
LinkOut - more resources
Full Text Sources
