. 2023 Jul;28(7):077001.
doi: 10.1117/1.JBO.28.7.077001. Epub 2023 Jul 22.

Dual-ratio approach for detection of point fluorophores in biological tissue

Affiliations

Dual-ratio approach for detection of point fluorophores in biological tissue

Giles Blaney et al. J Biomed Opt. 2023 Jul.

Abstract

Significance: Diffuse in vivo flow cytometry (DiFC) is an emerging fluorescence sensing method to non-invasively detect labeled circulating cells in vivo. However, due to signal-to-noise ratio (SNR) constraints largely attributed to background tissue autofluorescence (AF), DiFC's measurement depth is limited.

Aim: The dual ratio (DR)/dual slope is an optical measurement method that aims to suppress noise and enhance SNR to deep tissue regions. We aim to investigate the combination of DR and near-infrared (NIR) DiFC to improve circulating cells' maximum detectable depth and SNR.

Approach: Phantom experiments were used to estimate the key parameters in a diffuse fluorescence excitation and emission model. This model and parameters were implemented in Monte Carlo to simulate DR DiFC while varying noise and AF parameters to identify the advantages and limitations of the proposed technique.

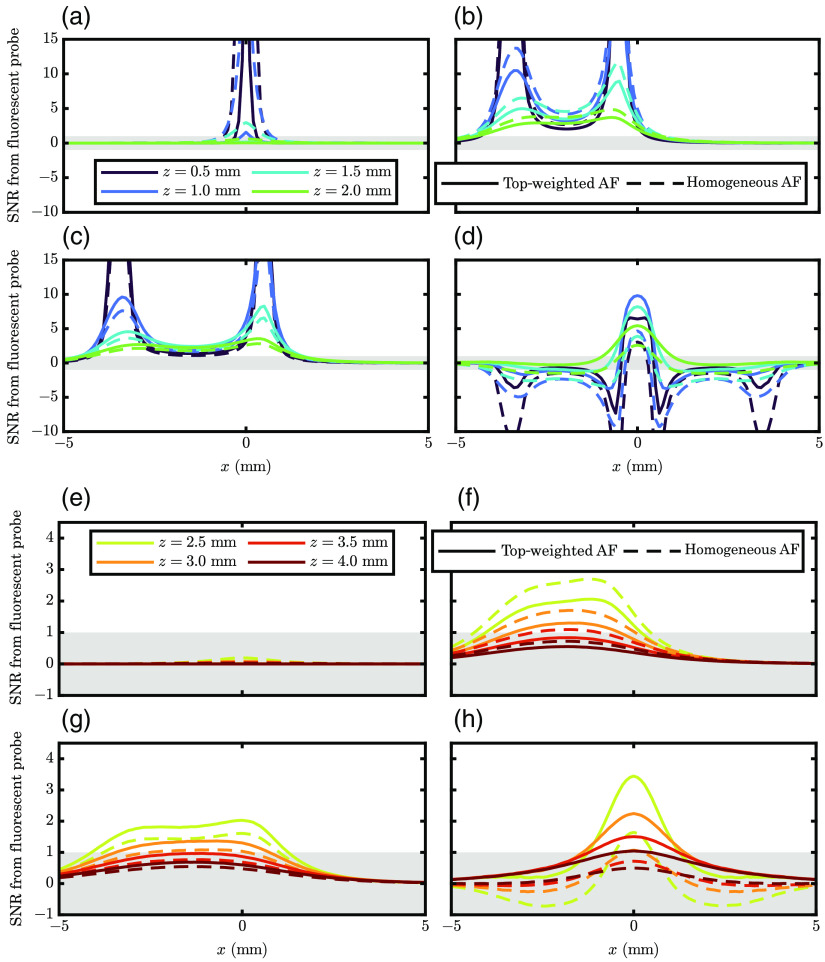
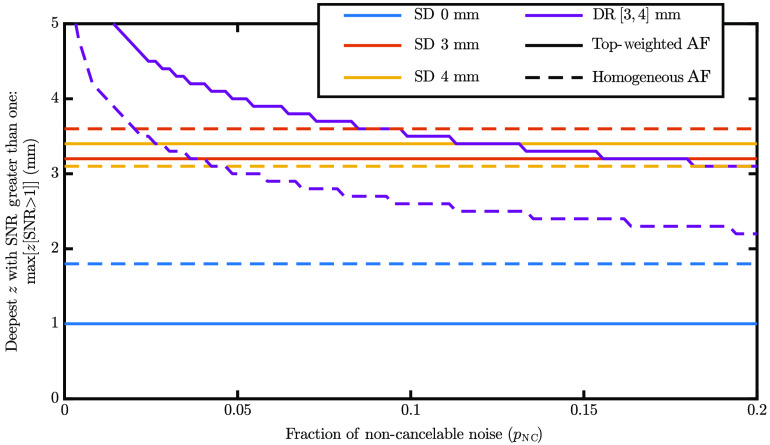
Results: Two key factors must be true to give DR DiFC an advantage over traditional DiFC: first, the fraction of noise that DR methods cannot cancel cannot be above the order of 10% for acceptable SNR. Second, DR DiFC has an advantage, in terms of SNR, if the distribution of tissue AF contributors is surface-weighted.

Conclusions: DR cancelable noise may be designed (e.g., through the use of source multiplexing), and indications point to the AF contributors' distribution being truly surface-weighted in vivo. Successful and worthwhile implementation of DR DiFC depends on these considerations, but results point to DR DiFC having possible advantages over traditional DiFC.

Keywords: Monte-Carlo methods; autofluorescence; dual ratio/dual slope; flow-cytometry; fluorescence; signal-to-noise ratio.


Figures

Fig. 1
Fig. 1
Conceptual application of DR DiFC. In principle, source and detector pairs could be arranged (a) perpendicular or (b) parallel to the underlying artery (in this case, the radial artery). (c) Use of two sources (1 and 2) and two detectors (A and B) would permit four source and detector pairs separated by a source–detector distance (ρ). (d) Photograph of NIR DiFC system on a diffusive flow phantom with fiber probes arranged perpendicular to the tubing direction. The dashed black line in (d) corresponds to the mid-plane shown in (c). The instrument permitted measurement with a single source and detector pair, in this case (2 and A). Background-subtracted sample DiFC data of fluorescent microspheres embedded (e) 0.75 mm deep and (f) 1.00 mm deep in a phantom with a flow channel.
Fig. 2
Fig. 2
Map of the SNR to a fluorescent target at a particular position (in the y=0  mm plane) within a medium with (a)–(d) surface-weighted or (e)–(h) homogeneous AF contributors for four different measurement types with detectors represented by blue arrows and sources by red arrows. (a), (e) SD at a source–detector distance (ρ) of 0 mm. (b), (f) SD at a ρ of 3 mm. (c), (g) SD at a ρ of 4 mm. (d), (h) DR containing ρ of 3 and 4 mm. Note: white regions represent SNR greater than the maximum color-bar scale (i.e., 11), and gray regions represent absolute SNR<1. Parameters: source = pencil, detector = 0.5 NA cone, voxel=0.1  mm×0.1  mm×0.1  mm, absorption coefficient (μa)=0.002  mm1, scattering coefficient (μs)=7  mm1, anisotropy factor (g)=0.9, index of refraction (n)=1.37, for (a)–(d) surface-weighted AF fluorescence efficiency (η)eln(0.5)z/0.1  mm for (e)–(h) homogeneous η constant, and signal and noise parameters found in Appendix C. (In this simulation, we assumed 5% NC noise.)
Fig. 3
Fig. 3
Traces of expected SNR from a fluorescent target flowing at a particular depth (color) beneath the source–detector arrangement (same as Figs. 1 and 2, y=0  mm). These results are shown for surface-weighted and homogeneous AF contributors (line-type). (a), (e) SD at a source–detector distance (ρ) of 0 mm; (b), (f) SD at a ρ of 3 mm. (c), (g) SD at a ρ of 4 mm; and (d), (h) DR containing ρ’s of 3 and 4 mm. Note: gray regions represent absolute SNR<1. Parameters: the same as Fig. 2 with assumed 5% NC noise.
Fig. 4
Fig. 4
Traces showing a comparison of experimental phantom data and expected results from the MC model. SD traces are normalized so that the mean peak maximum between panels (e) and (f) is one, meaning all subpanels utilize the same normalization factors. (a) Schematic of perpendicular flow case; (b), (c) comparison for perpendicular flow case; (d) schematic of parallel flow case; and (e), (f) comparison for parallel flow case. Note: shaded regions represent the noise level of the experimental data. Parameters: the same as Fig. 2 with a known of 1.5 mm and assumed fluorescent target velocity of 25  mms1.
Fig. 5
Fig. 5
SNR from a fluorescent target below the centroid of the optodes used for each measurement type as a function of depth (z). Colors show different measurement types, and line type shows the AF contributor distribution. Parameters: the same as Fig. 2 with assumed 5% NC noise.
Fig. 6
Fig. 6
The deepest fluorescent target that each data type can measure (SNR > 1) as a function of the fraction of NC (by DR) noise (pNC). Colors show the data type, and line type shows the distribution of AF contributors. Note: for a definition of see Sec. 7.2 or Eq. (2). Parameters: the same as Fig. 2.

Update of

References

    1. Tan X., et al. , “In vivo flow cytometry of extremely rare circulating cells,” Sci. Rep. 9, 3366 (2019). 10.1038/s41598-019-40143-2 - DOI - PMC - PubMed
    1. Patil R. A., et al. , “Fluorescence monitoring of rare circulating tumor cell and cluster dissemination in a multiple myeloma xenograft model in vivo,” J. Biomed. Opt. 24, 085004 (2019). 10.1117/1.JBO.24.8.085004 - DOI - PMC - PubMed
    1. Pace J., et al. , “Near-infrared diffuse in vivo flow cytometry,” J. Biomed. Opt. 27, 097002 (2022). 10.1117/1.JBO.27.9.097002 - DOI - PMC - PubMed
    1. Zettergren E. W., et al. , “Instrument for fluorescence sensing of circulating cells with diffuse light in mice in vivo,” J. Biomed. Opt. 17, 037001 (2012). 10.1117/1.JBO.17.3.037001 - DOI - PMC - PubMed
    1. Sassaroli A., Blaney G., Fantini S., “Dual-slope method for enhanced depth sensitivity in diffuse optical spectroscopy,” J. Opt. Soc. Am. A 36, 1743–1761 (2019). 10.1364/JOSAA.36.001743 - DOI - PMC - PubMed

Publication types