. 2023 Jun 19;26(7):107164.
doi: 10.1016/j.isci.2023.107164. eCollection 2023 Jul 21.

A hybrid physics-based and data-driven framework for cellular biological systems: Application to the morphogenesis of organoids

Affiliations

A hybrid physics-based and data-driven framework for cellular biological systems: Application to the morphogenesis of organoids

Daniel Camacho-Gomez et al. iScience. .

Abstract

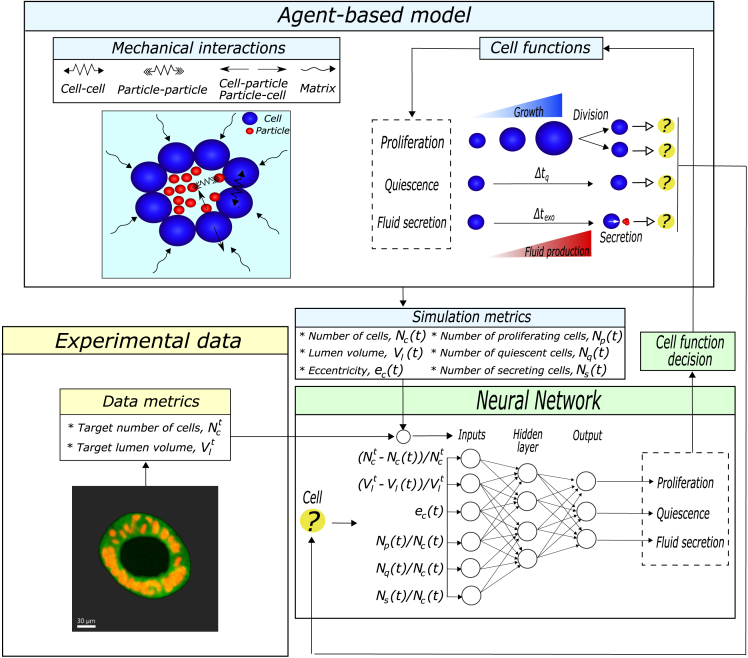
How cells orchestrate their cellular functions remains a crucial question to unravel how they organize in different patterns. We present a framework based on artificial intelligence to advance the understanding of how cell functions are coordinated spatially and temporally in biological systems. It consists of a hybrid physics-based model that integrates both mechanical interactions and cell functions with a data-driven model that regulates the cellular decision-making process through a deep learning algorithm trained on image data metrics. To illustrate our approach, we used data from 3D cultures of murine pancreatic ductal adenocarcinoma cells (PDAC) grown in Matrigel as tumor organoids. Our approach allowed us to find the underlying principles through which cells activate different cell processes to self-organize in different patterns according to the specific microenvironmental conditions. The framework proposed here expands the tools for simulating biological systems at the cellular level, providing a novel perspective to unravel morphogenetic patterns.

Keywords: Biocomputational method; Biological sciences; Biophysics; Developmental biology; Neural networks.


Conflict of interest statement

The authors declare no competing interests.

Figures

None
Graphical abstract
Figure 1
Figure 1
Framework of the hybrid physics-based and data-driven model (A) Schematic overview of the hybrid data-driven and physics-based algorithm. It consists of an agent-based model that incorporates mechanical interactions and cell biological functions. To orchestrate the cell functions within the simulation, the agent-based model employs a data-driven algorithm. Thus, to determine which function the cell has to perform, the agent-based model goes into the data-driven algorithm. The data-driven algorithm extracts from the desired morphogenetic pattern data metrics that characterize the pattern, which are introduced, together with simulation metrics, into the neural network as inputs. The neural network evaluates the inputs and determines the cell function that the cell must perform. This process is repeated until the simulation time of the agent-based model reaches (tsim). Finally, a fitness value is given to the simulation by comparing the simulated and desired morphogenetic patterns. (B) Schematic overview of the training algorithm of the neural network. The training starts with the creation of a random generation (Gen) composed of a population (Pop) of ten neural networks. Then, the physics-based algorithm performs a simulation with each neural network, following a similar methodology as (A). Finally, the genetic algorithm selects the two best populations based on their fitness and creates a new generation through crossover and mutation algorithms. The training is concluded when the number of generations reaches the specified number of generations (Genmax).
Figure 2
Figure 2
Particularization of the framework for organoids with lumen The physics-based model consists of an agent-based model that integrates mechanical interactions and cell functions. Cells are biological entities, and the particles simulate the lumen fluid. Three cell functions are considered: proliferation, quiescence, and fluid secretion. Δtq is the minimum period of time that a cell remains quiescent and Δtexo is the fluid production time.
Figure 3
Figure 3
Learning of the neural network The fitness value represented corresponds with the highest fitness of the population within the generation. Snapshots of the achieved organoid inserted in a cube with 100 μm sides featuring one population at generations 1, 100, 200, 300, and 400 are represented. The spheres represent the nuclei of cells with radius Rc/2 and the green hull is an estimation of the cell membrane through alpha shapes of the cells with α=2Rc. The lumen fluid is represented in black through the alpha shapes of particles with the smallest alpha that produces an alpha shape enclosing all of the particles.
Figure 4
Figure 4
Simulation of experimental pancreatic tumor organoids with lumen (A) Image of in vitro organoids and a slice view. Maximum Intensity Projection (MIP). Snapshots of the full view, a slice of the simulated organoids, and a slice of the simulated organoids with the lumen particles representation. The spheres represent the nuclei of cells with radius Rc/2 and the green hull is an estimation of the cell membrane through alpha shapes of the cells with α=2Rc. The lumen fluid is represented in black (fourth column) through the alpha shapes of particles with the smallest alpha that produces an alpha shape enclosing all of the particles. All scale bars are 30 μm. (B) Coordination of cell functions, in which blue represents proliferation, red represents secretion, green represents quiescence, and white represents an unborn cell. (C) Target number of cells (Nct) and the number of cells (Nc) in the 10 simulations for each organoid. (D) Target lumen volume (Vlt) and lumen volume (Vl) in the 10 simulations for each organoid. (E) Boxplot of the fitness value of the 10 simulations for each organoid.
Figure 5
Figure 5
Simulation of experimental solid tumor organoids (A) Image of in vitro organoids. Snapshots of the simulated organoids. The spheres represent the nuclei of cells with radius Rc/2 and the green hull is an estimation of the cell membrane through alpha shapes of the cells with α=2Rc. All scale bars are 30 μm. (B) Coordination of cell functions, in which blue represents proliferation and green represents quiescence.
Figure 6
Figure 6
Simulation of the evolution of solid organoids Snapshots at days 3, 5, and 7 of the temporal evolution of the solid organoids inserted in a cube of 200 μm side and the evolution of their number of cells. The spheres represent the full cell volume, and the green hull is an estimation of the cell membrane through alpha shapes of the cells with α=2Rc. (A) Organoid A. (B) Organoid B. (C) Organoid C.

References

    1. Lancaster M.A., Knoblich J.A. Organogenesis in a dish: modeling development and disease using organoid technologies. Science. 2014;345:1247125. doi: 10.1126/science.1247125. - DOI - PubMed
    1. Blutt S.E., Estes M.K. Organoid Models for Infectious Disease. Annu. Rev. Med. 2022;73:167–182. doi: 10.1146/annurev-med-042320-023055. - DOI - PMC - PubMed
    1. Sahu S., Sharan S.K. Translating embryogenesis to generate organoids: Novel approaches to personalized medicine. iScience. 2020;23:101485. - PMC - PubMed
    1. Dart A. Organoid diversity. Nat. Rev. Cancer. 2018;18:404–405. doi: 10.1038/s41568-018-0018-3. - DOI - PubMed
    1. Tuveson D., Clevers H. Cancer modeling meets human organoid technology. Science. 2019;364:952–955. doi: 10.1126/science.aaw6985. - DOI - PubMed

LinkOut - more resources