. 2023 Sep;33(5):e13196.
doi: 10.1111/bpa.13196. Epub 2023 Jul 24.

Alpha-synuclein fibrils amplified from multiple system atrophy and Parkinson's disease patient brain spread after intracerebral injection into mouse brain

Affiliations

Alpha-synuclein fibrils amplified from multiple system atrophy and Parkinson's disease patient brain spread after intracerebral injection into mouse brain

Shuyu Zhang et al. Brain Pathol. 2023 Sep.

Abstract

Parkinson's disease (PD), multiple system atrophy (MSA), and dementia with Lewy bodies (DLB) are neurodegenerative disorders with alpha-synuclein (α-syn) aggregation pathology. Different strains of α-syn with unique properties are suggested to cause distinct clinical and pathological manifestations resulting in PD, MSA, or DLB. To study individual α-syn spreading patterns, we injected α-syn fibrils amplified from brain homogenates of two MSA patients and two PD patients into the brains of C57BI6/J mice. Antibody staining against pS129-α-syn showed that α-syn fibrils amplified from the brain homogenates of the four different patients caused different levels of α-syn spreading. The strongest α-syn pathology was triggered by α-syn fibrils of one of the two MSA patients, followed by comparable pS129-α-syn induction by the second MSA and one PD patient material. Histological analysis using an antibody against Iba1 further showed that the formation of pS129-α-syn is associated with increased microglia activation. In contrast, no differences in dopaminergic neuron numbers or co-localization of α-syn in oligodendrocytes were observed between the different groups. Our data support the spreading of α-syn pathology in MSA, while at the same time pointing to spreading heterogeneity between different patients potentially driven by individual patient immanent factors.

Keywords: Parkinson's disease; alpha-synuclein; microglia; multiple system atrophy; patient-derived fibrils.


Conflict of interest statement

The authors declare no conflict of interests.

Figures

FIGURE 1
FIGURE 1
(A) Workflow of the study consisting of patient‐derived fibril injection, brain sectioning, immunohistochemical staining, microscopical imaging, image processing, and statistical analysis. (B) Immunohistochemistry: antibodies used for immunohistochemical analyses are indicated next to representative images. CNPase, 2′,3′‐cyclic nucleotide‐3′‐phosphodiesterase; dpi, days postinjection; GFAP, glial fibrillary acidic protein; TH, tyrosine hydroxylase.
FIGURE 2
FIGURE 2
Quantification of pS129‐positive α‐syn aggregates in mouse brains injected with different brain‐derived α‐syn strains. Area of pS129‐positive α‐syn aggregates per hemisphere area in the injected (A) and non‐injected (B) hemispheres. A p‐value <0.05 was considered as significant according to the Kruskal–Wallis test and Dunn's test.
FIGURE 3
FIGURE 3
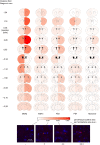
Heatmap showing the distribution of pS129‐positive α‐syn aggregates in the hemispheres of the five treatment groups (MSA2, MSA1, PD2, PD1, α‐syn monomer as control) and the 11 regions throughout the brain ranging from no aggregates (−) to highly abundant in aggregates (+++). Injection point at 0.38 mm relative to Bregma. MSA, multiple system atrophy; PD, Parkinson's disease; α‐syn, alpha‐synuclein.
FIGURE 4
FIGURE 4
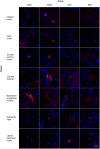
Exemplary images of pS129‐α‐syn aggregates in different brain regions.
FIGURE 5
FIGURE 5
Quantification of Iba1‐positive signal per region of interest (ROI) depending on treatment group for the injected (A) and the non‐injected (B) hemisphere, quantification by area of activated Iba1‐positive microglia divided by the total area of ROI. A p‐value <0.05 was considered as significant according to the Kruskal–Wallis test and Dunn's test.
FIGURE 6
FIGURE 6
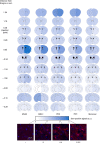
Heatmap showing the distribution of Iba1‐positive signal in the hemispheres of the five treatment groups (MSA2, MSA1, PD2, PD1, α‐syn monomer as control) and the 11 regions throughout the brain ranging from no Iba1‐positive signal (−) to strongest Iba1‐positive signal (+++). Injection point at 0.38 mm relative to Bregma. MSA, multiple system atrophy; PD, Parkinson's disease.
FIGURE 7
FIGURE 7
Quantification of CD68‐positive signal per region of interest (ROI) depending on treatment group for the injected (A) and the non‐injected (B) hemisphere, quantification by area of CD68‐positive microglia divided by the total area of ROI.
FIGURE 8
FIGURE 8
Spearman correlation between pS129‐α‐syn‐positive area per hemisphere in % and area [Iba1]/area [total hemisphere] shown for the injected (A) and non‐injected (B) hemispheres. Treatment groups are indicated by shape.
FIGURE 9
FIGURE 9
Violin plot for the thresholded M1 coefficient (fraction of pixels in the pS129‐α‐syn channel overlapping with those in the CNPase channel) in the MSA‐fibril‐ and PD‐fibril‐injected groups. CNPase, 2′,3′‐cyclic nucleotide‐3′‐phosphodiesterase; MSA, multiple system atrophy; PD, Parkinson's disease.
FIGURE 10
FIGURE 10
Quantification of GFAP‐positive signal per region of interest (ROI) depending on treatment group for the injected (A) and the non‐injected (B) hemisphere, quantification by area of GFAP‐positive astrocytes divided by the total area of ROI.

References

    1. Videnovic A. Management of sleep disorders in Parkinson's disease and multiple system atrophy. Mov Disord. 2017;32(5):659–668. - PMC - PubMed
    1. Papp MI, Lantos PL. The distribution of oligodendroglial inclusions in multiple system atrophy and its relevance to clinical symptomatology. Brain. 1994;117(Pt 2):235–243. - PubMed
    1. Polinski NK. A summary of phenotypes observed in the In vivo rodent alpha‐Synuclein preformed fibril model. J Parkinsons Dis. 2021;11(4):1555–1567. - PMC - PubMed
    1. Recasens A, Ulusoy A, Kahle PJ, Di Monte DA, Dehay B. In vivo models of alpha‐synuclein transmission and propagation. Cell Tissue Res. 2018;373(1):183–193. - PubMed
    1. Dauer Née Joppe K, Tatenhorst L, Caldi Gomes L, Zhang S, Parvaz M, Carboni E, et al. Brain iron enrichment attenuates α‐synuclein spreading after injection of preformed fibrils. J Neurochem. 2021;159(3):554–573. - PubMed

Publication types