Randomized Controlled Trial
. 2023 Nov;22(11):e13936.
doi: 10.1111/acel.13936. Epub 2023 Jul 24.

Disuse-induced muscle fibrosis, cellular senescence, and senescence-associated secretory phenotype in older adults are alleviated during re-ambulation with metformin pre-treatment

Affiliations
Randomized Controlled Trial

Disuse-induced muscle fibrosis, cellular senescence, and senescence-associated secretory phenotype in older adults are alleviated during re-ambulation with metformin pre-treatment

Jonathan J Petrocelli et al. Aging Cell. 2023 Nov.

Abstract

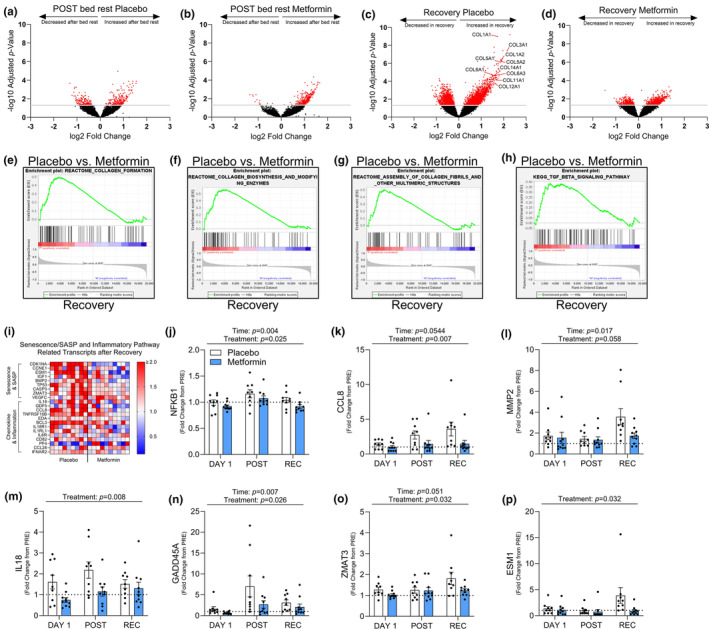
Muscle inflammation and fibrosis underlie disuse-related complications and may contribute to impaired muscle recovery in aging. Cellular senescence is an emerging link between inflammation, extracellular matrix (ECM) remodeling and poor muscle recovery after disuse. In rodents, metformin has been shown to prevent cellular senescence/senescent associated secretory phenotype (SASP), inflammation, and fibrosis making it a potentially practical therapeutic solution. Thus, the purpose of this study was to determine in older adults if metformin monotherapy during bed rest could reduce muscle fibrosis and cellular senescence/SASP during the re-ambulation period. A two-arm controlled trial was utilized in healthy male and female older adults (n = 20; BMI: <30, age: 60 years+) randomized into either placebo or metformin treatment during a two-week run-in and 5 days of bedrest followed by metformin withdrawal during 7 days of recovery. We found that metformin-treated individuals had less type-I myofiber atrophy during disuse, reduced pro-inflammatory transcriptional profiles, and lower muscle collagen deposition during recovery. Collagen content and myofiber size corresponded to reduced whole muscle cellular senescence and SASP markers. Moreover, metformin treatment reduced primary muscle resident fibro-adipogenic progenitors (FAPs) senescent markers and promoted a shift in fibroblast fate to be less myofibroblast-like. Together, these results suggest that metformin pre-treatment improved ECM remodeling after disuse in older adults by possibly altering cellular senescence and SASP in skeletal muscle and in FAPs.

Trial registration: ClinicalTrials.gov NCT03107884.

Keywords: SASP; aging; atrophy; collagen; fibrosis; inflammation; metformin; senescence.


Conflict of interest statement

The authors declare no conflicts of interest related to this study.

Figures

FIGURE 1
FIGURE 1
Experimental schematic. A muscle biopsy was taken prior to the beginning of any treatment (PRE) or intervention. Participants were then given placebo or metformin for 2 weeks and stopped taking their treatments 2 days before the start of bed rest. At the start of the first day of bed rest a muscle biopsy was taken (DAY 1), and participants began treatments again for the next 4 days of bed rest. On the 5th day of bed rest (POST), a muscle biopsy was taken, and participants stopped their treatments the night before and did not continue on their treatments for the remainder of the study. After a 1‐week recovery period (REC) participants returned and underwent another muscle biopsy.
FIGURE 2
FIGURE 2
Metformin prevented myofiber cross‐sectional area reduction after bed rest. (a) Representative image used to determine myofiber type specific CSA. (b, c) Frequency distribution of myosin heavy chain I (MyHC I) PRE and POST. (d) POST delta (Δ) from PRE‐intervention percent fiber frequency of MyHC I myofiber cross‐sectional area (CSA) from 250 to 10,000 μm2. (e) Representative MRI image used to determine thigh muscle volume. (f) Correlation of the change in thigh muscle volume (mm3) after bed rest to the change in MyHC I myofiber CSA (μm2) after bed rest. (g) Correlation of the change in thigh muscle volume (mm3) after bed rest to the change in mean myofiber CSA (μm2) after bed rest. *p < 0.05. N = 7–10/group. Scale bar is 50 μm. Myofiber counts as mean ± SE: Placebo PRE: 555 ± 96, POST: 550 ± 53. Metformin PRE: 492 ± 68, POST: 435 ± 55.
FIGURE 3
FIGURE 3
Macrophage content increased after bed rest and during recovery. (a) After bed rest representative image used to identify CD11b+ and CD206+ cells. (b) CD11b+ and CD206+ (anti‐inflammatory‐like) cells after bed rest. (c) CD11b+ and CD206 (pro‐inflammatory‐like) cells after bed rest. (d) All labeled cells (total macrophages) after bed rest. (e) After recovery representative image used to identify CD11b+ and CD206+. (f) CD11b+ and CD206+ cells after recovery. (g) CD11b+ and CD206 cells after recovery. (h) All labeled cells after recovery. N = 7–10/group. Scale bar is 50 μm.
FIGURE 4
FIGURE 4
Metformin reduced collagen deposition and improved collagen remodeling. (a) Representative images of Sirius Red staining after recovery. (b) Sirius Red percent area after recovery. (c) Correlation of CD11b+ CD206 cells after bed rest to Sirius Red percent area after recovery. (d) Correlation of CD11b+ CD206 cells after recovery to Sirius Red percent area after recovery. (e) Representative images of Sirius Red after polarized light exposure after recovery. (f–h) Tightly, intermediately, and loosely packed collagen content after recovery. (i) Percent organization of tight, intermediate, and loose packed collagen. (j) Representative image of second harmonic generation imaging after recovery. (k) Collagen fibril deviation degree after recovery. (l) Representative images of biotinylated‐hybridizing peptide (B‐CHP), collagen I, and merged images after recovery. (m) Ratio of B‐CHP/Collagen I ratio after recovery, as a surrogate marker for collagen turnover. (n) Representative image used to identify Tcf4+ cells. (o) Correlation of Tcf4+ cells after recovery to Sirius Red % area after recovery. N = 8–10/group. Scale bars are 50 μm.
FIGURE 5
FIGURE 5
Collagen transcriptional profiles and cellular senescence driving transcripts are reduced with metformin. After bed rest volcano plot displaying significantly up and downregulated transcripts in red with placebo (a) or metformin (b). After recovery volcano plot displaying significantly up and downregulated transcripts in red with placebo (c) or metformin (d), with collagen gene family members highlighted. (e–h) GSEA enrichment plots for Collagen Formation, Collagen Biosynthesis, and Modifying Enzymes, Assembly of Collagen Fibrils and Other Multimeric Structures, and TGF‐β Signaling pathways after recovery in placebo versus metformin (i) Heat map of senescence/SASP and inflammatory related transcripts after recovery as a fold change from PRE. (j–p) Transcriptional changes of cellular senescence driving transcripts as a fold change from PRE, at DAY1, POST, and REC. Log10 Adjusted p‐value of 1.3 (p < 0.05) was used to determine significance for volcano plots. N = 9–10/group.
FIGURE 6
FIGURE 6
Metformin decreased markers of cellular senescence in whole muscle and muscle resident fibro‐adipogenic progenitors (FAPs). CDK1NA (p21) transcription as a fold change from PRE, after bed rest (a) and after recovery (b). TP53 (p53) transcription as a fold change from PRE, after bed rest (c) and after recovery (d). (e) Correlation of mean myofiber area after bed rest to the fold change in p21 transcription after bed rest. (f) Correlation of Sirius Red percent area after recovery to the fold change in p21 transcription after recovery. (g) Representative images of senescent associated (SA)‐β‐galactosidase+ muscle resident FAPs after recovery. Percent SA‐β‐galactosidase+ muscle resident FAPs after bed rest (h) and after recovery (i). (j) CDKN2A (p16) gene expression in muscle resident FAPs. (k) Correlation of SA‐β‐galactosidase+ to the change in Sirius Red percent area after bed rest and (l) recovery. (m) Representative image of after bed rest α‐smooth muscle Actin (α‐SMA) and TCF4+ cells. (n) Percent α‐SMA and TCF4+ cells after bed rest. (o) Representative image of after bed rest BODIPY (lipid droplets) staining. (p) Percent lipid droplets after bed rest. ***p < 0.001, **p < 0.01, *p < 0.05. N = 9–10/group for transcriptional data. N = 4–5/group for muscle resident FAP analysis. Scale bar is 50 μm for SA‐β‐galactosidase, 100 μm for α‐SMA, and 25 μm for BODIPY stained images.

References

    1. Aagaard, P. , Suetta, C. , Caserotti, P. , Magnusson, S. P. , & Kjaer, M. (2010). Role of the nervous system in sarcopenia and muscle atrophy with aging: Strength training as a countermeasure. Scandinavian Journal of Medicine & Science in Sports, 20(1), 49–64. - PubMed
    1. Abramowitz, M. K. , Paredes, W. , Zhang, K. , Brightwell, C. R. , Newsom, J. N. , Kwon, H. J. , Custodio, M. , Buttar, R. S. , Farooq, H. , Zaidi, B. , Pai, R. , Pessin, J. E. , Hawkins, M. , & Fry, C. S. (2018). Skeletal muscle fibrosis is associated with decreased muscle inflammation and weakness in patients with chronic kidney disease. American Journal of Physiology. Renal Physiology, 315(6), F1658–F1669. - PMC - PubMed
    1. Arnold, L. , Henry, A. , Poron, F.¸. , Baba‐Amer, Y. , van Rooijen, N. , Plonquet, A. , Gherardi, R. K. , & Chazaud, B. (2007). Inflammatory monocytes recruited after skeletal muscle injury switch into antiinflammatory macrophages to support myogenesis. The Journal of Experimental Medicine, 204(5), 1057–1069. - PMC - PubMed
    1. Brashear, S. E. , Wohlgemuth, R. P. , Hu, L. Y. , Jbeily, E. H. , Christiansen, B. A. , & Smith, L. R. (2022). Collagen cross‐links scale with passive stiffness in dystrophic mouse muscles, but are not altered with administration of a lysyl oxidase inhibitor. PLoS One, 17(10), e0271776. - PMC - PubMed
    1. Cameron, A. R. , Morrison, V. L. , Levin, D. , Mohan, M. , Forteath, C. , Beall, C. , McNeilly, A. D. , Balfour, D. J. K. , Savinko, T. , Wong, A. K. F. , Viollet, B. , Sakamoto, K. , Fagerholm, S. C. , Foretz, M. , Lang, C. C. , & Rena, G. (2016). Anti‐inflammatory effects of metformin irrespective of diabetes status. Circulation Research, 119(5), 652–665. - PMC - PubMed

Publication types

Associated data