. 2023 Aug 17;11(4):e0342922.
doi: 10.1128/spectrum.03429-22. Epub 2023 Jul 24.

The Vaginal Microbiota of Pregnant Women Varies with Gestational Age, Maternal Age, and Parity

Affiliations

The Vaginal Microbiota of Pregnant Women Varies with Gestational Age, Maternal Age, and Parity

Roberto Romero et al. Microbiol Spectr. .

Abstract

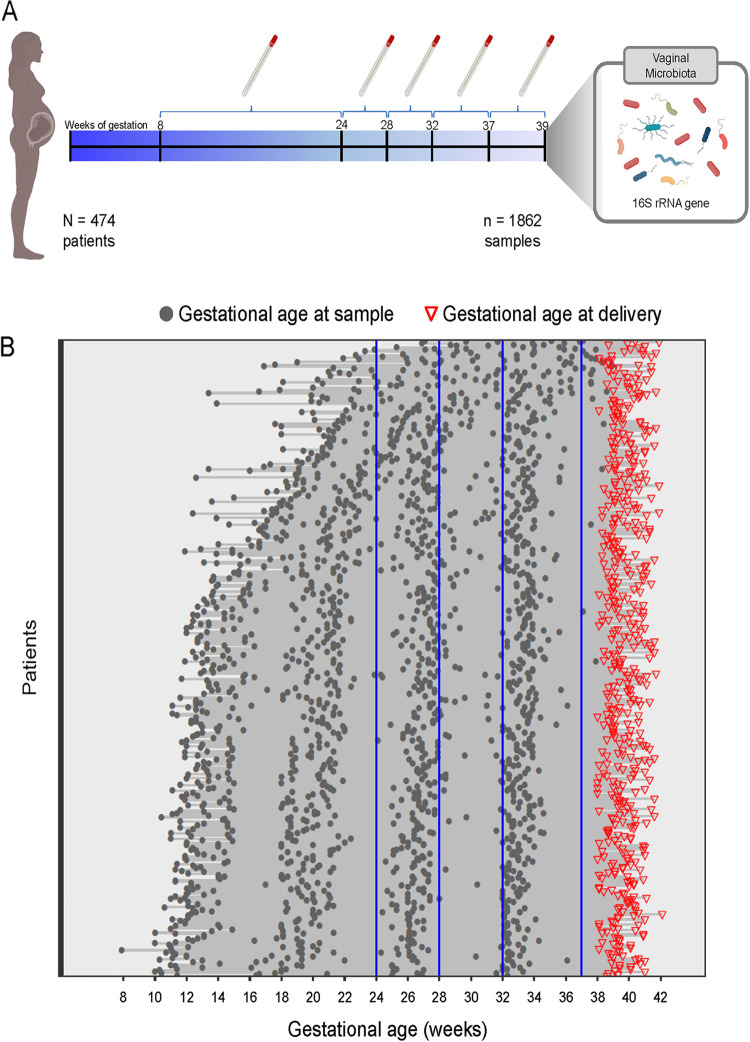
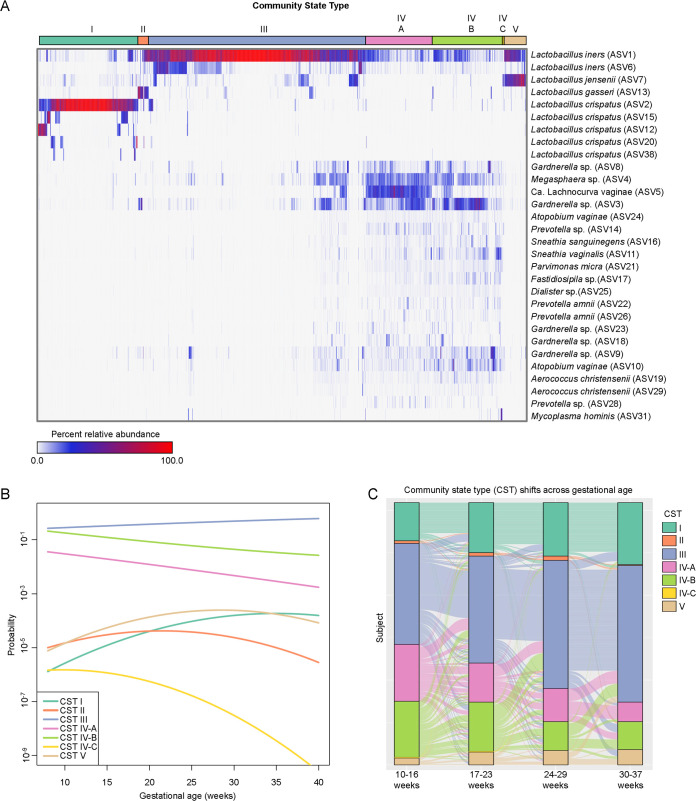
The composition of the vaginal microbiota is heavily influenced by pregnancy and may factor into pregnancy complications, including spontaneous preterm birth. However, results among studies have been inconsistent due, in part, to variation in sample sizes and ethnicity. Thus, an association between the vaginal microbiota and preterm labor continues to be debated. Yet, before assessing associations between the composition of the vaginal microbiota and preterm labor, a robust and in-depth characterization of the vaginal microbiota throughout pregnancy in the specific study population under investigation is required. Here, we report a large longitudinal study (n = 474 women, 1,862 vaginal samples) of a predominantly African-American cohort-a population that experiences a relatively high rate of pregnancy complications-evaluating associations between individual identity, gestational age, and other maternal characteristics with the composition of the vaginal microbiota throughout gestation resulting in term delivery. The principal factors influencing the composition of the vaginal microbiota in pregnancy are individual identity and gestational age at sampling. Other factors are maternal age, parity, obesity, and self-reported Cannabis use. The general pattern across gestation is for the vaginal microbiota to remain or transition to a state of Lactobacillus dominance. This pattern can be modified by maternal parity and obesity. Regardless, network analyses reveal dynamic associations among specific bacterial taxa within the vaginal ecosystem, which shift throughout the course of pregnancy. This study provides a robust foundational understanding of the vaginal microbiota in pregnancy and sets the stage for further investigation of this microbiota in obstetrical disease. IMPORTANCE There is debate regarding links between the vaginal microbiota and pregnancy complications, especially spontaneous preterm birth. Inconsistencies in results among studies are likely due to differences in sample sizes and cohort ethnicity. Ethnicity is a complicating factor because, although all bacterial taxa commonly inhabiting the vagina are present among all ethnicities, the frequencies of these taxa vary among ethnicities. Therefore, an in-depth characterization of the vaginal microbiota throughout pregnancy in the specific study population under investigation is required prior to evaluating associations between the vaginal microbiota and obstetrical disease. This initial investigation is a large longitudinal study of the vaginal microbiota throughout gestation resulting in a term delivery in a predominantly African-American cohort, a population that experiences disproportionally negative maternal-fetal health outcomes. It establishes the magnitude of associations between maternal characteristics, such as age, parity, body mass index, and self-reported Cannabis use, on the vaginal microbiota in pregnancy.

Keywords: Cannabis; Gardnerella; Lactobacillus; gestation; microbiome; obesity; term gestation.


Conflict of interest statement

The authors declare no conflict of interest.

Figures

FIG 1
FIG 1
Gestational ages at the time of vaginal fluid sample collection in a cohort of women ultimately delivering at term. (A) A total of 1,862 vaginal fluid samples were collected from 474 pregnant women between 8 and 38+6 weeks of gestation. The vaginal microbiota was profiled using 16S rRNA gene sequencing. (B) Each line corresponds to one patient, and each dot corresponds to a sample for which the vaginal microbiota was characterized. Gestational ages at delivery are indicated by red triangles.
FIG 2
FIG 2
Decrease in alpha diversity of the vaginal microbiota with gestational age in women ultimately delivering at term. Graphical representation of low and high bacterial community richness (A) and evenness (B). Linear mixed-effects models illustrating decreases of bacterial community richness (C) and richness coupled with evenness (D) over the course of gestation. Each dot corresponds to one sample. The red line represents the linear fit using linear mixed-effects models. The dark blue line represents the model fit, and light blue areas define the 95% confidence intervals derived from generalized additive models with splines transformation of gestational age at sampling.
FIG 3
FIG 3
The rate of decrease in the alpha diversity (Shannon diversity index) of the vaginal microbiota with gestational age is steeper in women with higher baseline diversity. (Left) The baseline diversity for each patient (blue dots) and corresponding 95% confidence intervals (black lines). (Right) The rate of change in diversity (blue dots) and confidence intervals (black lines). Women who had higher baseline diversity had a steeper decrease in diversity with advancing gestation (correlation between random intercepts and random slopes of −0.79).
FIG 4
FIG 4
Variation in the community state type (CST) of the vaginal microbiota throughout gestation among women who ultimately delivered at term. (A) Heatmap illustrating the relative abundances of the 30 most abundant amplicon sequence variants (ASVs) among the vaginal 16S rRNA gene profiles. The bar on top indicates vaginal CSTs assigned using the program VALENCIA (11). (B) Dynamics of vaginal CST prevalence as a function of gestational age among women ultimately delivering at term. The log-odds of membership for each CST were modeled using binomial linear-mixed effects models. Fixed effects in these models included gestational age (linear and quadratic terms, as needed) and maternal characteristics, while one random intercept was allowed for each subject. (C) Alluvial plot illustrating the temporal dynamics of vaginal CST prevalence and transitions among 309 women who delivered at term and contributed one sample per each of the four discrete time periods (10 to 37 weeks).
FIG 5
FIG 5
Changes in the relative abundance of amplicon sequence variants (ASVs) in vaginal 16S rRNA gene profiles across gestational age in women who ultimately delivered at term. Only the first ASV for each microbial taxon with a significant corrected P value (q < 0.05) presented in Table S1 is shown. Panels with positive correlations are ordered before those with negative correlations. Each dot within an individual panel corresponds to one sample. The red lines represent linear fits through relative abundance data using linear mixed-effects models. The blue lines and gray bands represent the model fits and 95% confidence intervals derived from generalized additive models, respectively. The green lines represent the estimates from negative binomial mixed-effects generalized additive models.
FIG 6
FIG 6
Amplicon sequence variants (ASVs) classified at the genus level identified as less or more abundant in the vaginal microbiota with advancing gestational age. As gestation advances, Lactobacillus, and to a lesser extent Ca. Lachnocurva, ASVs become more abundant and many members of community state type (CST) IV become less abundant.
FIG 7
FIG 7
Positive correlations of relative abundances of vaginal microbial taxa. Alluvial plot shows pairs of vaginal bacterial taxa with highly correlated relative abundances throughout gestation. Relative abundances of amplicon sequence variants (ASVs) were compared using linear mixed-effects models. Connecting alluvia were scaled to the magnitude of the correlation between ASVs.
FIG 8
FIG 8
Network analysis illustrating changes in associations between amplicon sequence variants (ASVs) throughout pregnancy. Networks at 10 to 24 weeks (A), 24 to 28 weeks (B), 28 to 32 weeks (C), and 32 to 37 weeks of gestation (D) were generated by using the NetCoMi package (151). Nodes, which represented individual amplicon sequence variants (ASVs), were color coded according to their respective genus-level classification and were scaled based on the center-log-ratio normalized sum of their counts across samples included in the network analysis. Edges were weighted by strength using fitness and were color coded by interaction type with positive (blue) and negative (red) interactions. Nodes that represent hubs, defined as an ASV with an eigenvector above the 95% quantile of the empirical distribution, are outlined in black and are in bold font. Clusters are represented by background coloration and darker borders. (E) A matrix of comparative network statistics with positive edge percentage above the diagonal and natural connectivity below the diagonal. Cells shaded red and cells shaded blue represent statistically significant differences (after false discovery rate correction) between time periods for positive edge percentage and natural connectivity, respectively. Differences were assessed by a one-tailed test of the observed difference compared to a nonparametric permuted sampling distribution of the corresponding measure (n = 1,000).

Similar articles

Cited by

References

    1. Zhou X, Bent SJ, Schneider MG, Davis CC, Islam MR, Forney LJ. 2004. Characterization of vaginal microbial communities in adult healthy women using cultivation-independent methods. Microbiology (Reading) 150:2565–2573. doi:10.1099/mic.0.26905-0. - DOI - PubMed
    1. Zhou X, Brown CJ, Abdo Z, Davis CC, Hansmann MA, Joyce P, Foster JA, Forney LJ. 2007. Differences in the composition of vaginal microbial communities found in healthy Caucasian and black women. ISME J 1:121–133. doi:10.1038/ismej.2007.12. - DOI - PubMed
    1. Zhou X, Hansmann MA, Davis CC, Suzuki H, Brown CJ, Schutte U, Pierson JD, Forney LJ. 2010. The vaginal bacterial communities of Japanese women resemble those of women in other racial groups. FEMS Immunol Med Microbiol 58:169–181. doi:10.1111/j.1574-695X.2009.00618.x. - DOI - PMC - PubMed
    1. Ravel J, Gajer P, Abdo Z, Schneider GM, Koenig SS, McCulle SL, Karlebach S, Gorle R, Russell J, Tacket CO, Brotman RM, Davis CC, Ault K, Peralta L, Forney LJ. 2011. Vaginal microbiome of reproductive-age women. Proc Natl Acad Sci USA 108:4680–4687. doi:10.1073/pnas.1002611107. - DOI - PMC - PubMed
    1. Gajer P, Brotman RM, Bai G, Sakamoto J, Schutte UM, Zhong X, Koenig SS, Fu L, Ma ZS, Zhou X, Abdo Z, Forney LJ, Ravel J. 2012. Temporal dynamics of the human vaginal microbiota. Sci Transl Med 4:132ra52. doi:10.1126/scitranslmed.3003605. - DOI - PMC - PubMed

Publication types