. 2023 Aug 31;14(4):e0131323.
doi: 10.1128/mbio.01313-23. Epub 2023 Jul 24.

A combined microscopy and single-cell sequencing approach reveals the ecology, morphology, and phylogeny of uncultured lineages of zoosporic fungi

Affiliations

A combined microscopy and single-cell sequencing approach reveals the ecology, morphology, and phylogeny of uncultured lineages of zoosporic fungi

Kensuke Seto et al. mBio. .

Abstract

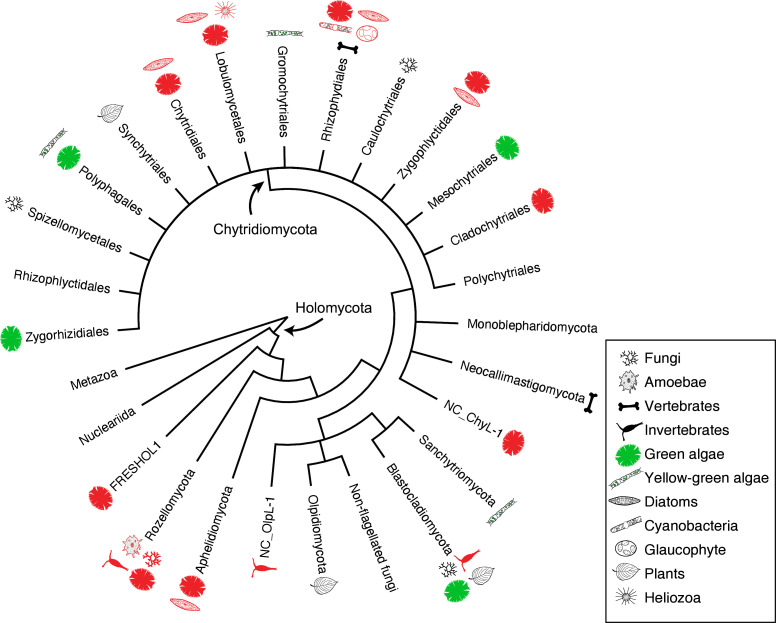
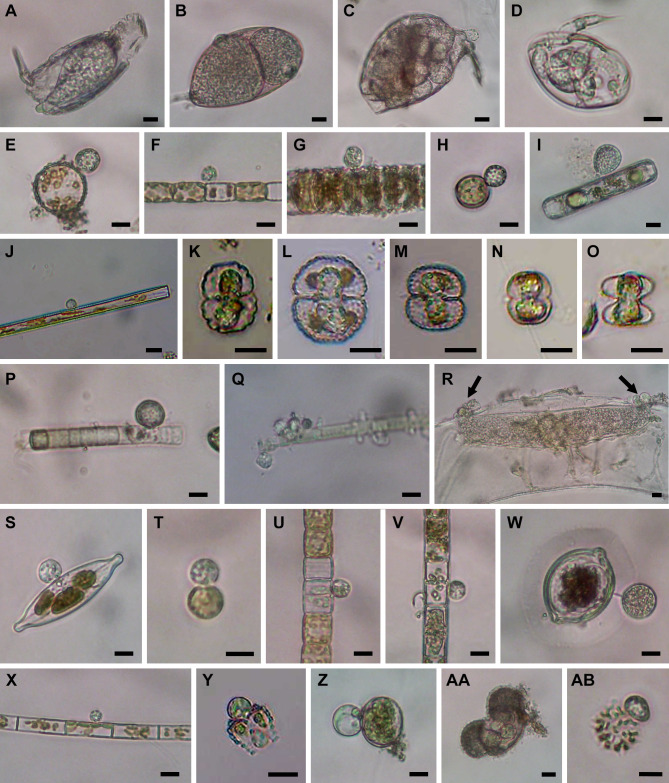
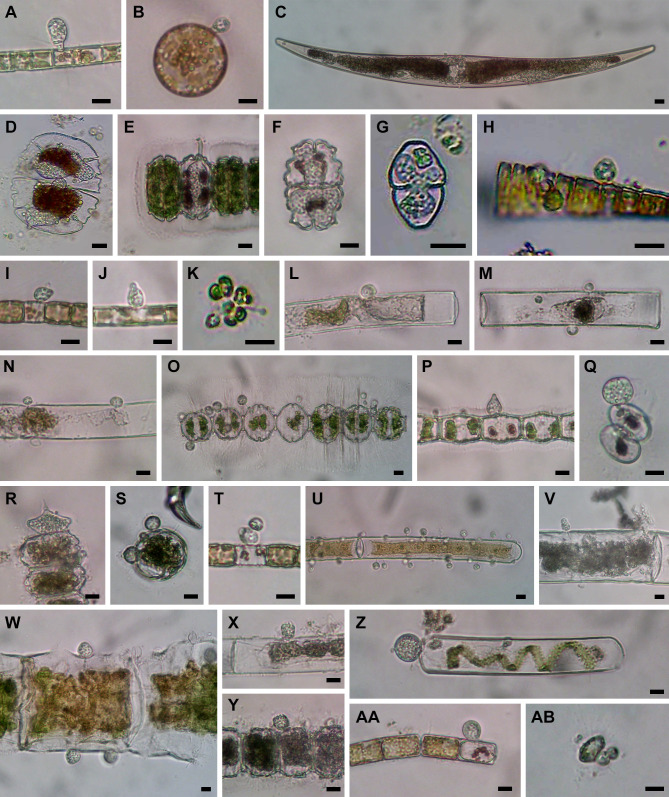
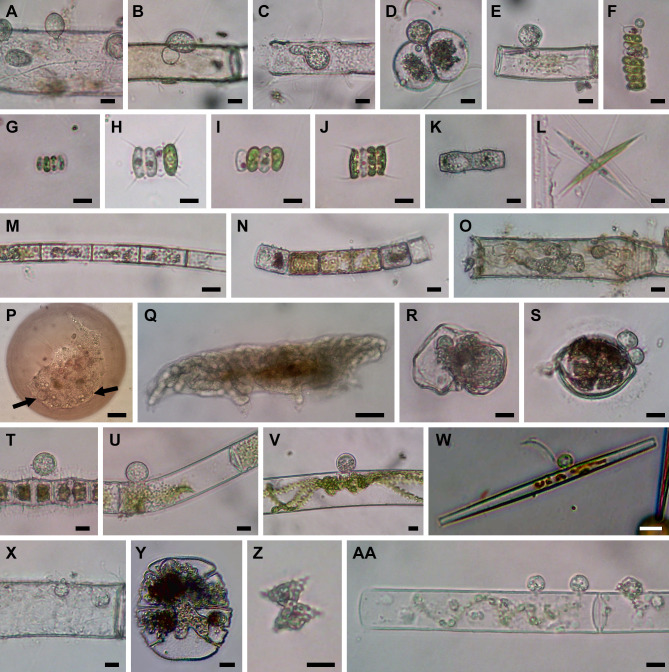
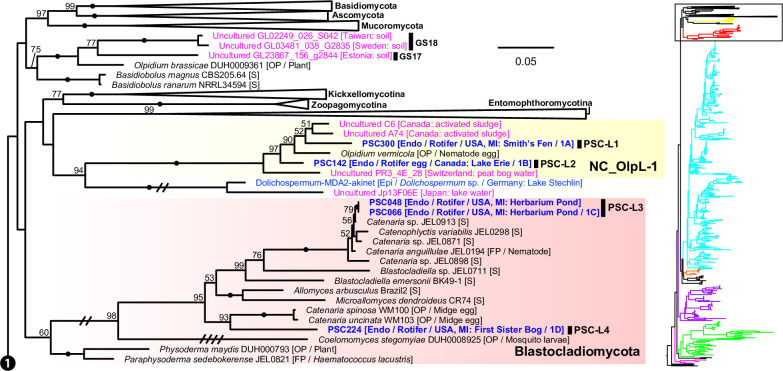
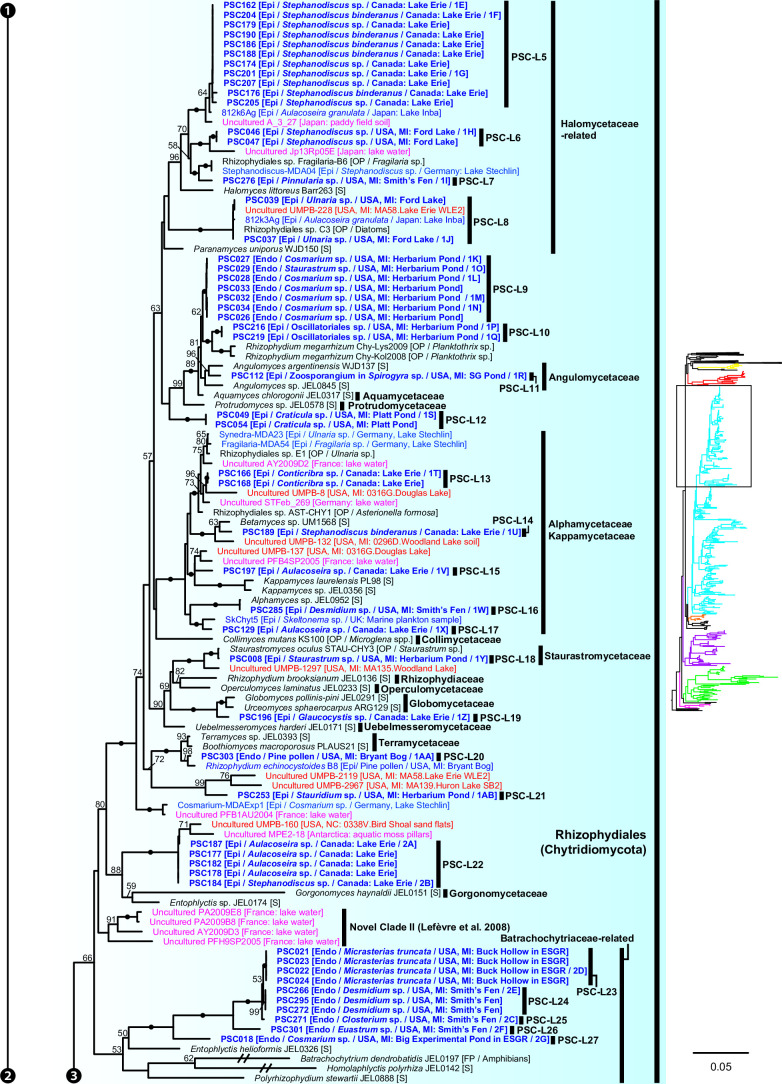
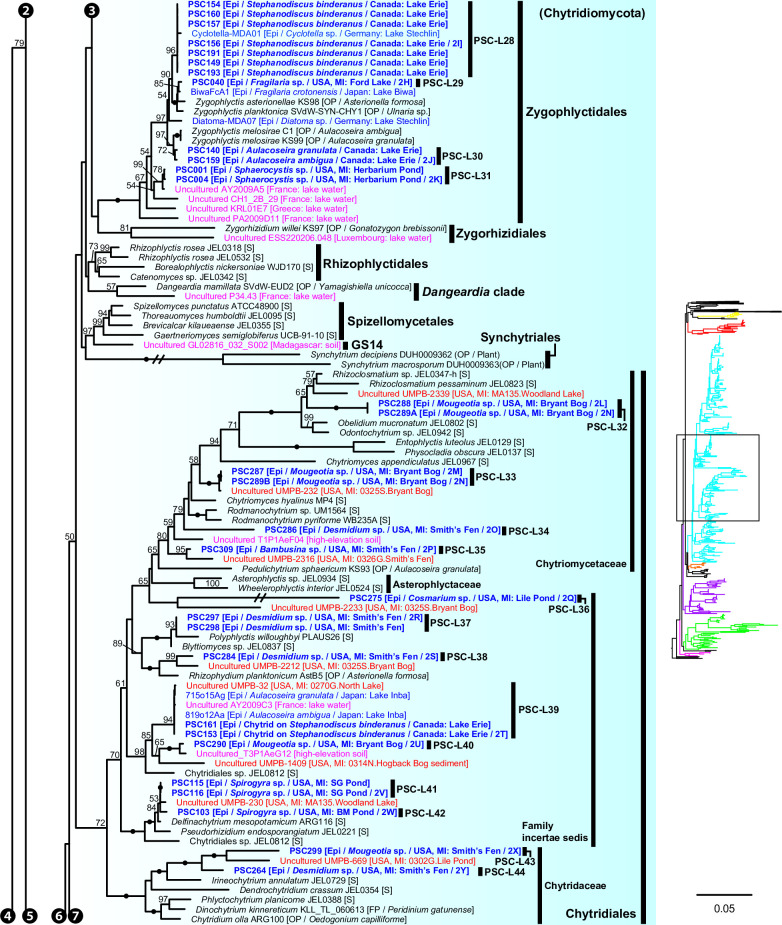
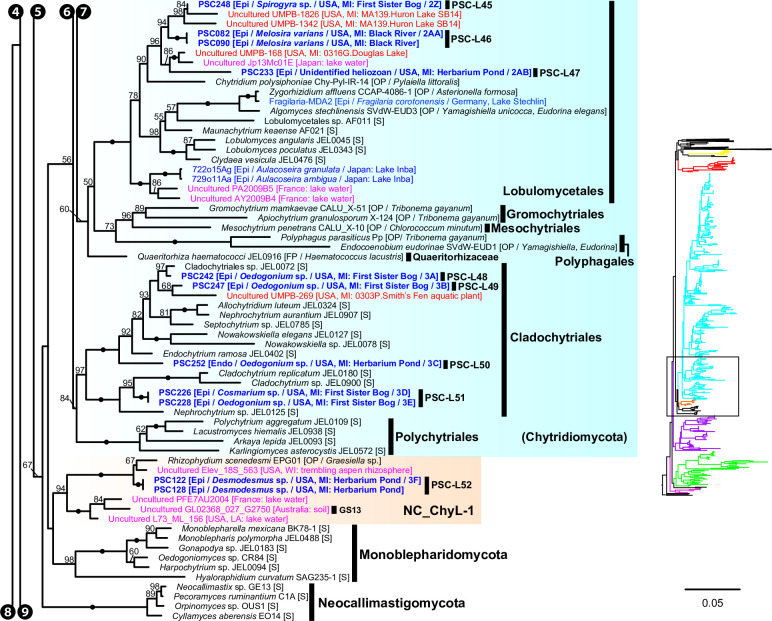
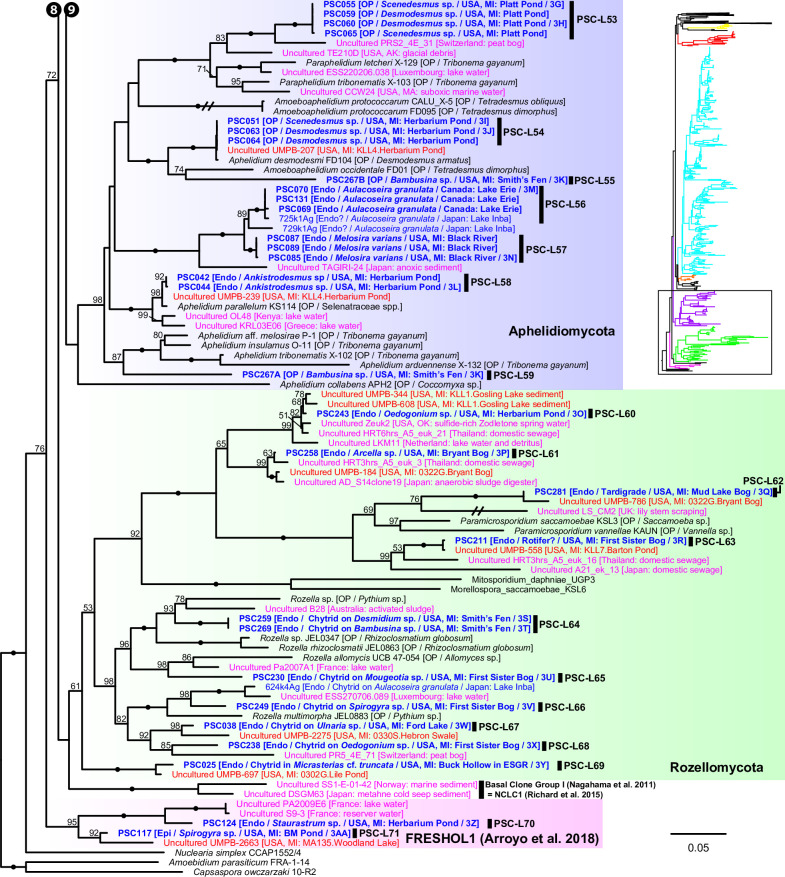
Environmental DNA analyses of fungal communities typically reveal a much larger diversity than can be ascribed to known species. Much of this hidden diversity lies within undescribed fungal lineages, especially the early diverging fungi (EDF). Although these EDF often represent new lineages even at the phylum level, they have never been cultured, making their morphology and ecology uncertain. One of the methods to characterize these uncultured fungi is a single-cell DNA sequencing approach. In this study, we established a large data set of single-cell sequences of EDF by manually isolating and photographing parasitic fungi on various hosts such as algae, protists, and micro-invertebrates, combined with subsequent long-read sequencing of the ribosomal DNA locus (rDNA). We successfully obtained rDNA sequences of 127 parasitic fungal cells, which clustered into 71 phylogenetic lineages belonging to seven phylum-level clades of EDF: Blastocladiomycota, Chytridiomycota, Aphelidiomycota, Rozellomycota, and three unknown phylum-level clades. Most of our single cells yielded novel sequences distinguished from both described taxa and existing metabarcoding data, indicating an expansive and hidden diversity of parasitic taxa of EDF. We also revealed an unexpected diversity of endobiotic Olpidium-like chytrids and hyper-parasitic lineages. Overall, by combining photographs of parasitic fungi with phylogenetic analyses, we were able to better understand the ecological function and morphology of many of the branches on the fungal tree of life known only from DNA sequences. IMPORTANCE Much of the diversity of microbes from natural habitats, such as soil and freshwater, comprise species and lineages that have never been isolated into pure culture. In part, this stems from a bias of culturing in favor of saprotrophic microbes over the myriad symbiotic ones that include parasitic and mutualistic relationships with other taxa. In the present study, we aimed to shed light on the ecological function and morphology of the many undescribed lineages of aquatic fungi by individually isolating and sequencing molecular barcodes from 127 cells of host-associated fungi using single-cell sequencing. By adding these sequences and their photographs into the fungal tree, we were able to understand the morphology of reproductive and vegetative structures of these novel fungi and to provide a hypothesized ecological function for them. These individual host-fungal cells revealed themselves to be complex environments despite their small size; numerous samples were hyper-parasitized with other zoosporic fungal lineages such as Rozellomycota.

Keywords: early diverging fungi; parasite; phylogeny; single-cell analysis.


Conflict of interest statement

The authors declare no conflict of interest.

Figures

Fig 1
Fig 1
Schematic tree showing the phylogenetic relationships among the early diverging fungal phyla and orders in Chytridiomycota and their host range. Illustrations of each lineage indicate hosts of parasitic taxa. Red colored illustrations indicate hosts of single cells isolated in this study.
Fig 2
Fig 2
Microscopic images of isolated cells. (A) Olpidium-like chytrid PSC-L1 in rotifer. (B) Olpidium-like chytrid PSC-L2 in rotifer egg. (C) Olpidium-like chytrid PSC-L3 in rotifer. (D) Olpidium-like chytrid PSC-L4 in rotifer. (E–G) Chytrids PSC-L5 on Stephanodiscus spp. (E and G) and Stephanodiscus binderanus (F). (H) Chytrid PSC-L6 on Stephanodiscus sp. (I) Chytrid PSC-L7 on Pinnularia sp. (J) Chytrid PSC-L8 on Ulnaria sp. (K–O) Olpidium-like chytrids PSC-L9 in Cosmarium spp. (K–N) and Staurastrum sp. (O). (P and Q) Chytrid PSC-L10 on Oscillatoriales spp. (R) Hyper-parasitic chytrid PSC-L11 (arrows) attaching on elongated oomycete zoosporangium inside Spirogyra sp. (S) Chytrid PSC-L12 on Craticula sp. (T) Chytrid PSC-L13 on Conticribra sp. (U) Chytrid PSC-L14 on Stephanodiscus binderanus. (V) Chytrid on PSC-L15 on Aulacoseira sp. (W) Chytrid PSC-L16 on Desmidium sp. (X) Chytrid PSC-L17 on Aulacoseira sp. (Y) Chytrid PSC-L18 on Staurastrum sp. (Z) Chytrid PSC-L19 on Glaucocystis sp. (AA) Olpidium-like chytrid PSC-L20 in pine pollen. (AB) Chytrid PSC-L21 on Stauridium sp. All scale bars are 10 µm.
Fig 3
Fig 3
Microscopic images of isolated cells. (A and B) Chytrid PSC-L22 on Aulacoseira sp. (A) and Stephanodiscus sp. (B). (C) Olpidium-like chytrid PSC-L25 in Closterium sp. (D) Olpidium-like chytrid PSC-L23 in Micrasterias truncata. (E) Olpidium-like chytrid PSC-L24 in Desmidium sp. (F) Olpidium-like chytrid PSC-L26 in Euastrum sp. (G) Olpidium-like chytrid PSC-L27 in Cosmarium sp. (H) Chytrid PSC-L29 on Fragilaria sp. (I) Chytrid PSC-L28 on Stephanodiscus binderanus. (J) Chytrid PSC-L30 on Aulacoseira ambigua. (K) Chytrid PSC-L31 on Sphaerocystis sp. (L) Chytrid PSC-L32 on Mougeotia sp. (M) Chytrid PSC-L33 on Mougeotia sp. (N) Two chytrids PSC-L32 and L33 on Mougeotia sp. (O) Chytrid PSC-L34 on Desmidium sp. (P) Chytrid PSC-L35 on Bambusina sp. (Q) Chytrid PSC-L36 on Cosmarium sp. (R) Chytrid on Desmidium sp. (S) Chytrid PSC-L38 on Desmidium sp. (T) Hyper-parasitic chytrid PSC-L39 attaching on another chytrid on Stephanodiscus binderanus. (U) Chytrid PSC-L40 on Mougeotia sp. (V) Chytrid PSC-L41 on Spirogyra sp. (W) Chytrid PSC-L42 on Spirogyra sp. (X) Chytrid PSC-L43 on Mougeotia sp. (Y) Chytrid PSC-L44 on Desmidium sp. (Z) Chytrid PSC-L45 on Spirogyra sp. (AA) Chytrid PSC-L46 on Melosira varians. (AB) Chytrid PSC-L47 on unidentified heliozoan. All scale bars are 10 µm.
Fig 4
Fig 4
Microscopic images of isolated cells. (A) Chytrid PSC-L48 on Oedogonium sp. (B) Chytrid PSC-L49 on Oedogonium sp. (C) Chytrid PSC-L50 in Oedogonium sp. (D and E) Chytrid PSC-L51 on Cosmarium sp. (D) and Oedogonium sp. (E). (F) Chytrid PSC-L52 on Desmodesmus sp. (G and H) Aphelid PSC-L53 in Scenedesmus sp. (G) and Desmodesmus sp. (H). (I and J) Aphelid PSC-L54 in Scenedesmus sp. (I) and Desmodesmus sp. (J). (K) Two aphelids PSC-L55 and L59 in Bambusina sp. (L) Aphelid PSC-L58 in Ankistrodesmus sp. (M) Aphelid PSC-L56 in Aulacoseira sp. (N) Aphelid PSC-L57 in Melosira varians. (O) Isolated cell of rozellid PSC-L60 including Oedogonium sp. and endobiotic, tube-shaped zoosporangia. (P) Microsporidia-like rozellid PSC-L61 (indicated by arrows) in Arcella sp. (Q) Isolated cell of rozellids PSC-L62 including tardigrade and tube-shaped zoosporangia. (R) Isolated cell of rozellids PSC-L63 including putative broken rotifer body and endobiotic zoosporangium. (S−Y) Hyper-parasitic Rozella infecting parasitic chytrids: PSC-L64 in chytrids on Desmidium sp. (S) and Bambusina sp. (T), PSC-L65 in chytrid on Mougeotia sp. (U), PSC-L66 in chytrid on Spirogyra sp. (V), PSC-L67 in chytrid on Ulnaria sp. (W), PSC-L68 in chytrid in Oedogonium sp. (X), and PSC-L69 in Olpidium-like chytrid in Micrasterias truncata (Y). (Z) Staurastrum sp. harboring unknown fungus PSC-L70. (AA) Isolated cell of unknown fungus PSC-L71 including Spirogyra sp. and attaching chytrid-like sporangia.
Fig 5
Fig 5
Maximum likelihood (ML) tree of 18S-5.8S-28S rDNA concatenated data set. Outer ring indicates the host/substrate of each culture or single cell. Brach color indicates sequence types (single cell, environmental DNA, PacBio OTU in this study, or culture/specimen). Blue circles on the tips indicate single-cell sequences obtained in this study. Red stars on the nodes indicate single-cell lineages reported in this study and the numbers correspond to the lineage numbers in the text (PSC-L1–71).
Fig 6
Fig 6
Portion of maximum likelihood (ML) tree of 18S-5.8S-28S rDNA concatenated data set including Ascomycota, Basidiomycota, Mucoromycota, Entomopthoromycotina, Kickxellomycotina, Zoopagomycotina, Blastocladiomycota, and the NC_OlpL-1 clade. ML bootstrap values higher than 50% were shown on each branch. Black dots on branches indicate 100% bootstrap value. Double and quadruple slashes on branches indicate that length is reduced by half and quarter, respectively. Cultured fungi are labeled in black; saprotrophs are indicated as [S], and obligate [OP] and facultative [FP] parasites are indicated as [O(F)P / its host]. Single cells isolated in this study are labeled in bold blue and previously published sequences of single cells are labeled in blue; annotations are indicated as [Endo (endobiotic) or Epi (epibiotic) / host / isolation source / figure number if available]. Published environmental DNA sequences are labeled in pink and PacBio OTU sequences in this study are labeled in bold red; source of each sequence is described in parentheses.
Fig 7
Fig 7
Portion of maximum likelihood (ML) tree of 18S-5.8S-28S rDNA concatenated data set including order Rhizophydiales in Chytridiomycota.
Fig 8
Fig 8
Portion of maximum likelihood (ML) tree of 18S-5.8S-28S rDNA concatenated data set including orders Zygophlyctidales, Zygorhizidiales, Rhizophlyctidales, Spizellomycetales, Synchytriales, and Chytridiales in Chytridiomycota.
Fig 9
Fig 9
Portion of maximum likelihood (ML) tree of 18S-5.8S-28S rDNA concatenated data set including Monoblepharidomycota, Neocallimastigomycota, the NC_ChyL-1 clade, and orders Lobulomycetales, Gromochytriales, Mesochytriales, Polyphagales, Cladochytrilaes, and Polychytriales in Chytridiomycota.
Fig 10
Fig 10
Portion of maximum likelihood (ML) tree of 18S-5.8S-28S rDNA concatenated data set including Aphelidiomycota, Rozellomycota, the NCLC1 and FRESHOL1 clade, Nuclearia simplex, and outgroup taxa (two holozoan taxa).

Similar articles

Cited by

References

    1. Tedersoo L, Bahram M, Põlme S, Kõljalg U, Yorou NS, Wijesundera R, Ruiz LV, Vasco-Palacios AM, Thu PQ, Suija A, Smith ME, Sharp C, Saluveer E, Saitta A, Rosas M, Riit T, Ratkowsky D, Pritsch K, Põldmaa K, Piepenbring M, Phosri C, Peterson M, Parts K, Pärtel K, Otsing E, Nouhra E, Njouonkou AL, Nilsson RH, Morgado LN, Mayor J, May TW, Majuakim L, Lodge DJ, Lee SS, Larsson K-H, Kohout P, Hosaka K, Hiiesalu I, Henkel TW, Harend H, Guo L, Greslebin A, Grelet G, Geml J, Gates G, Dunstan W, Dunk C, Drenkhan R, Dearnaley J, De Kesel A, Dang T, Chen X, Buegger F, Brearley FQ, Bonito G, Anslan S, Abell S, Abarenkov K. 2014. Global diversity and geography of soil fungi. Science 346:1256688. doi:10.1126/science.1256688 - DOI - PubMed
    1. Nilsson RH, Anslan S, Bahram M, Wurzbacher C, Baldrian P, Tedersoo L. 2019. Mycobiome diversity: high-throughput sequencing and identification of fungi. Nat Rev Microbiol 17:95–109. doi:10.1038/s41579-018-0116-y - DOI - PubMed
    1. Peay KG, Kennedy PG, Talbot JM. 2016. Dimensions of biodiversity in the earth mycobiome. Nat Rev Microbiol 14:434–447. doi:10.1038/nrmicro.2016.59 - DOI - PubMed
    1. Hawksworth DL, Lücking R. 2017. Fungal diversity revisited: 2.2 to 3.8 million species. Microbiol Spectr 5:5. doi:10.1128/microbiolspec.FUNK-0052-2016 - DOI - PMC - PubMed
    1. James TY, Stajich JE, Hittinger CT, Rokas A. 2020. Toward a fully resolved fungal tree of life. Annu Rev Microbiol 74:291–313. doi:10.1146/annurev-micro-022020-051835 - DOI - PubMed

Publication types

LinkOut - more resources