

p-mTOR, p-ERK and PTEN Expression in Tumor Biopsies and Organoids as Predictive Biomarkers for Patients with HPV Negative Head and Neck Cancer
- PMID: 37486536
- PMCID: PMC10514008
- DOI: 10.1007/s12105-023-01576-4
p-mTOR, p-ERK and PTEN Expression in Tumor Biopsies and Organoids as Predictive Biomarkers for Patients with HPV Negative Head and Neck Cancer
Abstract
Background: Survival rates of head and neck squamous cell carcinoma (HNSCC) have only marginally improved in the last decades. Hence there is a need for predictive biomarkers for long-time survival that can help to guide treatment decisions and might lead to the development of new therapies. The phosphatidylinositol 3-kinase (PI3K)/AKT/mTOR signaling pathway is the most frequently altered pathway in HNSCC, genes are often mutated, amplificated and overexpressed causing aberrant signaling affecting cell growth and differentiation. Numerous genetic alterations of upstream and downstream factors have currently been clarified. However, their predictive value has yet to be established. Therefore we assess the predictive value of p-mTOR, p-ERK and PTEN expression.
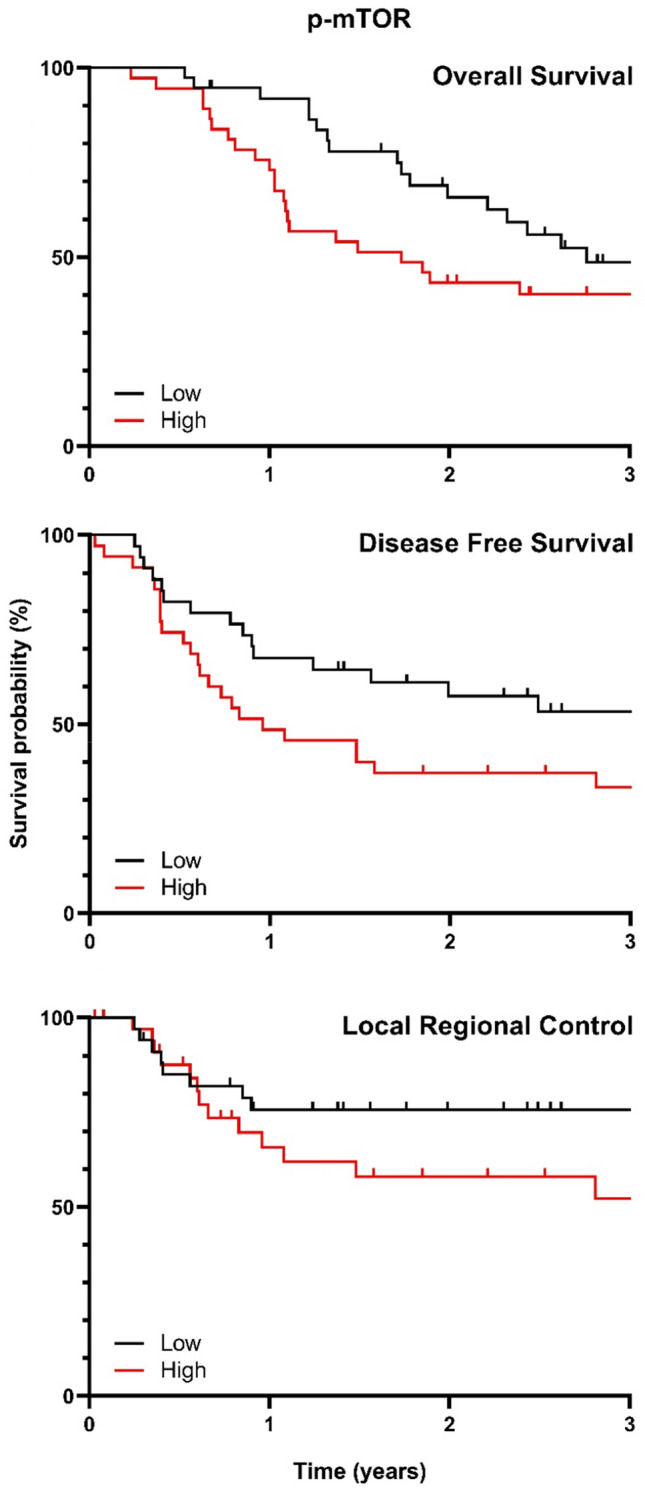
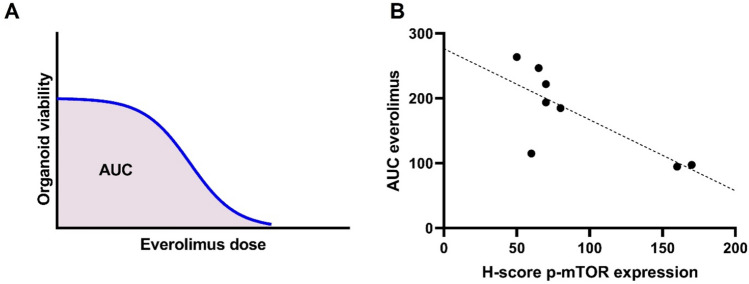
Methods: Tissue microarrays (TMA's) of HPV-negative patients with oropharyngeal (n = 48), hypopharyngeal (n = 16) or laryngeal (n = 13) SCC, treated with primary chemoradiation (cisplatin/carboplatin/cetuximab and radiotherapy), were histologically stained for p-mTOR, PTEN and p-ERK. Expression was correlated to overall survival (OS), disease free survival (DFS) and locoregional control (LRC). Also p-mTOR was histologically stained in a separate cohort of HNSCC organoids (n = 8) and correlated to mTOR-inhibitor everolimus response.
Results: High p-mTOR expression correlated significantly with worse OS in multivariate analysis in the whole patient cohort [Hazar Ratio (HR) 1.06, 95%CI 1.01-1.11, p = 0.03] and in the cisplatin/carboplatin group with both worse OS (HR 1.09, 95%CI 1.02-1.16, p = 0.02) and DFS (HR 1.06, 95%CI 1.00-1.12, p = 0,04). p-ERK expression correlated significantly with DFS in univariate analysis in the whole patient cohort (HR 1.03, 95%CI 1.00-1.05, p = 0.04) and cisplatin/carboplatin group (HR 1.03, 95%CI 1.00-1.07, p = 0.04). PTEN-expression did not correlate with OS/DFS/LRC. Better organoid response to everolimus correlated significantly to higher p-mTOR expression (Rs = - 0.731, p = 0.04).
Conclusions: High p-mTOR expression predicts and high p-ERK expression tends to predict worse treatment outcome in HPV negative HNSCC patients treated with chemoradiation, providing additional evidence that these markers are candidate prognostic biomarkers for survival in this patient population. Also this study shows that the use of HNSCC organoids for biomarker research has potential. The role of PTEN expression as prognostic biomarker remains unclear, as consistent evidence on its prognostic and predictive value is lacking.
Keywords: Biomarkers; ERK; HNSCC; Head and Neck Squamous Cell Carcinoma; PTEN; mTOR.
© 2023. The Author(s).
Conflict of interest statement
The authors declare no competing interests.
Figures

References
MeSH terms
Substances
Grants and funding
LinkOut - more resources
Full Text Sources
Medical
Research Materials
Miscellaneous
