

Consumption of Soft Drinks and Overweight and Obesity Among Adolescents in 107 Countries and Regions
- PMID: 37486630
- PMCID: PMC10366702
- DOI: 10.1001/jamanetworkopen.2023.25158
Consumption of Soft Drinks and Overweight and Obesity Among Adolescents in 107 Countries and Regions
Abstract
Importance: Soft drink consumption is associated with weight gain in children and adolescents, but little is known about the association between soft drink consumption and prevalence of the overweight and obesity in adolescents.
Objective: To investigate the association of soft drink consumption with overweight and obesity in adolescents enrolled in school (hereafter, school-going adolescents) using country-level and individual-level data.
Design, setting, and participants: This cross-sectional study used data from 3 cross-sectional studies including 107 countries and regions that participated in the Global School-Based Student Health Survey (2009-2017), the European Health Behavior in School-Aged Children study (2017-2018), and the US Youth Risk Behavior Survey (2019).
Exposure: Daily soft drink consumption (consuming soft drinks 1 or more times per day or not).
Main outcome and measure: Overweight and obesity defined by the World Health Organization Growth Reference Data.
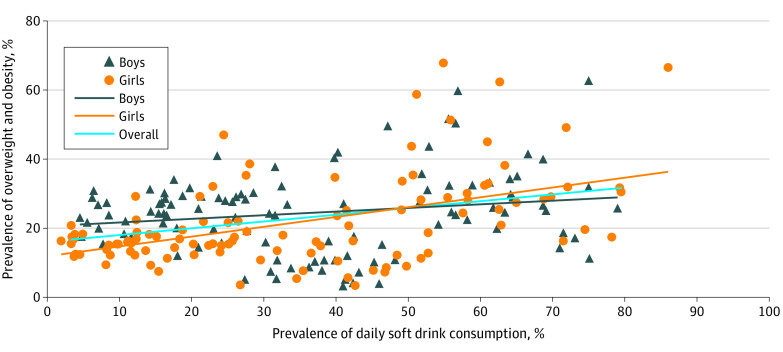
Results: Among the 107 countries and regions, 65 were low- and middle-income, and 42 were high-income countries and regions, with a total of 405 528 school-going adolescents (mean [SD] age, 14.2 [1.7] years; 196 147 [48.4%] males). The prevalence of overweight and obesity among adolescent students varied from 3.3% (95% CI, 2.6 to 4.1) in Cambodia to 64.0% (95% CI, 57.0 to 71.6) in Niue, and the prevalence of adolescent students consuming soft drinks 1 or more times per day varied from 3.3% (95% CI, 2.9 to 3.7) in Iceland to 79.6% (95% CI, 74.0 to 85.3) in Niue. There was a positive correlation between the prevalence of daily soft drink consumption and the prevalence of overweight and obesity (R, 0.44; P < .001). The pooled analysis using individual-level data also showed a statistically significant association between daily soft drink consumption and overweight and obesity (daily soft drink consumption vs nondaily soft drink consumption), with an odds ratio of 1.14 (95% CI, 1.08 to 1.21) among school-going adolescents.
Conclusions and relevance: In this study of 107 countries and regions, the prevalence of daily consumption of soft drinks was associated with the prevalence of overweight and obesity among adolescent students. Our results, in conjunction with other evidence, suggest that reducing soft drink consumption should be a priority in combating adolescent overweight and obesity.
Conflict of interest statement
Figures
References
-
- NCD Risk Factor Collaboration (NCD-RisC) . Worldwide trends in body-mass index, underweight, overweight, and obesity from 1975 to 2016: a pooled analysis of 2416 population-based measurement studies in 128·9 million children, adolescents, and adults. Lancet. 2017;390(10113):2627-2642. doi: 10.1016/S0140-6736(17)32129-3 - DOI - PMC - PubMed
MeSH terms
LinkOut - more resources
Full Text Sources
Medical
