

Validation of a Proprietary Deterioration Index Model and Performance in Hospitalized Adults
- PMID: 37486632
- PMCID: PMC10366696
- DOI: 10.1001/jamanetworkopen.2023.24176
Validation of a Proprietary Deterioration Index Model and Performance in Hospitalized Adults
Abstract
Importance: The Deterioration Index (DTI), used by hospitals for predicting patient deterioration, has not been extensively validated externally, raising concerns about performance and equitable predictions.
Objective: To locally validate DTI performance and assess its potential for bias in predicting patient clinical deterioration.
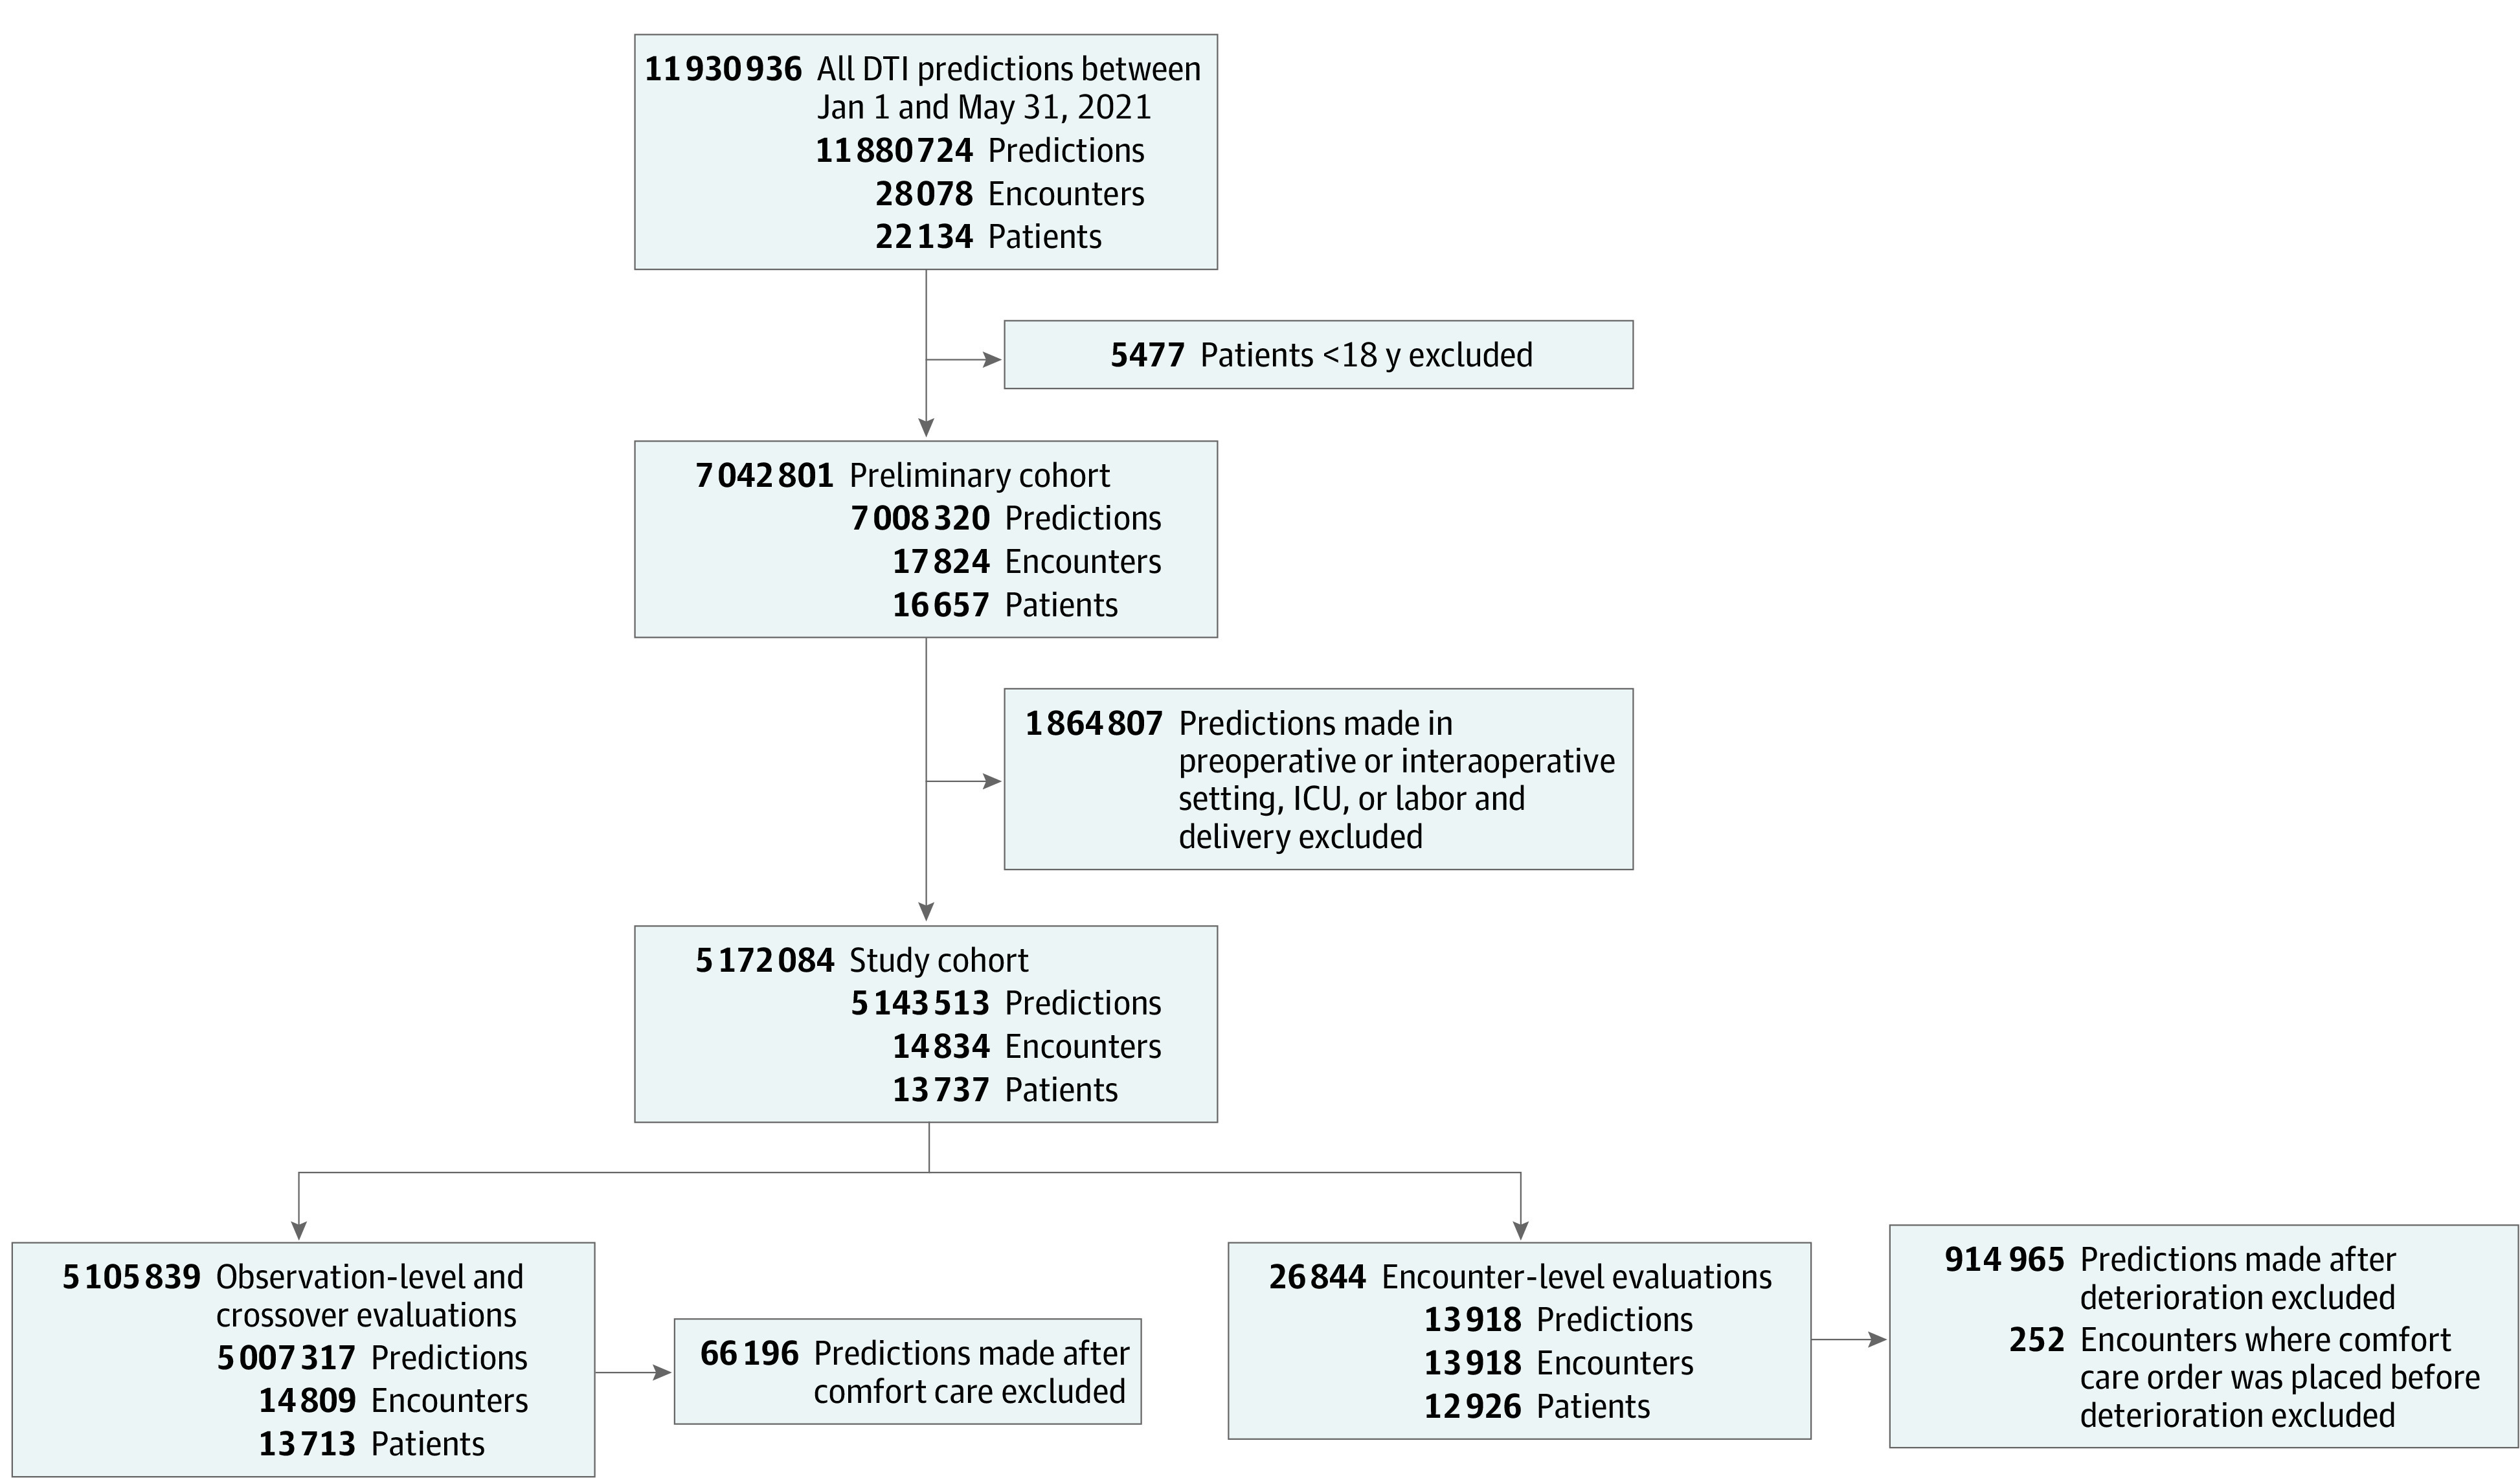
Design, setting, and participants: This retrospective prognostic study included 13 737 patients admitted to 8 heterogenous Midwestern US hospitals varying in size and type, including academic, community, urban, and rural hospitals. Patients were 18 years or older and admitted between January 1 and May 31, 2021.
Exposure: DTI predictions made every 15 minutes.
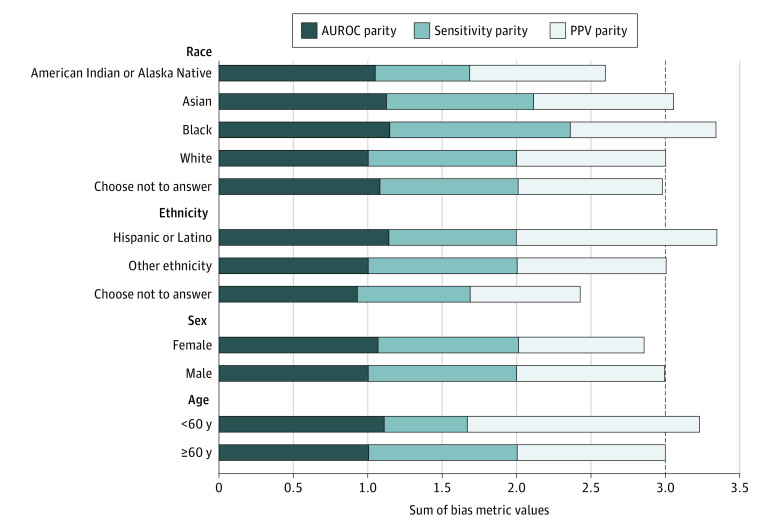
Main outcomes and measures: Deterioration, defined as the occurrence of any of the following while hospitalized: mechanical ventilation, intensive care unit transfer, or death. Performance of the DTI was evaluated using area under the receiver operating characteristic curve (AUROC) and area under the precision recall curve (AUPRC). Bias measures were calculated across demographic subgroups.
Results: A total of 5 143 513 DTI predictions were made for 13 737 patients across 14 834 hospitalizations. Among 13 918 encounters, the mean (SD) age of patients was 60.3 (19.2) years; 7636 (54.9%) were female, 11 345 (81.5%) were White, and 12 392 (89.0%) were of other ethnicity than Hispanic or Latino. The prevalence of deterioration was 10.3% (n = 1436). The DTI produced AUROCs of 0.759 (95% CI, 0.756-0.762) at the observation level and 0.685 (95% CI, 0.671-0.700) at the encounter level. Corresponding AUPRCs were 0.039 (95% CI, 0.037-0.040) at the observation level and 0.248 (95% CI, 0.227-0.273) at the encounter level. Bias measures varied across demographic subgroups and were 14.0% worse for patients identifying as American Indian or Alaska Native and 19.0% worse for those who chose not to disclose their ethnicity.
Conclusions and relevance: In this prognostic study, the DTI had modest ability to predict patient deterioration, with varying degrees of performance at the observation and encounter levels and across different demographic groups. Disparate performance across subgroups suggests the need for more transparency in model training data and reinforces the need to locally validate externally developed prediction models.
Conflict of interest statement
Figures
References
-
- Thomson R, Luettel D, Healey F, Scobie S; National Patient Safety Agency . Safer care for the acutely ill patient: learning from serious incidents. Patient Safety Network, Agency for Healthcare Research and Quality. October 24, 2007. Accessed May 22, 2022. https://psnet.ahrq.gov/issue/safer-care-acutely-ill-patient-learning-ser...
