. 2023 Jul 24;7(8):e0208.
doi: 10.1097/HC9.0000000000000208. eCollection 2023 Aug 1.

Hepatocytes reprogram liver macrophages involving control of TGF-β activation, influencing liver regeneration and injury

Affiliations

Hepatocytes reprogram liver macrophages involving control of TGF-β activation, influencing liver regeneration and injury

Stephanie D Wolf et al. Hepatol Commun. .

Abstract

Background: Macrophages play an important role in maintaining liver homeostasis and regeneration. However, it is not clear to what extent the different macrophage populations of the liver differ in terms of their activation state and which other liver cell populations may play a role in regulating the same.

Methods: Reverse transcription PCR, flow cytometry, transcriptome, proteome, secretome, single cell analysis, and immunohistochemical methods were used to study changes in gene expression as well as the activation state of macrophages in vitro and in vivo under homeostatic conditions and after partial hepatectomy.

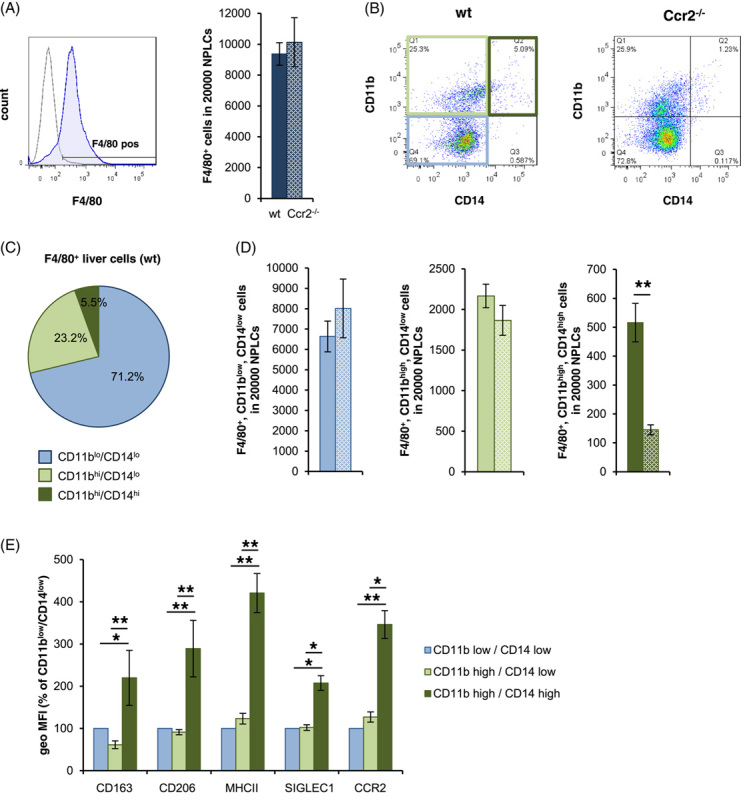
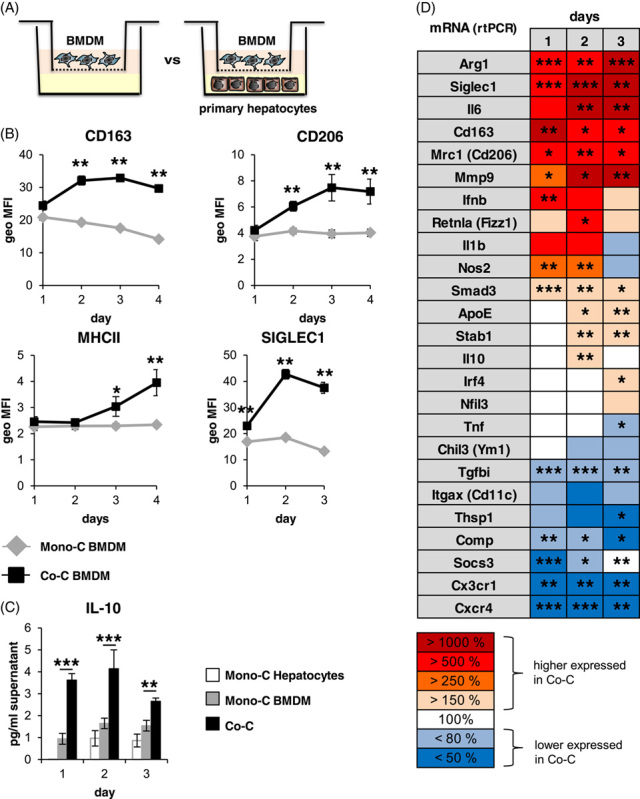
Results: We show that F4/80+/CD11bhi/CD14hi macrophages of the liver are recruited in a C-C motif chemokine receptor (CCR2)-dependent manner and exhibit an activation state that differs substantially from that of the other liver macrophage populations, which can be distinguished on the basis of CD11b and CD14 expressions. Thereby, primary hepatocytes are capable of creating an environment in vitro that elicits the same specific activation state in bone marrow-derived macrophages as observed in F4/80+/CD11bhi/CD14hi liver macrophages in vivo. Subsequent analyses, including studies in mice with a myeloid cell-specific deletion of the TGF-β type II receptor, suggest that the availability of activated TGF-β and its downregulation by a hepatocyte-conditioned milieu are critical. Reduction of TGF-βRII-mediated signal transduction in myeloid cells leads to upregulation of IL-6, IL-10, and SIGLEC1 expression, a hallmark of the activation state of F4/80+/CD11bhi/CD14hi macrophages, and enhances liver regeneration.

Conclusions: The availability of activated TGF-β determines the activation state of specific macrophage populations in the liver, and the observed rapid transient activation of TGF-β may represent an important regulatory mechanism in the early phase of liver regeneration in this context.


Conflict of interest statement

Julio Saez-Rodriguez has received funding from GSK, Pfizer and Sanofi, and fees/honoraria from Travere Therapeutics, Stadapharm, Astex, Pfizer and Grunenthal. The remaining authors have no conflicts to report.

Figures

None
Graphical abstract
FIGURE 1
FIGURE 1
CCR2 dependently recruited liver macrophages are characterized by high expression of CD11b and CD14 and a distinctive pattern of activation markers. NPLCs were isolated from wt (filled bars) and for A, B, and D from CCR2−/− (spotted bars) mice and analyzed by flow cytometry using antibodies against (A) F4/80 (blue) versus FMO control (gray). For (B–D), analysis was performed using antibodies against F4/80, CD11b, and CD14 and grouped on the basis of the expression intensity of CD11b and CD14 into F4/80+/CD11blo/CD14lo (bright blue), F4/80+/CD11bhi/CD14lo (bright green), and F4/80+/CD11bhi/CD14hi (dark green). (E) Analysis of the different subgroups characterized in B using additional antibodies against CD163, CD206, MHCII, SIGLEC1, and CCR2. The geometric MFIs of CD11bhi/CD14hi and CD11bhi/CD14lo cells are shown in relation to the respective CD11blo/CD14lo cells. The data are presented as means ± SEM (n = 6/genotype). Mann-Whitney U test, * for p ≤ 0.05 and ** for p ≤ 0.01. Abbreviations: CCR2, C-C motif chemokine receptor; NPLCs, nonparenchymal liver cells.
FIGURE 2
FIGURE 2
Hepatocytes induce a particular activation state in BMDM. (A) Scheme of the coculture system used. (B) Monocultivated and cocultivated BMDM (n = 5–6) were analyzed for CD163, CD206, MHCII, or SIGLEC1 expression using flow cytometry and (C) for IL-10 release using ELISA (n = 7–8). (D) Heat map of mRNA expression levels of different genes in monocultivated or cocultivated BMDM after 1–3 days of (co)cultivation (Supplemental Figure S3, http://links.lww.com/HC9/A410). Data are presented as means ± SEM. Mann-Whitney U test, * for p ≤ 0.05, ** for p ≤ 0.01, and *** for p ≤ 0.001. Abbreviations: BMDM, bone marrow–derived macrophages.
FIGURE 3
FIGURE 3
Hepatocytes induce a marked change in cocultivated BMDM, but BMDM has only a minor influence on cocultured hepatocytes. Proteome (mass spectrometry, A and B) and transcriptome (microarray, C) were analyzed in monocultivated and cocultivated macrophages and/or hepatocytes. (A) Volcano plots comparing the proteome of monocultivated versus cocultivated macrophages and (B) monocultivated versus cocultivated hepatocytes. In both Volcano plots, log10-transformed p values are plotted against log-transformed fold change in abundance between monoculture and coculture. The nonaxial horizontal line denotes p = 0.05 (significance threshold), and the vertical lines indicate fold change = 2 (threshold cutoff). All unique proteins are sorted according to their log2 LFQ intensities. (C) PCA scores of transcriptome data show the respective overall normalized mRNA expression for monocultivated (red) and cocultivated (yellow) hepatocytes (■) and BMDM (▲). In each case, 5 independent samples were analyzed. Abbreviations: BMDM, bone marrow–derived macrophages; LFQ, label-free quantification; PCA, principal component analysis.
FIGURE 4
FIGURE 4
Hepatocytes reduce the concentration of active TGF-β1 in the supernatant of cocultivated BMDM. (A) Pie chart of all proteins detected by mass spectrometry in the supernatant of monocultivated hepatocytes grouped based on protein function and (B) those proteins that could modulate TGF-β activation and/or signaling. (C and D) Supernatants of monocultivated or cocultivated BMDM and/or hepatocytes were collected after 2 and 3 days of culture and analyzed for active (after concentration, C) or total (D) TGF-β1 using ELISA. Data of active TGF-β1 are expressed in relation to monocultivated BMDM at day 1 (n = 4–8). (E) Differences in the mRNA expression of Tgfbi, Comp, and Ppp2r1a in monocultivated and cocultivated BMDM after 1–3 days of cultivation (n = 5–7) and (F) in the concentration of these factors in the supernatant determined by mass spectrometry after 2 days of cultivation (n = 5). Data are presented as means ± SEM. Mann-Whitney U test, * for p ≤ 0.05, ** for p ≤ 0.01, and *** for p ≤ 0.001. Abbreviations: BMDM, bone marrow–derived macrophages.
FIGURE 5
FIGURE 5
Impairment of TGF-βRII signaling in myeloid cells modulates gene expression of genes in BMDM, liver tissue, and liver macrophages. Expression of Siglec1, Il6, Il10, Mmp9, and Cxcr4 was analyzed by reverse transcription PCR in total mRNA isolated from (A) BMDM (n = 5–8) or (B) whole liver tissue (n = 9–12) derived from TGF-βRIIflox or TGF-βRIIΔMC mice. Data are expressed as means ± SEM. Mann-Whitney U test, * for p ≤ 0.05, ** for p ≤ 0.01, and *** for p ≤ 0.001. (C) Cluster-dependent analysis of the expression of these genes in liver macrophage subpopulations of TGF-βRIIflox or TGF-βRIIΔMC mice discriminated on the basis of single-cell RNA analysis (n = 2). Abbreviations: PHx, partial hepatectomy; NPLCs, nonparenchymal liver cells.
FIGURE 6
FIGURE 6
Recruitment of CD11bhi/CD14hi macrophages during the course of liver regeneration is CCR2 dependent. PHx was performed in (A–E) wt (filled bars) or (D, E) CCR2−/− (spotted bars) mice and animals were sacrificed after the time points indicated. (A) Gating strategy for subdividing F4/80-positive NPLCs based on their CD11b and CD14 expressions by flow cytometry. (B, D) Quantification of F4/80+/CD11bhi/CD14hi (dark green), F4/80+/CD11blo/CD14lo (bright blue), and F4/80+/CD11bhi/CD14lo (bright green) in 20,000 NPLC each and (C, E) sum of the F4/80+ macrophage subpopulations (dark blue). The data are presented as means ± SEM (n = 5–7). Significant differences to 0 h are indicated by # for p ≤ 0.05. Significant differences between wt and Ccr2−/− animals were indicated by ** for p ≤ 0.01 (Mann-Whitney U test). Abbreviations: CCR2, C-C motif chemokine receptor; NPLCs, nonparenchymal liver cells; PHx, partial hepatectomy.
FIGURE 7
FIGURE 7
After PHx, TGF-β is strongly activated and may potentially affect the polarization of the F4/80+/CD11bhi/CD14hi macrophage subpopulation. PHx was performed in wt mice, and animals were sacrificed after the time points indicated. (A) Sections of snap‐frozen liver tissue were stained with anti-TGF-β-LAP (green) and DRAQ5 (blue). Representative sections are shown (×25 magnification, scale bars: 25 µm). NPLCs were analyzed for expression of MHCII (B), SIGLEC1 (C), CD163 (D), and CD206 (E) in the three macrophage subpopulations distinguished by flow cytometry (like in Figures 1 and 6). The geometric MFI of CD11bhi/CD14hi and CD11bhi/CD14lo cells is shown relative to the respective CD11blo/CD14lo cells. Data are presented as means ± SEM (n = 5–6). Significant differences to the respective control at day 0 are indicated by # for p ≤ 0.05, and significant differences to the CD11bhi/CD14hi population at the different time points are indicated by * for p ≤ 0.05 (Mann-Whitney U test). Abbreviations: NPLC, nonparenchymal liver cells; PHx, partial hepatectomy.
FIGURE 8
FIGURE 8
Impaired TGF-βRII signaling in myeloid cells prolongs hepatocyte proliferation and reduces injury after PHx. PHx was performed in TGF-βRIIflox or TGF-βRIIΔMC mice, and animals were sacrificed after the time points indicated. (A) Sections of snap‐frozen liver tissue were analyzed using confocal microscopy after staining with antibodies specific for Ki67 (green), F4/80 (pink), CD26 (red), and Hoechst (blue). Representative sections are shown (×25 magnification, scale bars: 50 µm). Quantification of proliferating cell nuclei at day 1–4 after PHx (n = 3–5). (B) AST, ALT, and LDH activities in the serum of respective animals (n = 4–7). (C) Total mRNA was extracted from whole liver tissue, and transcript abundance of Il10, Il6, Siglec1, Mmp9, Cx3cr1, and Cxcr4 was determined by reverse transcription PCR (n = 5–10). The data are presented as means ± SEM. Significant differences to control (0) are indicated by # for p ≤ 0.05, and differences between TGF-βRIIΔMC and TGF-βRIIflox mice are indicated by * for p ≤ 0.05, ** for p ≤ 0.01, and *** for p ≤ 0.001 (Mann-Whitney U test). Abbreviations: ALT, alanine aminotransferase; AST, aspartate aminotransferase; LDH, lactate dehydrogenase; PHx, partial hepatectomy.

References

    1. Krenkel O, Tacke F. Liver macrophages in tissue homeostasis and disease. Nat Rev Immunol. 2017;17:306–21. - PubMed
    1. Ziegler-Heitbrock L. Blood monocytes and their subsets: established features and open questions. Front Immunol. 2015;6:423. - PMC - PubMed
    1. Ingersoll MA, Spanbroek R, Lottaz C, Gautier EL, Frankenberger M, Hoffmann R, et al. . Comparison of gene expression profiles between human and mouse monocyte subsets. Blood. 2010;115:e10–9. - PMC - PubMed
    1. Ziegler-Heitbrock L. Monocyte subsets in man and other species. Cell Immunol. 2014;289:135–9. - PubMed
    1. She S, Ren L, Chen P, Wang M, Chen D, Wang Y, et al. . Functional roles of chemokine receptor CCR2 and its ligands in liver disease. Front Immunol. 2022;13:812431. - PMC - PubMed

Publication types

Substances