. 2023 Dec 8;25(12):2287-2301.
doi: 10.1093/neuonc/noad128.

EYA2 tyrosine phosphatase inhibition reduces MYC and prevents medulloblastoma progression

Affiliations

EYA2 tyrosine phosphatase inhibition reduces MYC and prevents medulloblastoma progression

Arthur R Wolin et al. Neuro Oncol. .

Abstract

Background: Medulloblastoma is the most common pediatric brain malignancy. Patients with the Group 3 subtype of medulloblastoma (MB) often exhibit MYC amplification and/or overexpression and have the poorest prognosis. While Group 3 MB is known to be highly dependent on MYC, direct targeting of MYC remains elusive.

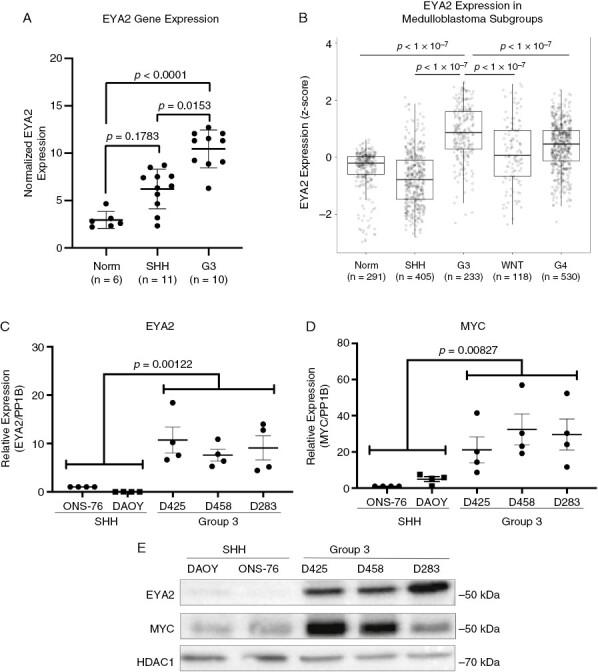
Methods: Patient gene expression data were used to identify highly expressed EYA2 in Group 3 MB samples, assess the correlation between EYA2 and MYC, and examine patient survival. Genetic and pharmacological studies were performed on EYA2 in Group 3 derived MB cell models to assess MYC regulation and viability in vitro and in vivo.

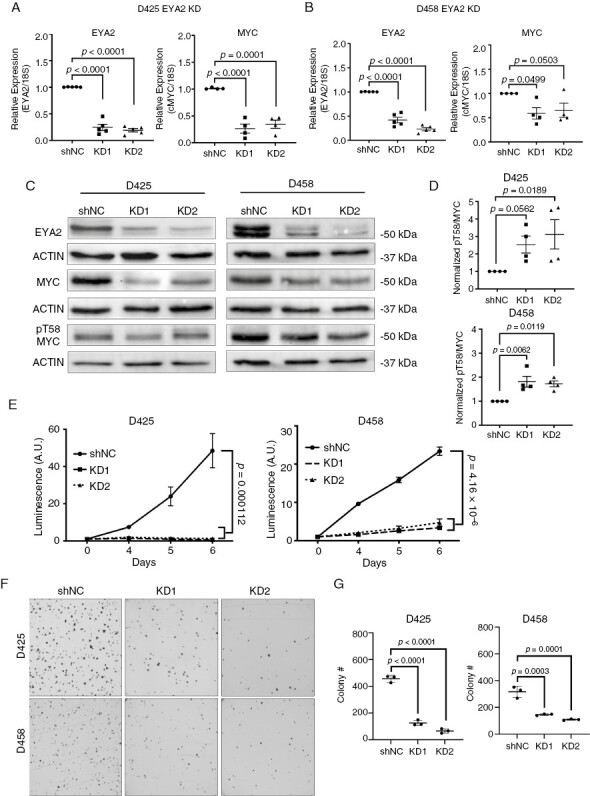
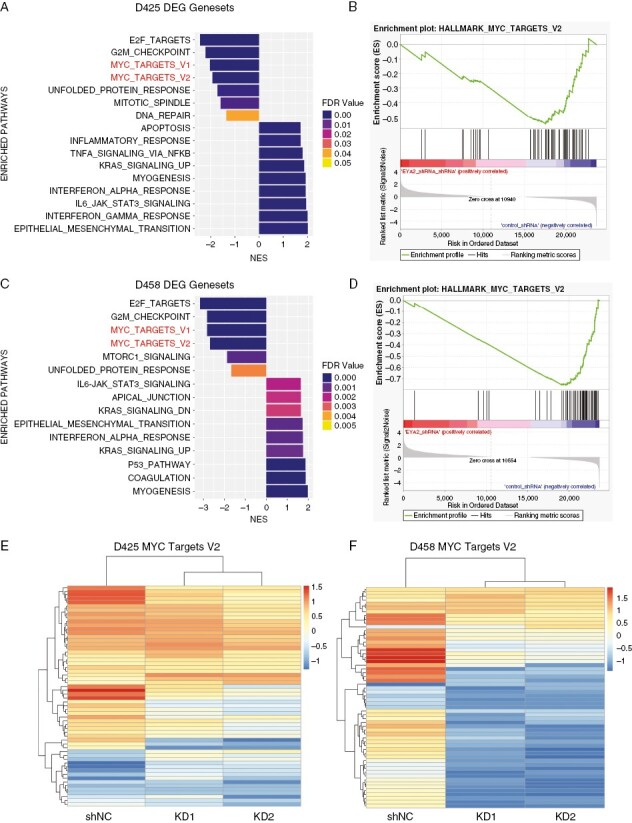
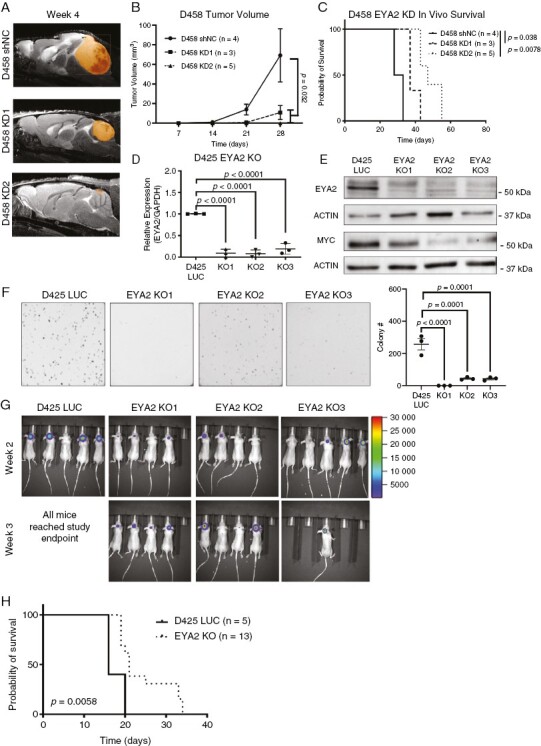
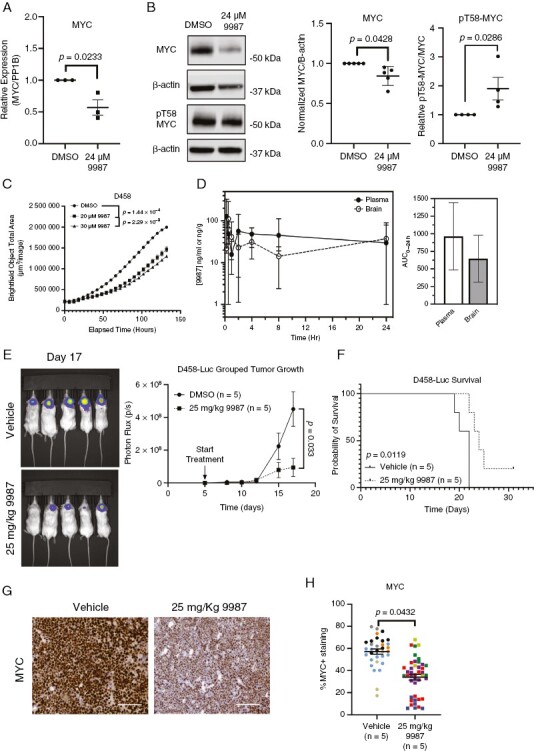
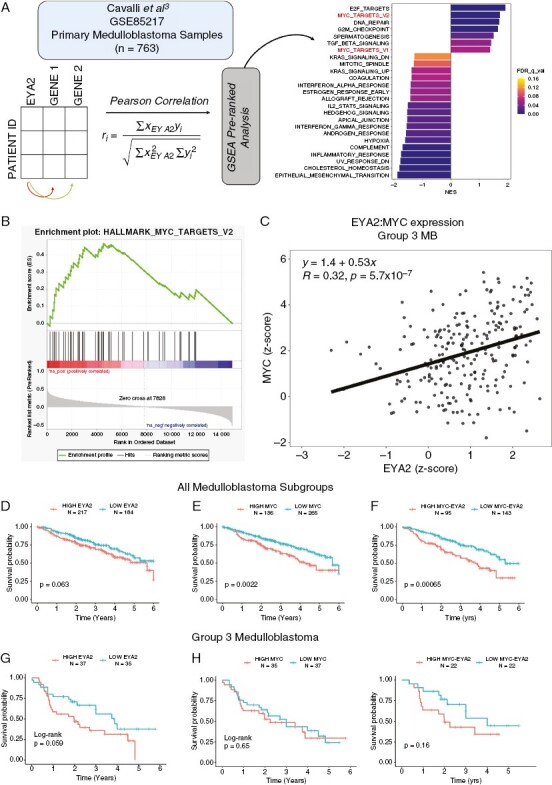
Results: EYA2 is more highly expressed in Group 3 MB than other MB subgroups and is essential for Group 3 MB growth in vitro and in vivo. EYA2 regulates MYC expression and protein stability in Group 3 MB, resulting in global alterations of MYC transcription. Inhibition of EYA2 tyrosine phosphatase activity, using a novel small molecule inhibitor (NCGC00249987, or 9987), significantly decreases Group 3 MB MYC expression in both flank and intracranial growth in vivo. Human MB RNA-seq data show that EYA2 and MYC are significantly positively correlated, high EYA2 expression is significantly associated with a MYC transcriptional signature, and patients with high EYA2 and MYC expression have worse prognoses than those that do not express both genes at high levels.

Conclusions: Our data demonstrate that EYA2 is a critical regulator of MYC in Group 3 MB and suggest a novel therapeutic avenue to target this highly lethal disease.

Keywords: EYA2; Group 3 medulloblastoma; MYC.


Conflict of interest statement

JME has provided consulting services to Eli Lilly and Co. and Gilead Sciences Inc. and serves on the advisory board of Perha Pharmaceuticals. All other authors declare no conflicts of interest.

Figures

Figure 1.
Figure 1.
EYA2 is highly expressed in Group 3 medulloblastoma. (A) Normalized EYA2 expression by microarray in Group 3 MB, SHH-driven MB, or brain tissue from epileptic patients. Statistical analysis: One-way ANOVA with Tukey’s post hoc analysis for multiple comparisons. (GSE94349) (B) EYA2 expression in Group 3 MB (GSE124814) compared to other subgroup tumors or brain tissue from epileptic patients. Statistical analysis: One-way ANOVA with Tukey’s post hoc analysis for multiple comparisons. (C) EYA2 and (D) MYC expression in SHH-driven (DAOY, ONS-76) and Group 3 (D425, D458, and D283) MB models. Statistical analysis: ANOVA with sum contrasts in R for 4 independent experiments, each performed in technical triplicate. (E) Western blot of EYA2 and MYC protein expression in SHH-driven and Group 3 medulloblastoma cell models, representative of four independent experiments.
Figure 2.
Figure 2.
EYA2 is required for Group 3 MB growth and regulates MYC transcription and protein stability. (A) EYA2 and MYC mRNA expression in D425 shNC and EYA2 KD cells. (B) EYA2 and MYC mRNA expression in D458 shNC and EYA2 KD cells. Data in Figures 2A and B are normalized from either 5 (EYA2) or 4 (MYC) independent experiments. (C) Western blot showing EYA2, MYC, and phospho-threonine 58 (pT58) MYC levels in shNC and EYA2 KD in D425 and D458 cells (n = 4 independent experiments). (D) pT58-MYC:MYC ratio in EYA2 KD in D425 and D458 cells. Statistical analysis for Figures 2A–D: Kruskal–Wallis or one-way ANOVA with a Dunnett’s post hoc test. (E) Loss of EYA2 in D425 and D458 cells elicits severe growth defects as measured by CellTiterGlo, one growth curve is shown with technical triplicates (representative of three independent experiments). Statistical analysis: Longitudinal mixed-effects model in R. (F) Loss of EYA2 in D425 and D458 cells impairs colony growth in methylcellulose growth assays. Representative images of three independent experiments. (G) Quantitation of methylcellulose growth from panel (F) Statistical analysis: One-way ANOVA with Dunnett’s post hoc analysis for multiple comparisons.
Figure 3.
Figure 3.
EYA2 regulates MYC gene targets. (A) Pathway analysis of differentially expressed genes between shNC and EYA2 KD D425 cells. (B) GSEA plot of MYC target genes between shNC and EYA2 KD D425 cells. (C) Pathway analysis of differentially expressed genes between shNC and EYA2 KD D458 cells. (D) GSEA plot of MYC target genes between shNC and EYA2 KD D458 cells. (E) Heatmap of differentially expressed MYC target genes in D425 shNC and EYA2 KD cells. (F) Heatmap of differentially expressed MYC target genes in D458 shNC and EYA2 KD cells. RNA-seq between shNC and EYA2 KD cells was performed in 3 biological replicates. Heatmaps are representative of average gene expression from 3 independent knockdowns for each cell line.
Figure 4.
Figure 4.
EYA2 is required for MB growth in vivo. (A) Representative MRIs at week 4 after mice were orthotopically transplanted with shNC or EYA2 KD D458 cells. (B) Tumor volume as measured by MRI of shNC and EYA2 KD D458 tumors. Statistical analysis: Longitudinal mixed-effects model in R. (C) Survival curves for mice transplanted with shNC or EYA2 KD D458 tumors. Statistical analysis: Mantel-Cox log-rank test with Bonferroni correction for multiple comparisons. (D) EYA2 mRNA in D425 parental and CRISPR knock-out (KO) clones. Statistical analysis: One-way ANOVA with Dunnett’s post hoc test. Data represents 3 independent experiments each performed in technical triplicate. (E) EYA2 and MYC protein levels in D425-LUC parental and EYA2 KO clones. Representative of 3 western blots. (F) Representative images of a methylcellulose colony formation assay performed with D425-LUC parental and EYA2 KO clones. Statistical analysis: One-way ANOVA with Dunnett’s post hoc test. Representative of three independent experiments, each performed in technical triplicate. (G) IVIS imaging of luciferase-expressing D425-LUC and EYA2 KO clones intracranially injected into mice. (H) Kaplan–Meier survival curves of mice transplanted with D425-LUC parental or EYA2 KO clones, composite of all three KO groups. Statistical Analysis: Log-rank Mantel-Cox test.
Figure 5.
Figure 5.
EYA2 Tyr Ptase inhibition decreases MYC levels and MB growth in vitro and in vivo. (A) Normalized MYC mRNA expression in D458 cells cultured with 24 μM 9987, representative of 3 independent experiments. Statistical analysis: Welch’s T-test. (B) Representative Western blot of D458 cells cultured with 24 μM 9987, representative of 5 (MYC) or 4 (pT58-MYC) independent experiments. Statistical analysis: Welch’s T-test. (C) Representative growth analysis of D458 cells cultured with indicated doses of 9987. Statistical analysis: Longitudinal mixed-effects model with a Bonferroni correction for multiple comparisons. (D) Pharmacokinetic analysis of 9987 in plasma and brain tissue through 24 hours. 9987 was assessed via mass spectrometry in 3–4 mice per time point. (E) Representative bioluminescence images (left) of end-point tumors in mice treated with vehicle or 25 mg/kg 9987, and intracranial tumor growth over time of vehicle or 9987 treated mice, measured as photon flux. Statistical analysis: Longitudinal mixed-effects model. (F) Kaplan–Meier curve of mice treated with vehicle or 25 mg/kg 9987. Statistical analysis: Log-rank Mantel-Cox test. (G) Representative IHC images of MYC from tumor bearing mice treated with vehicle or 25 mg/kg 9987. Scale bars represent 100 µm. (H) Quantification of MYC in end-point tumors of mice treated with vehicle or 25 mg/kg 9987. Statistical analysis: Nested T-test. Individual mice labeled in different colors. Data show 4–13 sections/tumor.
Figure 6.
Figure 6.
EYA2 correlates with MYC and MYC transcriptional signatures in MB samples. (A) GSEA pre-ranked analysis on genes correlated with EYA2 expression in primary MB tumors (GSE85217) (B) GSEA plot for MYC_targets_V2 genes. (C) MYC and EYA2 gene expression in Group 3 tumors. Patient survival across all MB subtypes stratified by differential (D) EYA2, (E) MYC, or F) EYA2 and MYC expression. Patient survival within group 3 MB stratified by high versus low (above or below the mean) (G) EYA2, (H) MYC, or (I) EYA2 and MYC expression. Statistical analysis for Figure 6D-I: Log-Rank analysis in R.

References

    1. Ostrom QT, Patil N, Cioffi G, et al. . CBTRUS statistical report: Primary brain and other central nervous system tumors diagnosed in the United States in 2013-2017. Neuro Oncol. 2020;22(12 suppl 2):iv1–iv96. - PMC - PubMed
    1. Ceccarelli M, Barthel FP, Malta TM, et al. ; TCGA Research Network. Molecular profiling reveals biologically discrete subsets and pathways of progression in diffuse glioma. Cell. 2016;164(3):550–563. - PMC - PubMed
    1. Cavalli FMG, Remke M, Rampasek L, et al. . Intertumoral heterogeneity within medulloblastoma subgroups. Cancer Cell. 2017;31(6):737–754.e6. - PMC - PubMed
    1. Northcott PA, Buchhalter I, Morrissy AS, et al. . The whole-genome landscape of medulloblastoma subtypes. Nature. 2017;547(7663):311–317. - PMC - PubMed
    1. Sharma T, Schwalbe EC, Williamson D, et al. . Second-generation molecular subgrouping of medulloblastoma: An international meta-analysis of Group 3 and Group 4 subtypes. Acta Neuropathol (Berl). 2019;138(2):309–326. - PMC - PubMed

Publication types

MeSH terms