. 2023 Aug;120(31):e2217033120.
doi: 10.1073/pnas.2217033120. Epub 2023 Jul 24.

Molecular signatures define subtypes of auditory afferents with distinct peripheral projection patterns and physiological properties

Affiliations

Molecular signatures define subtypes of auditory afferents with distinct peripheral projection patterns and physiological properties

Caroline Siebald et al. Proc Natl Acad Sci U S A. 2023 Aug.

Abstract

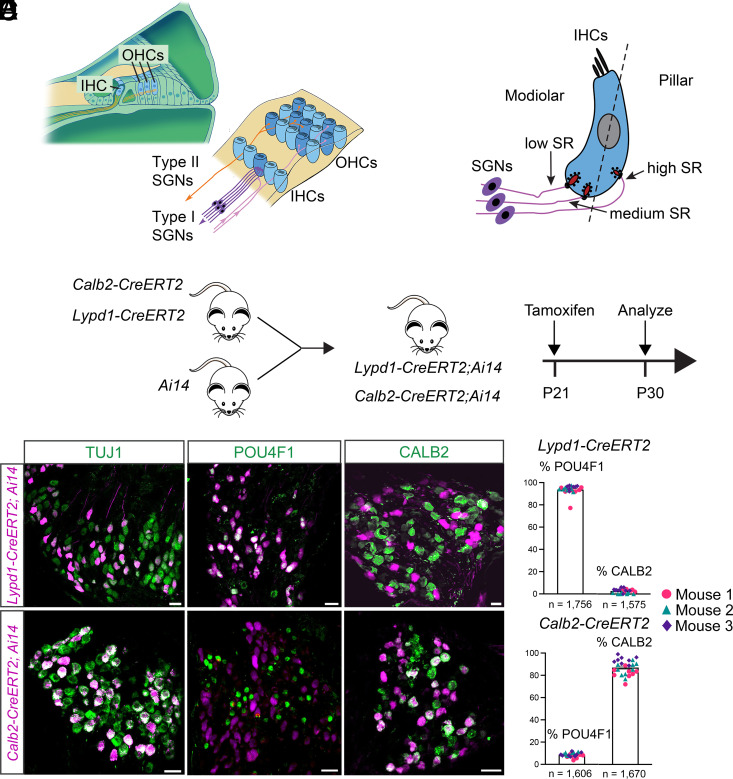
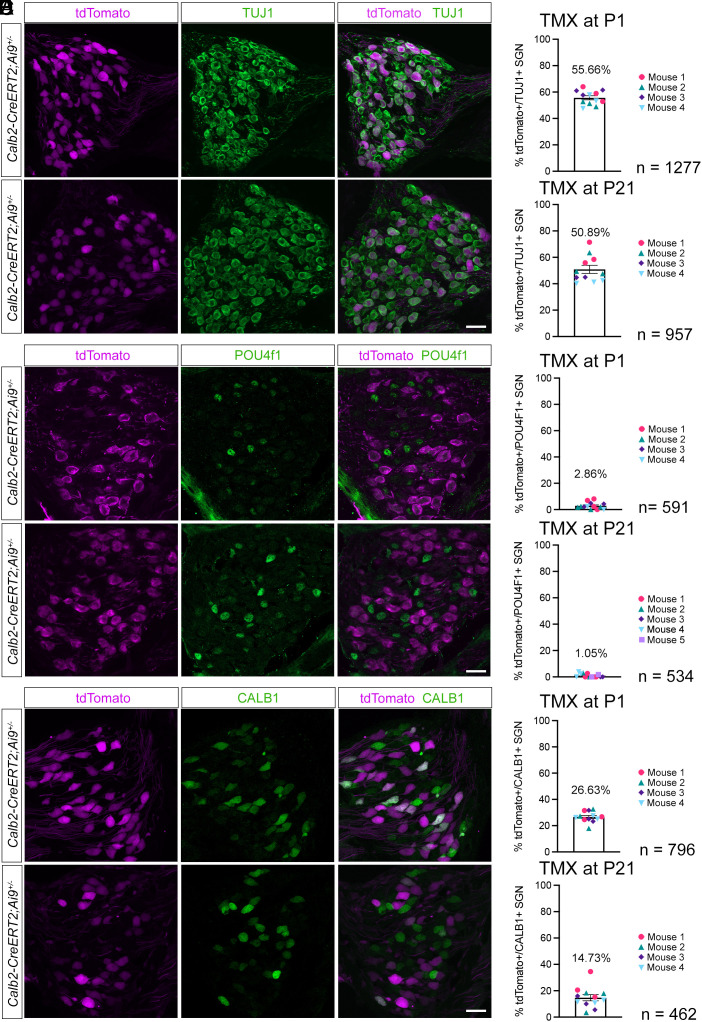
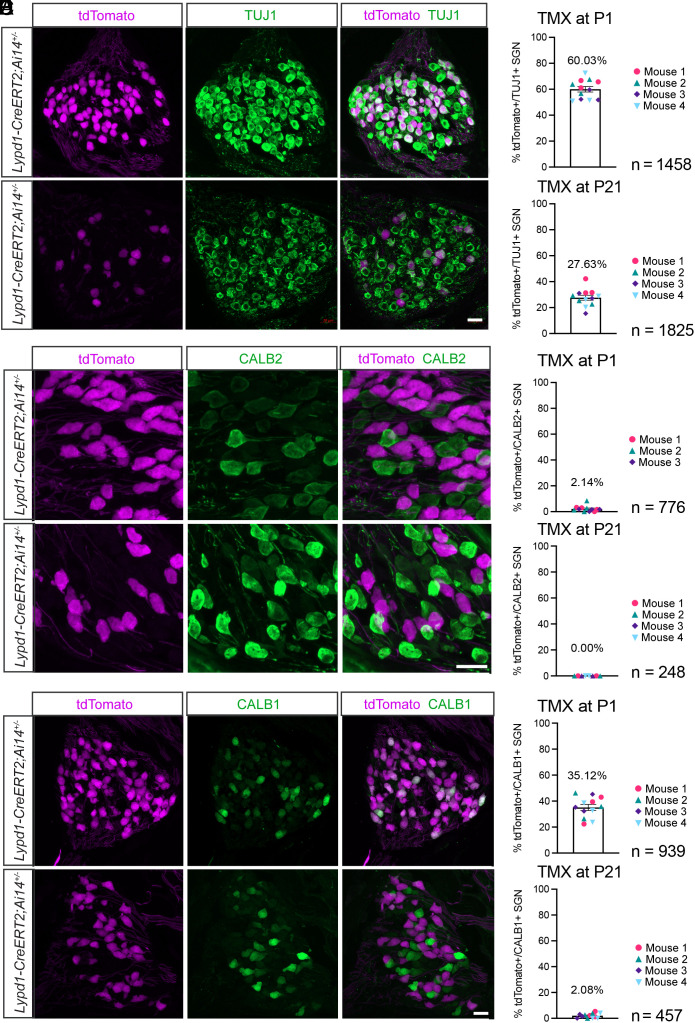
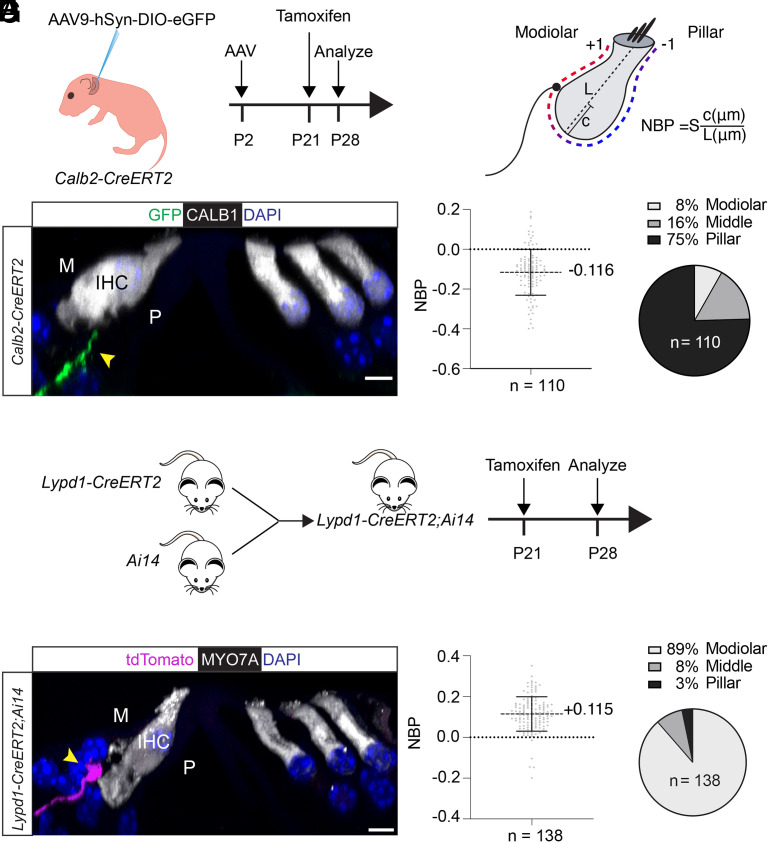
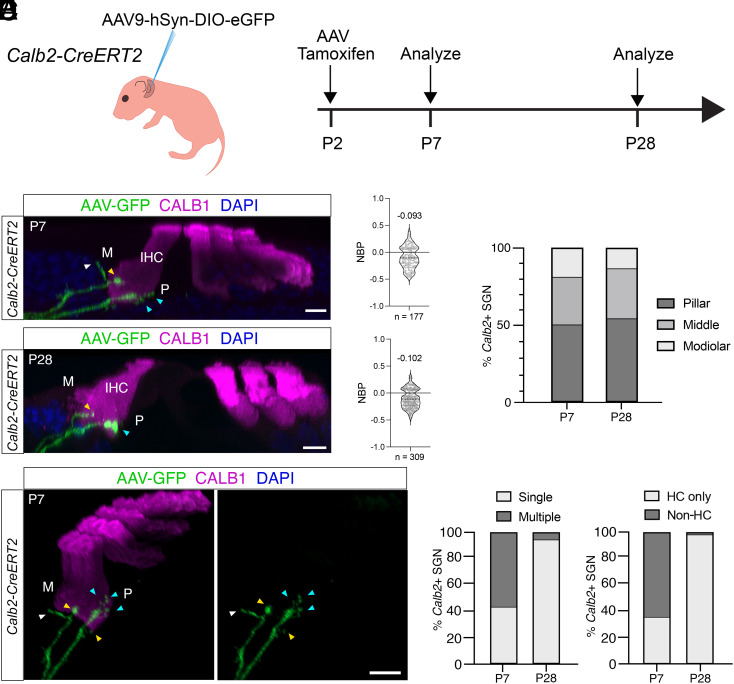
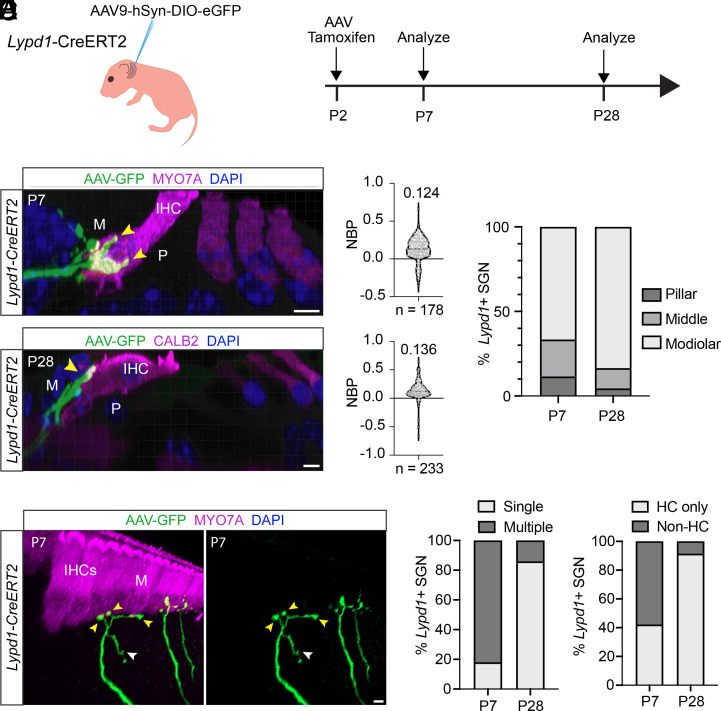
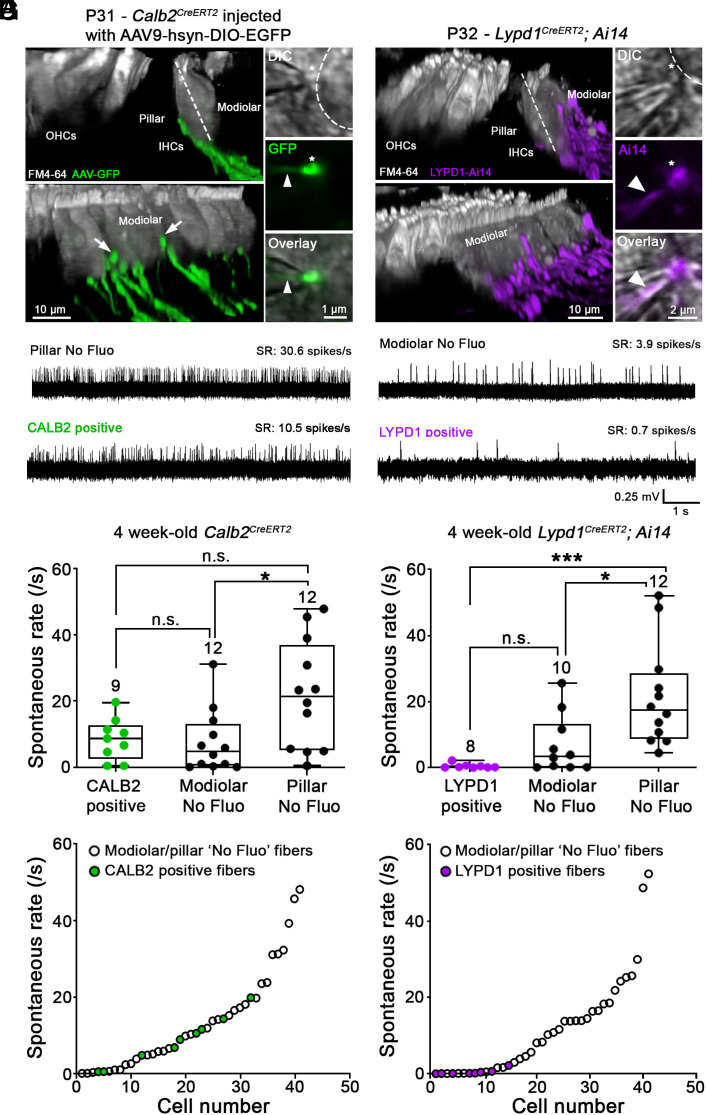
Type I spiral ganglion neurons (SGNs) are the auditory afferents that transmit sound information from cochlear inner hair cells (IHCs) to the brainstem. These afferents consist of physiological subtypes that differ in their spontaneous firing rate (SR), activation threshold, and dynamic range and have been described as low, medium, and high SR fibers. Lately, single-cell RNA sequencing experiments have revealed three molecularly defined type I SGN subtypes. The extent to which physiological type I SGN subtypes correspond to molecularly defined subtypes is unclear. To address this question, we have generated mouse lines expressing CreERT2 in SGN subtypes that allow for a physiological assessment of molecular subtypes. We show that Lypd1-CreERT2 expressing SGNs represent a well-defined group of neurons that preferentially innervate the IHC modiolar side and exhibit a narrow range of low SRs. In contrast, Calb2-CreERT2 expressing SGNs preferentially innervate the IHC pillar side and exhibit a wider range of SRs, thus suggesting that a strict stratification of all SGNs into three molecular subclasses is not obvious, at least not with the CreERT2 tools used here. Genetically marked neuronal subtypes refine their innervation specificity onto IHCs postnatally during the time when activity is required to refine their molecular phenotype. Type I SGNs thus consist of genetically defined subtypes with distinct physiological properties and innervation patterns. The molecular subtype-specific lines characterized here will provide important tools for investigating the role of the physiologically distinct type I SGNs in encoding sound signals.

Keywords: CreERT2; hair cell; hearing; inner ear; spiral ganglion neuron.


Conflict of interest statement

The authors declare no competing interest.

Figures

Fig. 1.
Fig. 1.
Generation and characterization of CreERT2 mice. (A) Diagram on the Left: cross-section of the cochlea: IHCs and OHCs. Diagram on the Right: Top view onto the cochlear epithelium showing IHCs, OHCs, SGNs type I (purple), SGNs type II (orange), and olivocochlear efferents (pink). (B) Diagram showing innervation of IHCs by SGNs with different spontaneous rates (SRs) along the modiolar to pillar axis. (C) Experimental strategy to label type IA and type IC SGNs using CreERT2 knock-in mouse lines. (D) Sections through the spiral ganglion of Lypd1-CreERT2;Ai14 mice and Calb2-CreERT2;Ai14 mice showing tdTomato expression (magenta) and stained with antibodies against TUJ1, POU4F1, or CALB2 (green). (E) Quantification of data in (D), % of tdTomato+ SGNs in Lypd1-CreERT2 (Top) and Calb2-CreERT2 (Bottom) mice that express POU4F1 or CALB2 (n = number of neurons assessed). (Scale bars: 20 μm.)
Fig. 2.
Fig. 2.
Developmental refinement of Calb2-CreERT2 expression. Sections through the spiral ganglions of P28 Calb2-CreERT2;Ai9 animals injected with tamoxifen (TMX) at either P1 or P21, stained with the indicated antibodies. Upper panels show sections from animals injected with TMX at P1, and Lower panels show sections from animals injected with TMX at P21. (A) Sections stained with antibodies against tdTomato (magenta) and TUJ1 (green). (B) Percentage of TUJ1+ cells colabeled with tdTomato after TMX injection at P1 versus P21. (C) Sections stained with antibodies against tdTomato (magenta) and POUF4F1 (green). (D) Percentage of tdTomato+ cells colabeled with POU4F1 after TMX injection at P1 versus P21. (E) Sections stained with antibodies against tdTomato (magenta) and CALB1 (green). (F) Percentage of tdTomato+ cells colabeled with CALB1 after TMX injection at P1 versus P21. (n = number of neurons assessed). (Scale bars: 20 μm.)
Fig. 3.
Fig. 3.
Developmental refinement of Lypd1-CreERT2 expression. Sections through the spiral ganglions of P28 Lypd1-CreERT2;Ai14 animals injected with tamoxifen (TMX) at either P1 or P21, stained with the indicated antibodies. Upper panels show sections from animals injected with TMX at P1, and Lower panels show sections from animals injected with TMX at P21. (A) Sections stained with antibodies against tdTomato (magenta) and TUJ1 (green). (B) Percentage of TUJ1+ cells colabeled with tdTomato after TMX injection at P1 versus P21. (C) Sections stained with antibodies against tdTomato (magenta) and CALB2 (green). (D) Percentage of tdTomato+ cells colabeled with CALB2 after TMX injection at P1 versus P21. (E) Sections stained with antibodies against tdTomato (magenta) and CALB1 (green) after TMX injection at P1 or P21. (F) Percentage of tdTomato+ cells colabeled with CALB1 after TMX injection at P1 versus P21 (n = number of neurons assessed). (Scale bars: 20 μm.)
Fig. 4.
Fig. 4.
Peripheral projection patterns of type I SGNs labeled by Calb2-CreERT2 and Lypd1-CreERT2 expression. (A) Diagram of experimental strategy to label nerve fibers in Calb2-CreERT2 animals. (B) Diagram of SGN type I innervation location assessment at the IHC using the method by Markowitz and Kalluri (18), NBP: normalized basal position; L: length of hair cell; c: distance between fiber ending position and basal pole of hair cell; S: set at +1 or −1 to define modiolar versus pillar, with a value of 0 for medial basal pole. (C) Representative example of P28 midcochlear section in a Calb2-CreERT2 animal; hair cells stained with CALB1 (white); a GFP-labeled fiber (green, arrow) innervates an IHC on the pillar side (P), nuclei are stained with DAPI (blue). (D) Quantification of innervation in P28 Calb2-CreERT2 animals; Left: NBP assessed across 110 virally labeled neurons from 3 animals; Right: modiolar versus pillar innervation assessed for 110 neurons from 3 animals. The fractional distance of the contact position from the basal pole of the hair cell was determined by dividing c by L and multiplying the resulting number by S (+1 or −1, for innervations on the modiolar or pillar sides of the bisecting plane, respectively; values for middle were at 0). (E) Diagram of experimental strategy to label nerve fibers in Lypd1-CreERT2;Ai14 animals. (F) Representative example of P28 midcochlear section in Lypd1-CreERT2;Ai14 animal; hair cells stained with MYO7A (white); a tdTomato-labeled fiber (magenta, arrow) innervates an IHC on the modiolar side (M), nuclei are stained with DAPI (blue). (G) Quantification of innervation in P28 Lypd1-CreERT2;Ai14 animals; Left: NBP assessed across 138 labeled fibers from 3 animals; Right: modiolar versus pillar innervation assessed across 138 labeled fibers from 3 animals. (Scale bar: 5 μm.)
Fig. 5.
Fig. 5.
Developmental analysis of peripheral projection patterns of type I SGNs labeled by Calb2-CreERT2 expression at P2. (A) Experimental strategy for assessment of projection refinement in Calb2-CreERT2 animals; Left: diagram of injection of AAV9-hSyn-DIO-eGFP into the posterior semicircular canal of Calb2-CreERT2 animals at P2; Right: experimental timeline. (B) Mid-cochlear sections of cochleae from Calb2-CreERT2 animals collected at P7 (Top) or P28 (Bottom); hair cells (magenta) including IHC labeled with indicated antibodies; modiolar (M) and pillar (P) sides of IHC highlighted; virally labeled fibers (green) indicated by arrows. (C) Quantification of innervation positions for virally labeled fibers from samples collected at P7 (Top) and P28 (Bottom) using NBP [see legend to Fig. 4; Markowitz and Kalluri (18)]. A total of 177 fibers and 309 fibers from three animals were evaluated at P7 and P28, respectively. (D) Quantification of modiolar versus pillar innervation for virally labeled fibers from samples collected at P7 (Left) and P28 (Right). (E) Innervation details for virally labeled fibers at P7 indicating excess contacts with IHC (yellow arrows), forming several branches on the modiolar (M) side of a single IHC (blue arrows) and projections away from IHC (white arrow). (F) Quantification of terminal peripheral projections by Calb2-CreERT2-labeled neurons at P7 versus P28; Left: % of Calb2-CreERT2+ neurons exhibiting single versus multiple terminal branches to IHCs at P7 (Left) or P28 (Right); Right: % of Calb2-CreERT2+ neurons with only branches terminating at IHCs (HC only) versus neurons that feature branches extending away from the IHC (Non-HC). (Scale bars: 5 μm.)
Fig. 6.
Fig. 6.
Developmental analysis of peripheral projection patterns of type I SGNs labeled by Lypd1-CreERT2 expression at P2. (A) Experimental strategy for assessment of projection refinement in Lypd1-CreERT2 animals; Left: diagram of injection of AAV9-hSyn-DIO-eGFP into the posterior semicircular canal of Lypd1-CreERT2 animals at P2; Right: experimental timeline. (B) Midcochlear sections of cochleae from Lypd1-CreERT2 animals collected at P7 (Top) or P28 (Bottom); hair cells (magenta) including IHC labeled with indicated antibodies; modiolar (M) and pillar (P) sides of IHC highlighted; virally labeled fibers (green) indicated by arrows. (C) Quantification of innervation positions for virally labeled fibers from samples collected at P7 (Top) and P28 (Bottom) using NBP [see legend to Fig. 4; Markowitz and Kalluri (18)]. A total of 178 fibers and 233 fibers from three animals were evaluated at P7 and P28, respectively. (D) Quantification of modiolar versus pillar innervation for virally labeled fibers from samples collected at P7 (Left) and P28 (Right). (E) Innervation details for virally labeled fibers at P7 indicating excess contacts with IHC (yellow arrows) and projections away from IHC (white arrow) on the modiolar (M) side. (F) Quantification of terminal peripheral projections by Lypd1-CreERT2-labeled neurons at P7 versus P28; Left: % of Lypd1-CreERT2+ neurons exhibiting single versus multiple terminal branches to IHCs at P7 (Left) or P28 (Right); Right: % of Lypd1-CreERT2+ neurons with only branches terminating at IHCs (HC only) versus neurons that feature branches extending away from the IHC (Non-HC). (Scale bars: 5 μm.)
Fig. 7.
Fig. 7.
Recording of spontaneous firing rates from SGN bouton endings in CALB2-CreERT2 and Lypd1-CreERT2 and mice. (A and B) Confocal z-stack reconstructions captured from live tissue of acutely excised apical turns of the organ of Corti at ~4 wk of age. Left, two side views at different angles showing OHCs and IHCs (gray). IHCs are contacted by fluorescing fibers, preferentially (A) on the pillar side in Calb2-CreERT2 mice that were injected with AAV9-hSyn-DIO-EGFP at P2 (green) and (B) on the modiolar side in Lypd1-CreERT2;Ai14 mice (magenta), followed by tamoxifen injection at P21. A few labeled nerve fibers in Calb2-CreERT2 mice can be observed contacting IHCs on the modiolar side (white arrows). Right, two-dimensional confocal snapshots of DIC view (Top), 488 nm (green) or 568 nm (magenta) fluorescence (Middle), and DIC and fluorescence overlayed (Bottom). The overlay shows a fluorescent bouton ending (asterisk) slightly invaginated into a pipette tip (arrow head) for loose-patch recording, thereby confirming the recording of labeled fiber in Calb2-CreERT2 (A) and Lypd1-CreERT2;Ai14 (B) mice. (C) Four example traces of extracellular loose-patch recordings for individual SGN fibers showing different SRs (CALB2+; LYPD1+; pillar and modiolar fibers without fluorescence (“No Fluo”). (D) Comparison of spontaneous firing rate between fibers labeled in Calb2-CreERT2 mice (green), modiolar No Fluo fibers (black) and pillar No Fluo fibers (black) obtained ~4-wk-old animals. Boxes represent the 10th to 90th percentile of the distribution and whiskers the minimum and maximum values. The horizontal line represents the median. (Kruskal–Wallis test with Dunn’s multiple comparison; n.s. not significant, *P < 0.05 and ***P < 0.001). (E) Comparison of SRs between fibers labeled in Lypd1-CreERT2;Ai14 mice (red), modiolar No Fluo fibers (black) and pillar No Fluo fibers (black) from ~4-wk-old animals. Same statistical tests as in (D). (F and G) Distribution of spontaneous firing rate from the lowest to the highest SR in Calb2-CreERT2 (F) and Lypd1-CreERT2;Ai14 (G) mouse lines; same data as in (D and E). Each dot corresponds to a single SGN bouton recording whereby green dots represent GFP+ fibers in Calb2-CreERT2 animals and red dots tdTomato+ fibers in Lypd1-CreERT2;Ai14 animals. Note that SRs of tdTomato+ fibers in Lypd1-CreERT2; Ai14 mice are observed at the lower end of the SR range, whereas SRs of GFP+ fibers in Calb2-CreERT2 mice occupy a wider middle range. ANF recordings were performed from 34 animals, 17 animals per mouse line. The number above each bar represents the number of recorded fibers.

References

    1. Sanes J. R., Masland R. H., The types of retinal ganglion cells: Current status and implications for neuronal classification. Annu. Rev. Neurosci. 38, 221–246 (2015). - PubMed
    1. Seabrook T. A., Burbridge T. J., Crair M. C., Huberman A. D., Architecture, function, and assembly of the mouse visual system. Annu. Rev. Neurosci. 40, 499–538 (2017). - PubMed
    1. Heil P., Peterson A. J., Basic response properties of auditory nerve fibers: A review. Cell Tissue Res. 361, 129–158 (2015). - PubMed
    1. Oxenham A. J., Plack C. J., A behavioral measure of basilar-membrane nonlinearity in listeners with normal and impaired hearing. J. Acoust. Soc. Am. 101, 3666–3675 (1997). - PubMed
    1. Reijntjes D. O. J., Pyott S. J., The afferent signaling complex: Regulation of type I spiral ganglion neuron responses in the auditory periphery. Hear Res. 336, 1–16 (2016). - PubMed

Publication types