. 2023 Aug;120(31):e2217795120.
doi: 10.1073/pnas.2217795120. Epub 2023 Jul 24.

Redefining the human corneal immune compartment using dynamic intravital imaging

Affiliations

Redefining the human corneal immune compartment using dynamic intravital imaging

Laura E Downie et al. Proc Natl Acad Sci U S A. 2023 Aug.

Abstract

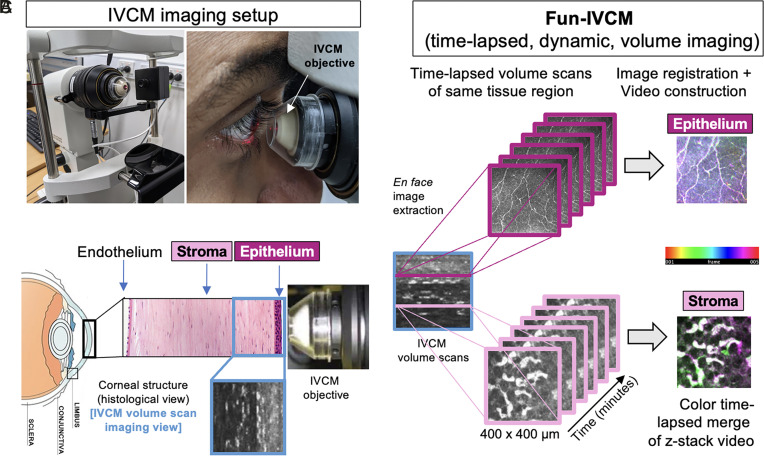
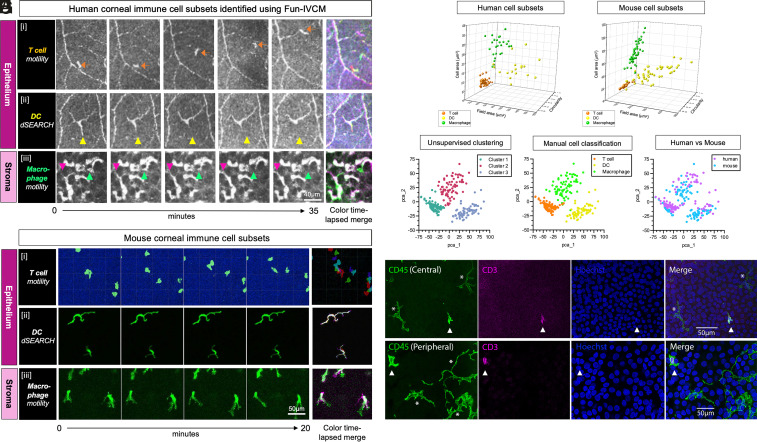
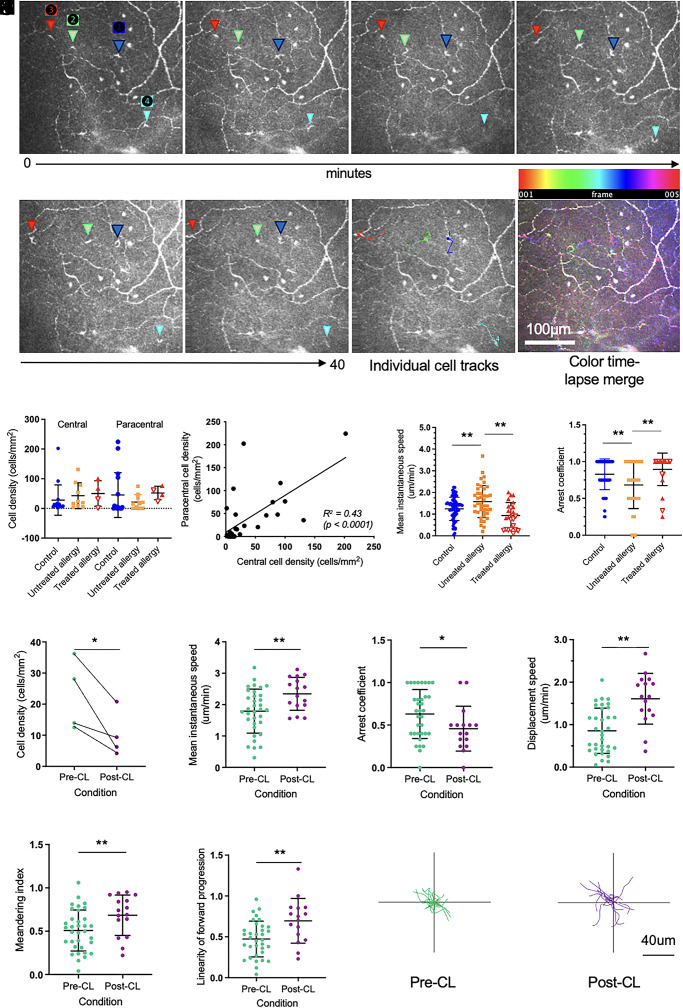
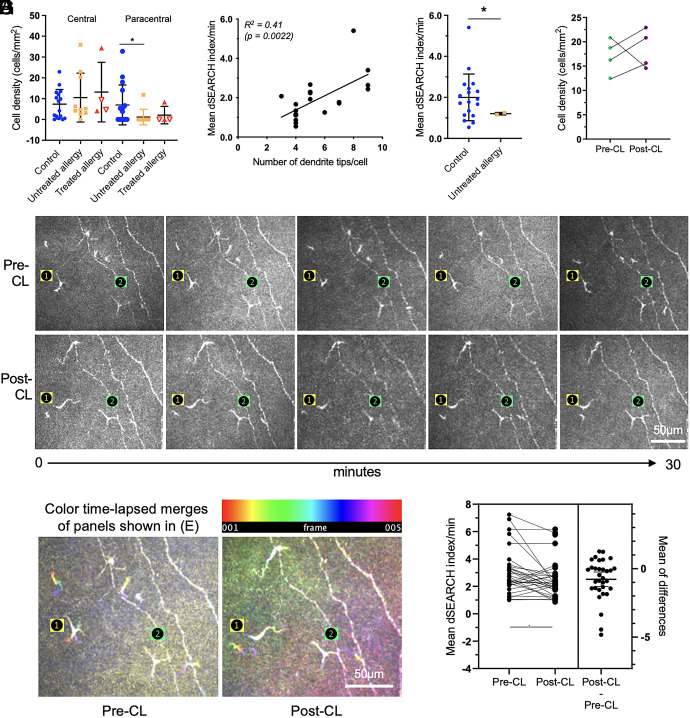
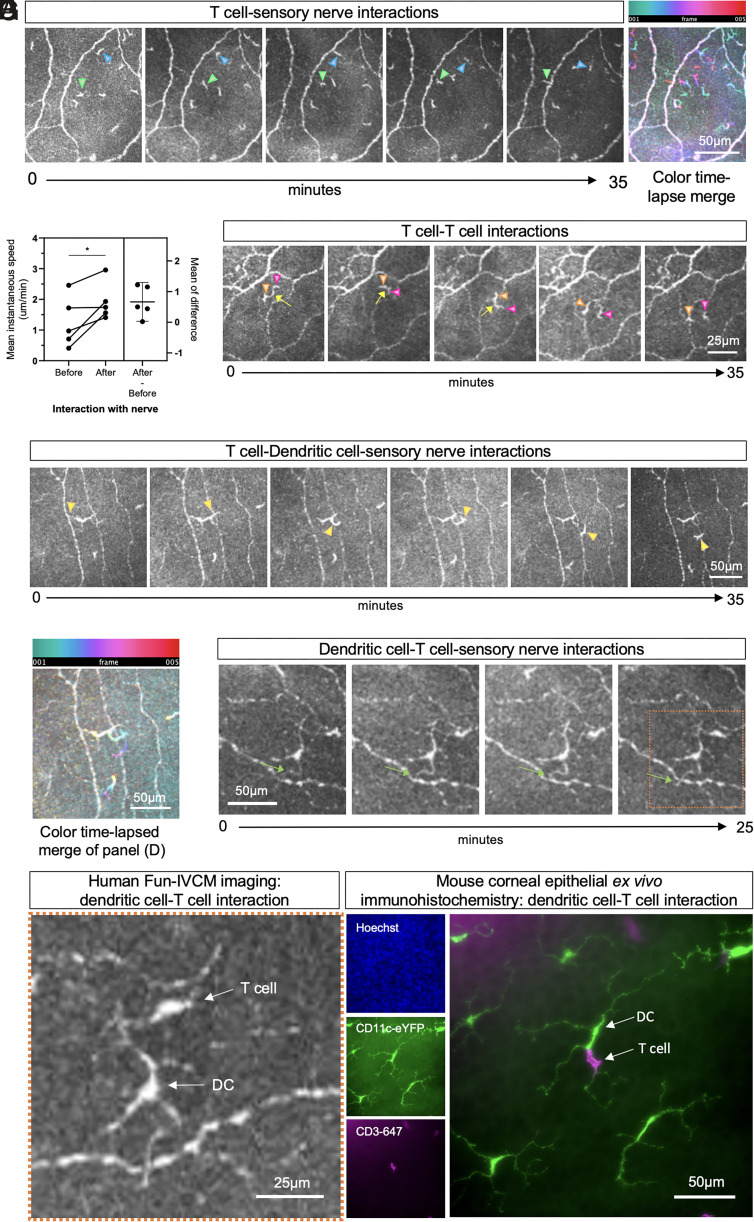
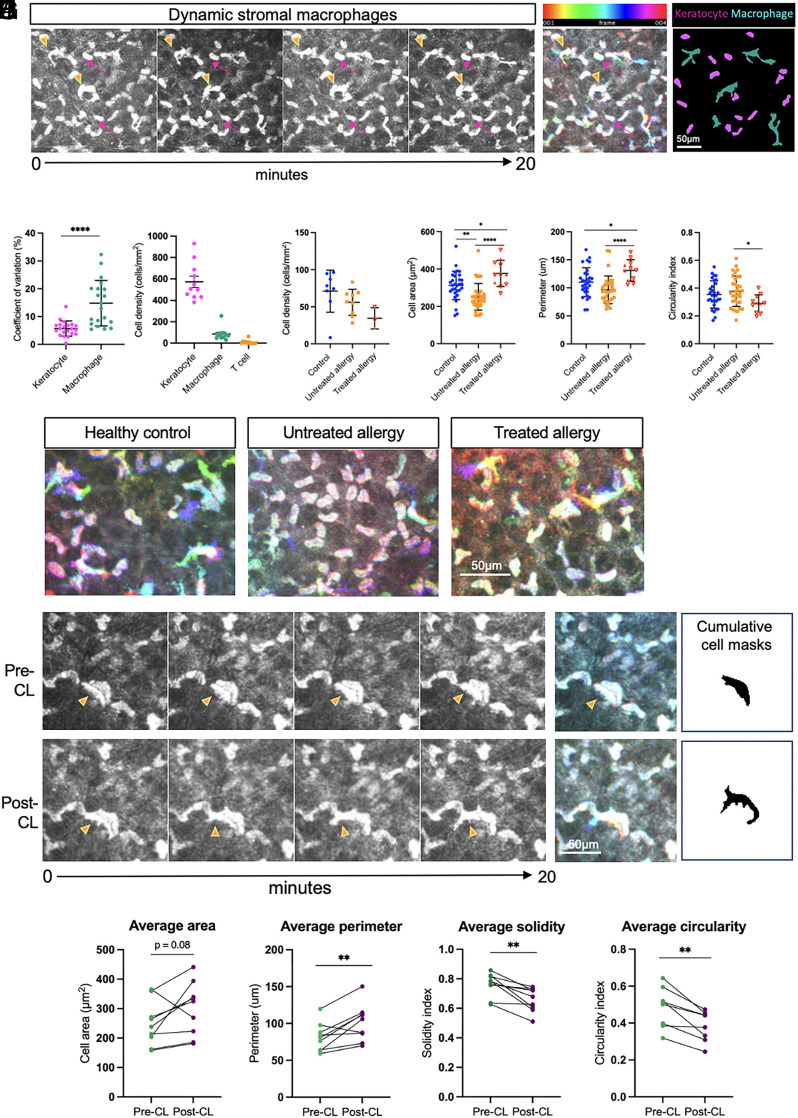
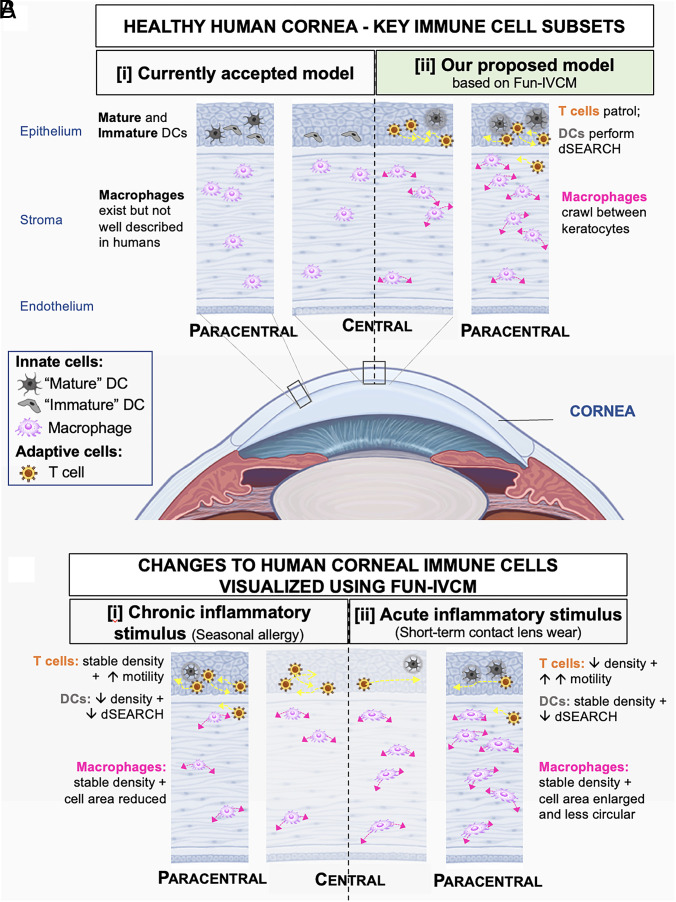
The healthy human cornea is a uniquely transparent sensory tissue where immune responses are tightly controlled to preserve vision. The cornea contains immune cells that are widely presumed to be intraepithelial dendritic cells (DCs). Corneal immune cells have diverse cellular morphologies and morphological alterations are used as a marker of inflammation and injury. Based on our imaging of corneal T cells in mice, we hypothesized that many human corneal immune cells commonly defined as DCs are intraepithelial lymphocytes (IELs). To investigate this, we developed functional in vivo confocal microscopy (Fun-IVCM) to investigate cell dynamics in the human corneal epithelium and stroma. We show that many immune cells resident in the healthy human cornea are T cells. These corneal IELs are characterized by rapid, persistent motility and interact with corneal DCs and sensory nerves. Imaging deeper into the corneal stroma, we show that crawling macrophages and rare motile T cells patrol the tissue. Furthermore, we identify altered immune cell behaviors in response to short-term contact lens wear (acute inflammatory stimulus), as well as in individuals with allergy (chronic inflammatory stimulus) that was modulated by therapeutic intervention. These findings redefine current understanding of immune cell subsets in the human cornea and reveal how resident corneal immune cells respond and adapt to chronic and acute stimuli.

Keywords: T cell; confocal; cornea; eye; macrophage.


Conflict of interest statement

L.E.D., X.Z., S.N.M., and H.R.C. are inventors on a patent relating to the imaging method described in this paper. National Health and Medical Research Council (NHMRC), APP1126540, funded the mouse experiments in this paper. There was no specific funding for the other aspects of this work.

Figures

Fig. 1.
Fig. 1.
Overview of the Fun-IVCM method. (A) Laser-scanning, IVCM setup with the Heidelberg HRT-3 with the Rostock Corneal Module, to acquire images of the human cornea (B), shown diagrammatically in histological cross-section [not to scale]. (C) The Functional IVCM (Fun-IVCM) method involves sequentially capturing high-resolution en face volume (z-stack) images [400(x) × 400(y) × 100(z) µm], spanning the basal layer of the corneal epithelium to the mid-stroma. Repeat volume scans of the same region are acquired every 4 to 7 min for a total of 25 to 40 min. En face images at the same tissue plane are extracted from the volume scans, registered to stationary landmarks, and time-lapsed videos are reconstructed at both the level of the corneal epithelium and anterior stroma.
Fig. 2.
Fig. 2.
Immune cell subsets defined using Fun-IVCM in healthy human corneas are comparable to phenotyped mouse corneal immune cell subtypes. (A) Sequential time-lapsed images acquired over 35 min, and a color time-lapsed merge, captured using Fun-IVCM to reveal the dynamic behaviors of putative [i] T cells (orange arrow tracks a single cell) that are motile in the human corneal epithelium; [ii] DCs showing dSEARCH behaviors (the yellow triangle is stationary and highlights active dendrite retraction); and [iii] macrophages in the corneal stroma that crawl between keratocyte nuclei (pink and green arrows highlight the alterations to cell position over the capture period). The scale bar applies to all images. (B) Sequential time-lapsed images and color time-lapsed merges for each of: [i] GFP+ T cells in the corneal epithelium of a mouse with ocular HSV infection, imaged in vivo using intravital 2-photon microscopy; [ii] CD11c-eYFP+ mouse corneal epithelial DCs, imaged ex vivo; [iii] CX3CR1-GFP+ corneal macrophages. The scale bar applies to all images. (C) 3D scatterplot showing the field area (µm) x circularity x solidity parameters for the three immune cell subsets in healthy human corneas, quantified from Fun-IVCM images. (D) An equivalent 3D scatterplot to (C), for phenotyped mouse corneal immune cells. Cell parameters were quantified from wholemount immunofluorescent images and show cell morphological characteristics that parallel the human corneal cell subsets imaged using Fun-IVCM. (E) 2D pca plot showing three clusters of immune cells determined by unsupervised clustering of normalized and pooled human and mouse imaging data using PhenoGraph. (F) Subtypes of immune cells determined manually from imaging data projected onto the pca scatter plot. (G) Human and mouse corneal immune cells projected onto the pca plot, revealing clustering by cell type not by species. (H) Wholemount immunostaining of human donor tissue showing CD45+ CD3+ T cells (triangles) and CD45+ CD3 dendriform cells (asterisks) present in the basal epithelium of the healthy central and peripheral corneal epithelium.
Fig. 3.
Fig. 3.
IELs dynamically patrol the corneal epithelium and are responsive to inflammatory stimuli. (A) Sequential time-lapsed images acquired over 40 min, with four individual cells noted (triangles labeled 1 to 4). Individual cell tracks and a color time-lapsed merge are also shown. The scale bar applies to all images. (B) Cell densities were similar in the central and paracentral cornea, and in control (n = 16 people), untreated allergy (n = 10 people), and treated allergy (n = 4 people; open triangles represent individuals treated with immunotherapy [n = 2], and closed triangles represent individuals treated with corticosteroids [n = 2]) eyes (P > 0.05 for all comparisons). (C) Cell density in the central and paracentral corneal regions was moderately correlated (R2 = 0.43, P < 0.0001). (D) Mean instantaneous cell speed was significantly higher in individuals with untreated allergy (n = 41 cells), relative to speeds evident in both healthy control (n = 65 cells) and treated allergy (n = 24 cells) eyes. (E) The mean arrest coefficient was significantly lower in individuals with untreated allergy, relative to both healthy control and treated allergy eyes. (F) After short-term CL wear, there were significantly fewer cells in the paracentral corneal epithelium relative to pre-CL levels. Post-CL wear, cells showed a faster mean instantaneous speed (G), lower arrest coefficient (H), higher displacement speed (I), higher meandering index (J), and higher linearity of forward progression (K). Individual cell tracks prior to CL wear (pre-CL) (L), and after 3 h of CL wear (post-CL) (M), after normalization of starting positions to the origin. Data are plotted as mean ± SD. *P < 0.05; **P < 0.01.
Fig. 4.
Fig. 4.
DCs use their dendrites to dynamically survey the human corneal epithelium and show muted responses when exposed to inflammatory stimuli. (A) Cell densities were similar across participant groups (healthy, n = 16; untreated allergy, n = 10; treated allergy, n = 4 comprising individuals treated with immunotherapy [open triangles, n = 2] and individuals treated with corticosteroids [closed triangles, n = 2]) in the central cornea (P > 0.05). In individuals with untreated allergy, there were fewer DCs in the paracentral cornea relative to healthy controls (P < 0.05). (B) DCs with more dendritic complexity (tips/cell) generally had a higher mean dSEARCH index per minute (R2 = 0.41, P = 0.0022). (C) Mean normalized dSEARCH was lower in cells in individuals with untreated allergy (n = 2 cells), relative to healthy controls (n = 18 cells). (D) Cell numbers were unchanged after 3 h of CL wear. (E) Sequential time-lapsed images acquired over 30 min, with two individual cells noted (labeled 1 and 2), at the pre-CL (Upper row) and post-CL (Lower row) time points. Cell 1 underwent a shift in its dendritic orientation post-CL wear, whereas the overall dendritic conformation of cell 2 was unchanged. The scale bar applies to all images. (F) Color time-lapsed merges of the Upper and Lower panels shown in (E), respectively. The pre-CL merge shows more obvious dSEARCH activity (Cell 1 > 2), which was reduced in the post-CL merge. Data are plotted as mean ± SD. The scale bar applies to both images. (G) Data for matched cells (n = 32), analyzed pre-CL vs. post-CL wear, show that the normalized average dSEARCH index was lower post-CL wear. *P < 0.05.
Fig. 5.
Fig. 5.
Fun-IVCM captures dynamic immune cell-to-cell interactions and neuroimmune interactions in the human cornea. (A) Sequential time-lapsed images of the corneal epithelium, acquired over 35 min, showing examples of a T cell crossing a sensory nerve axon (green triangle) and a separate cell “kissing” a nerve before rebounding back to its original location (blue arrow). A color time-lapsed merge highlights the cell motility dynamics. The scale bar applies to all images. (B) Plot of data for matched cells seen to “kiss” nerves (n = 5), showing the cells to have a higher mean instantaneous speed after their interaction with a nerve (“After”) relative to approaching the nerve (“Before”). (C) Sequential time-lapsed images showing an example of two motile T cells (orange and pink triangles) that appear to maintain contact with each other for several minutes. The scale bar applies to all images. (D) Sequential time-lapsed images, and a corresponding color time-lapsed merge (E), showing dynamic interactions between a T cell, DC, and nerve axon. (F) Sequential time-lapsed images showing a DC dendrite dynamically moving across a nerve axon (green arrow). The scale bar applies to all images. (G) The left images show a magnified Inset (orange box) of the final image in panel (F), to highlight a DC–T cell interaction in the human cornea using Fun-IVCM. The right images show wholemount immunofluorescent images from a mouse corneal epithelium, stained for cell nuclei (Hoechst), DCs (CD11c-eYFP), and T cells (CD3+); the DC–T cell interaction mirrors the appearance of the in vivo human corneal imaging shown in (G).
Fig. 6.
Fig. 6.
Putative stromal macrophages are morphologically and behaviorally distinct from resident tissue keratocytes and are affected by allergy and acute stimulation elicited by CL wear. (A) Sequential time-lapsed images of the anterior stroma in a healthy control cornea over a 20-min period. Stationary keratocytes (pink arrows) and motile cells (orange arrowheads) demonstrate differential behaviors. A color-coded hyperstack shows cytoplasmic displacement in macrophages, and cumulative cell masks show small-shaped keratocytes (magenta) compared to ameboid-shaped macrophages (cyan). (B) The coefficient of variation of cell shape over time was higher in macrophages compared to keratocytes. (C) Keratocytes represent the major cell type in the anterior stroma, followed by macrophages and T cells. (D) There was a similar density of stromal macrophages in individuals with untreated and treated allergy compared to healthy controls. Per cell analysis plots of cell area (E), perimeter (F), and circularity (G) show differences in the morphology of stromal macrophages in control vs. treated and untreated allergy. (H) Representative time-lapse color-coded hyperstacks of stromal macrophages in healthy control, untreated allergy, and treated allergy individuals. (I) Time-lapse image sequence and corresponding color-coded hyperstacks and cumulative cell area masks of a stromal macrophage pre-CL (Top row) and post-CL (Bottom row). (J) Repeated measures comparisons of the area, perimeter, solidity, and circularity of the same stromal macrophages (n = 9) were quantified pre-CL and post-CL. Scale bars are as indicated. Data are plotted as mean ± SD. *P < 0.05; **P < 0.01, ***P < 0.001, ****P < 0.0001.
Fig. 7.
Fig. 7.
(A) [i] The currently accepted model of the principle immune cell subsets in the healthy human cornea, involving “mature” and “immature” DCs in the epithelium (as imaged using traditional static IVCM) and macrophages in the stroma. [ii] Based on our Fun-IVCM data, we posit a role for adaptive immune cells (T cells) in homeostatic human corneal immune surveillance. Using Fun-IVCM, we identify motile T cells that patrol the epithelium and DCs that show cyclic dSEARCH behaviors; these immune cell subsets interact with each other (cell-to-cell interaction) and with sensory nerves (neuroimmune interaction). In the corneal stroma, macrophages were observed to crawl between keratocytes and to use membrane extensions consistent with the lamellipodia and/or filopodia of macrophages in other tissues. (B) Fun-IVCM enables insight into the in vivo effects of [i] chronic and [ii] acute inflammation on the distribution, morphology, and dynamic behaviors of corneal immune cell subsets. [i] In humans with symptomatic untreated seasonal allergy, T cell motility was enhanced, DC numbers were reduced, and the DCs that were present showed reduced tissue surveillance. Macrophages showed reduced cell areas. [ii] In response to an acute proinflammatory ocular surface stimulus (CL wear), epithelial T cells enhanced their motility and are reduced in density in the paracentral cornea; DCs show reduced dSEARCH. Stromal macrophages changed their morphological conformation, with an increased number of cellular protrusions, larger cell area, and reduction in circularity. Note: Diagrams are not to scale.

References

    1. Chinnery H. R., Zhang X. Y., Wu C. Y., Downie L. E., Corneal immune cell morphometry as an indicator of local and systemic pathology: A review. Clin. Exp. Ophthalmol. 49, 729–740 (2021). - PubMed
    1. Hamrah P., Zhang Q., Liu Y., Dana M. R., Novel characterization of MHC class II-negative population of resident corneal Langerhans cell-type dendritic cells. Invest. Ophthalmol. Vis. Sci. 43, 639–646 (2002). - PubMed
    1. Hamrah P., Huq S. O., Liu Y., Zhang Q., Dana M. R., Corneal immunity is mediated by heterogeneous population of antigen-presenting cells. J. Leukoc. Biol. 74, 172–178 (2003). - PubMed
    1. Hamrah P., Liu Y., Zhang Q., Dana M. R., The corneal stroma is endowed with a significant number of resident dendritic cells. Invest. Ophthalmol. Vis. Sci. 44, 581–589 (2003). - PubMed
    1. Jiao H., et al. , Topographical and morphological differences of corneal dendritic cells during steady state and inflammation. Ocul. Immunol. Inflamm. 28, 898–907 (2020). - PubMed

Publication types

LinkOut - more resources