. 2023 Aug;33(8):1242-1257.
doi: 10.1101/gr.277755.123. Epub 2023 Jul 24.

Cytosolic and mitochondrial translation elongation are coordinated through the molecular chaperone TRAP1 for the synthesis and import of mitochondrial proteins

Affiliations

Cytosolic and mitochondrial translation elongation are coordinated through the molecular chaperone TRAP1 for the synthesis and import of mitochondrial proteins

Rosario Avolio et al. Genome Res. 2023 Aug.

Abstract

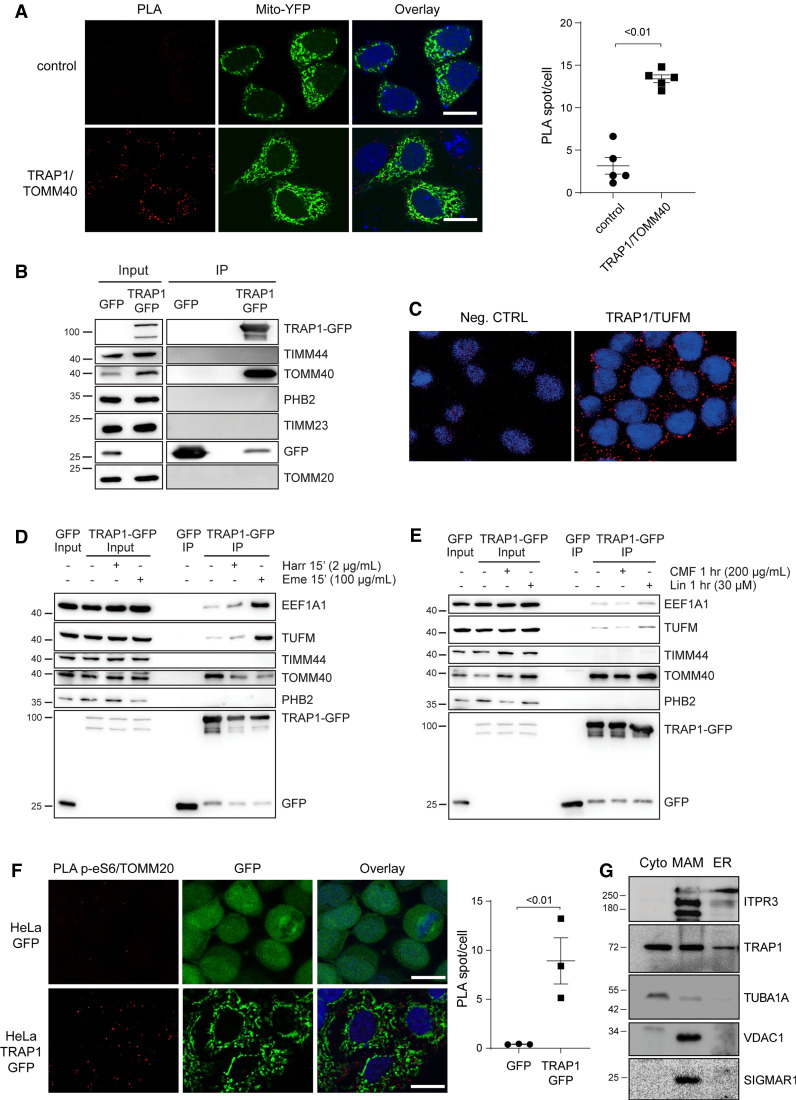
A complex interplay between mRNA translation and cellular respiration has been recently unveiled, but its regulation in humans is poorly characterized in either health or disease. Cancer cells radically reshape both biosynthetic and bioenergetic pathways to sustain their aberrant growth rates. In this regard, we have shown that the molecular chaperone TRAP1 not only regulates the activity of respiratory complexes, behaving alternatively as an oncogene or a tumor suppressor, but also plays a concomitant moonlighting function in mRNA translation regulation. Herein, we identify the molecular mechanisms involved, showing that TRAP1 (1) binds both mitochondrial and cytosolic ribosomes, as well as translation elongation factors; (2) slows down translation elongation rate; and (3) favors localized translation in the proximity of mitochondria. We also provide evidence that TRAP1 is coexpressed in human tissues with the mitochondrial translational machinery, which is responsible for the synthesis of respiratory complex proteins. Altogether, our results show an unprecedented level of complexity in the regulation of cancer cell metabolism, strongly suggesting the existence of a tight feedback loop between protein synthesis and energy metabolism, based on the demonstration that a single molecular chaperone plays a role in both mitochondrial and cytosolic translation, as well as in mitochondrial respiration.


Figures

Figure 1.
Figure 1.
TRAP1 is associated with both cytosolic and mitochondrial ribosomes. (A,B) Polysome profiling absorbance, measured at 254 nm, of HeLa cell extracts, from untreated cells (A) or following a 5-min treatment with 2 µg/mL harringtonine (B). Fractions 1 and 2 are free cytosolic proteins or light complexes; fractions from 3 to 6, ribosomal subunits (60S, 40S) and monomer (80S); and fractions from 7 to 12, polysomes. Proteins from each fraction were analyzed by WB with the indicated antibodies. (C) Subcellular fractionation of HeLa cells showing the presence of indicated proteins into cytosolic (cyto) and mitochondrial (mito) fractions. VCL and GAPDH have been used as markers of cytosol and UQCRFS1 as a marker of mitochondria. (D) HeLa cell mitochondria were isolated, lysed, and loaded onto a 10%–30% linear sucrose gradient, followed by fractionation. Proteins were precipitated from the resulting fractions and subjected to western blot with indicated antibodies. (E) Representative image of PLA showing the interaction between TRAP1 and MRPL12 in HeLa mitochondria. Positive signals of interaction are shown as red dots; nuclei are stained with DAPI (blue); and mitochondria are marked by the mitochondria-directed YFP (green). The control PLA has been obtained by hybridizing with anti-TRAP1 only as primary antibody. Scale bar, 10 µm. The graph shows the average number of PLA spot/cell, with a P-value representing the statistical significance based on the Student's t-test (n = 6).
Figure 2.
Figure 2.
TRAP1 expression has opposite effects on total cell versus mitochondrial mRNA translation. (A) Representative autoradiography of total lysates from cells labeled with 35S Met/35S Cys, following tetracycline-induced induction of TRAP1-directed shRNA and control shRNA (72-h) cells or of TRAP1–GFP and unfused control GFP (24-h) cells, with relative densitometric band intensities and analysis (right). The P-values in the graph indicate the statistical significance based on the Student's t-test (n = 3). (B) Mito-FUNCAT-gel. Expression of GFP (control)-directed and TRAP1-directed shRNAs was induced in HeLa cells with tetracycline 72 h before labeling with 100 µM HPG-alkyne for 2 h. The resulting lysates were subjected to a click reaction with a TAMRA-azide, loaded for SDS-PAGE, and detected at 550 nm. (C) RT-qPCR performed on RNAs extracted from mitoribosomal fractions (4–11) isolated from HeLa cells 72 h after induction of shGFP/shTRAP1. The amount of mitoribosome-associated mRNA in the two samples has been normalized on 12S rRNA and corrected for its total expression level. Data are expressed as mean ±SEM (n = 5). Numbers above bars represent the statistical significance (P-value) based on the one-sample t-test. (D) Subcellular fractionation of HeLa cells showing the presence of indicated proteins into cytosolic (cyto) and mitochondrial (mito) fractions. (E) eGFP in vitro translation using wheat germ extracts. eGFP mRNA was added to reactions at a final concentration of 21.95 ng/μL. Where indicated, 0.3 μg/μL of TRAP1 recombinant protein (rTRAP1) was added to the reaction. Data are expressed as mean ± SEM (n = 14 for the translation of uncapped eGFP mRNA; n = 7 for the translation of capped eGFP mRNA). The two-tailed P-value represents the statistical significance based on the Student's t-test. (F) eGFP in vitro translation using E. coli extracts. eGFP mRNA was added to reactions at a final concentration of 21.95 ng/μL. Where indicated, 0.2 μg/uL of TRAP1 recombinant protein was added to the reaction. Data are expressed as mean ± SEM (n = 6). The P-value represents the statistical significance based on the Student's t-test.
Figure 3.
Figure 3.
TRAP1 associates with the mitochondrial protein import machinery and could favor localized translation. (A) Representative images of PLA positivity between TRAP1 and TOMM40. Positive signals of interaction are shown as red dots; nuclei are stained with DAPI (blue); and mitochondria are marked by the mitochondria-directed YFP (green). Scale bar, 10 µm. The graph shows the average number of PLA spots/cell, with a two-tailed P-value representing the statistical significance based on the Student's t-test (n = 5). (B) Immunoprecipitation of unfused GFP and TRAP1–GFP performed in HeLa cells following 24-h induction of GFP and TRAP1–GFP. Total lysates were incubated with GFP-trap beads to isolate the proteins, and the resulting samples were immunoblotted with indicated antibodies. (C) Representative image of PLA showing the interaction of TRAP1 with TUFM in HCT116 cells. Positive signals of interaction are shown as red dots; nuclei are stained with DAPI (blue). A negative control has been obtained by hybridizing cells with TRAP1 antibody only. (D,E) Immunoprecipitation of unfused GFP and TRAP1–GFP performed in HeLa cells following 24-h induction of GFP and TRAP1–GFP. Where indicated, cells were treated for 15 min with emetine (100 µg/mL) or harringtonine (2 µg/mL) or for 1 hr with chloramphenicol (200 µg/mL) or linezolid (30 µM). Total lysates were incubated with GFP-trap beads to isolate the proteins, and the resulting samples were immunoblotted with indicated antibodies. (F) Representative image of PLA showing the interaction of TOMM20 with phosphorylated (active) ribosomal protein RPS6 in HeLa cells following 24 h induction of TRAP1–GFP or unfused GFP. Positive signals of interaction are shown as red dots; nuclei are stained with DAPI (blue). Scale bar, 10 µm. The graph shows the average number of PLA spots/cell, with a P-value representing the statistical significance based on the Student's t-test (n = 3). (G) Cytosolic, MAM, and ER fractions isolated from HCT116 cells probed with the indicated antibodies.
Figure 4.
Figure 4.
TRAP1 binds both cytosolic and mitochondrial translation elongation factors and slows down elongation rate. (A) Fluorescent confocal microscopy analysis of TRAP1-Cy3 (acceptor) and EEF1G-Cy2 (donor) in HeLa cells. Dipole–dipole energy transfer from the fluorescent donor to the fluorescent acceptor allowed calculating FRET efficiency (EFRET %) as described in the Methods section. The overlay images show the inset area in which FRET has been analyzed. Scale bar, 10 µm. τns values are expressed as mean ± SEM. The two-tailed P-value represents the statistical significance based on the Student's t-test. (B) Fluorescent confocal microscopy analysis of TRAP1–GFP (donor) and TUFM-Cy3 (acceptor) in TRAP1–GFP-inducible HeLa cells. Dipole–dipole energy transfer from the fluorescent donor to the fluorescent acceptor allowed calculating FRET efficiency (EFRET %) as described in the Methods section. The overlay images show the inset area in which FRET has been analyzed. Scale bar, 10 µm. τns values are expressed. (C) TRAP1 inhibits EF-Tu release from the 70S initiation complex (70SIC) in stopped-flow assays. TRAP1 recombinant protein was preincubated with a ternary complex (TC) in which EF-Tu is labeled with the QSY9 fluorescence quencher (QSY-TC; purple trace), and the resulting solution was rapidly mixed with a Cy3-labeled 70S initiation complex (Cy3-70SIC; blue trace). The change in Cy3 fluorescence was monitored using a stopped-flow fluorometer. Upon entering in the A site, the quencher-labeled EF-Tu decreases the Cy3-labeled ribosome fluorescence, whereas its dissociation from the ribosome allows Cy3 fluorescence recovery. Black trace indicates negative control; red trace, positive control. The graph on the right shows the ratio of fluorescence increase in the presence of added TRAP1 to the fluorescence increase in the absence of TRAP1 in three independent experiments. The P-value represent the statistical significance based on the one-sample t-test. (D) Seventy-two hours after tet-induction shGFP-directed (control) or TRAP1-directed shRNAs, HeLa cells were treated with harringtonine (2 µg/mL) for the indicated times (0, 1, 2, 3, and 5 min) and subsequently treated with puromycin (10 μg/mL) for 10 min. Cells were lysed and subjected to immunoblotting with antipuromycin antibody. The graph shows densitometric intensity of the puromycin labeling, normalized on the total protein content (quantified by no-stain labeling; see Methods). Data are represented as mean ± SEM from eight independent experiments, with trend lines showing exponential one-phase decay analysis. P-value on the graph represents the statistical significance based on the extra sum-of-squares F-test.
Figure 5.
Figure 5.
TRAP1 slows down translation elongation by cytoplasmic ribosomes. (A,B) Polysome profiling absorbance, measured at 254 nm, of extracts from ACTIN-FLAG (control) and TRAP1-FLAG overexpressing HeLa cells (A) and from shGFP (control) and shTRAP1 HeLa cells (B), 24 h (A) or 72 h (B) after induction, in the absence (left) or presence (right) of 2 µg/mL of harringtonine (cells were treated for 2 min and then blocked with cycloheximide). Inset areas show magnification of regions of interest. (C) Ratio between polysome-associated and monosome-associated mRNAs following harringtonine treatment (2 µg/mL, 2 min), normalized on the respective untreated samples. The amount of the associated transcripts was measured by RT-qPCR performed on RNAs extracted from pooled monosomal and polysomal fractions, both corrected for an external reference spike-in RNA (luciferase). Data are represented as mean ± SEM from three independent experiments. Numbers above bars represent the statistical significance (P-value) calculated by a multiple t-test.
Figure 6.
Figure 6.
TRAP1 is coexpressed with the mitochondrial translational machinery. (A) Network analysis of the top 100 TRAP1-coexpressed genes, generated by STRING using a Markov cluster (MCL) algorithm. Network nodes represent proteins; edges represent protein–protein associations, by coexpression (black line), experimentally determined association (pink line), or database-curated association (blue line). Edges between clusters are represented by dotted lines. The red cluster is enriched in mitochondrial electron transport components; pink and yellow clusters are constituted by structural component of the mitochondrial ribosome (small and large subunit, respectively); the green cluster contains the mitochondrial prohibitin complex; and the purple cluster is constituted by the association between the mitochondria protein import inner membrane translocase subunit PAM16 and the mitochondrial-processing peptidase subunit alpha PMPCA. (B) Gene set enrichment analysis on the list of genes significantly coexpressed with TRAP1 in human tissues. (C) Coexpression analysis performed with COXPRESdb between TRAP1 and TUFM. (D) Coexpression analysis between TRAP1 and TUFM at protein level according to the Provisional database. (E) Coexpression analysis performed with COXPRESdb between TRAP1 and CLUH.

Update of

References

    1. Aagaard L, Amarzguioui M, Sun G, Santos LC, Ehsani A, Prydz H, Rossi JJ. 2007. A facile lentiviral vector system for expression of doxycycline-inducible shRNAs: knockdown of the pre-miRNA processing enzyme Drosha. Mol Ther 15: 938–945. 10.1038/sj.mt.6300118 - DOI - PubMed
    1. Albanèse V, Yam AY-W, Baughman J, Parnot C, Frydman J. 2006. Systems analyses reveal two chaperone networks with distinct functions in eukaryotic cells. Cell 124: 75–88. 10.1016/j.cell.2005.11.039 - DOI - PubMed
    1. Amoroso MR, Matassa DS, Laudiero G, Egorova AV, Polishchuk R, Maddalena F, Piscazzi A, Paladino S, Sarnataro D, Garbi C, et al. 2012. TRAP1 and the proteasome regulatory particle TBP7/Rpt3 interact in the endoplasmic reticulum and control cellular ubiquitination of specific mitochondrial proteins. Cell Death Differ 19: 592–604. 10.1038/cdd.2011.128 - DOI - PMC - PubMed
    1. Amoroso MR, Matassa DS, Sisinni L, Lettini G, Landriscina M, Esposito F. 2014. TRAP1 revisited: novel localizations and functions of a ‘next-generation’ biomarker (review). Int J Oncol 45: 969–977. 10.3892/ijo.2014.2530 - DOI - PubMed
    1. Argüello RJ, Simoes MR, Mendes A, Camosseto V, Torres AG, de Pouplana LR, van de Pavert SA, Gatti E, Pierre P. 2018. SunRiSE: measuring translation elongation at single cell resolution by flow cytometry. J Cell Sci 131: jcs214346. 10.1242/jcs.214346 - DOI - PubMed

Publication types

MeSH terms