. 2023 Jul 24;14(1):4447.
doi: 10.1038/s41467-023-40105-3.

ORC1 binds to cis-transcribed RNAs for efficient activation of replication origins

Affiliations

ORC1 binds to cis-transcribed RNAs for efficient activation of replication origins

Aina Maria Mas et al. Nat Commun. .

Abstract

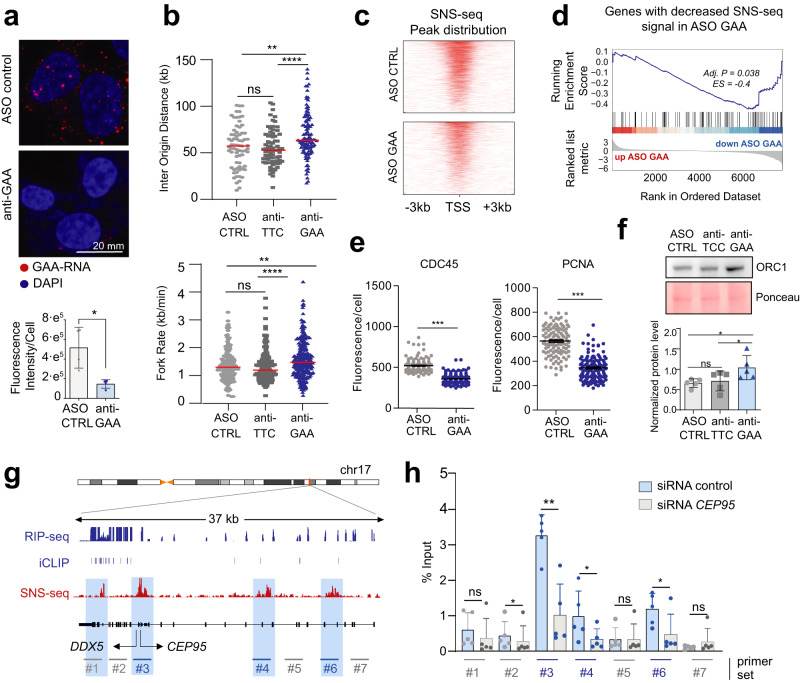
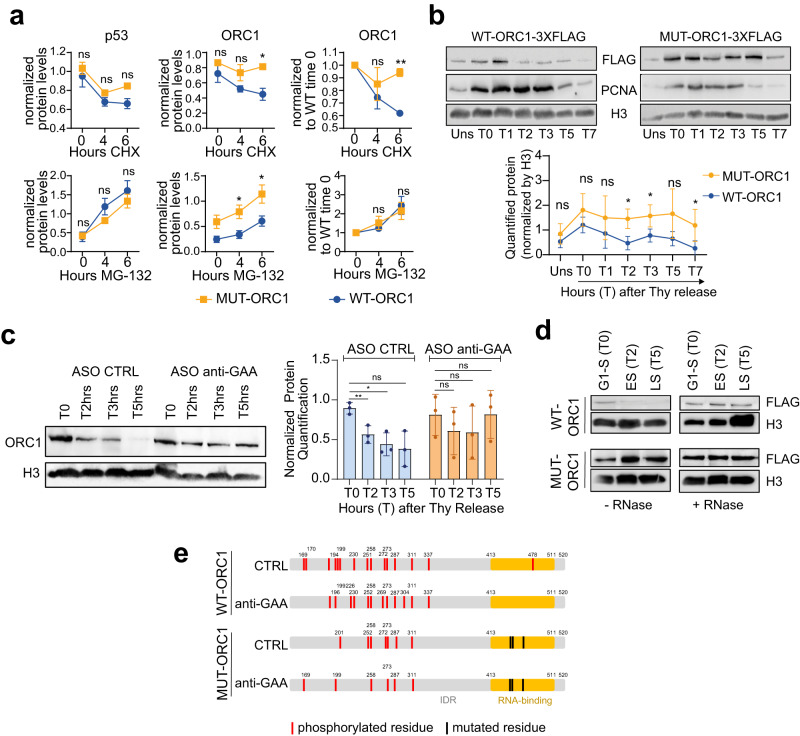
Cells must coordinate the activation of thousands of replication origins dispersed throughout their genome. Active transcription is known to favor the formation of mammalian origins, although the role that RNA plays in this process remains unclear. We show that the ORC1 subunit of the human Origin Recognition Complex interacts with RNAs transcribed from genes with origins in their transcription start sites (TSSs), displaying a positive correlation between RNA binding and origin activity. RNA depletion, or the use of ORC1 RNA-binding mutant, result in inefficient activation of proximal origins, linked to impaired ORC1 chromatin release. ORC1 RNA binding activity resides in its intrinsically disordered region, involved in intra- and inter-molecular interactions, regulation by phosphorylation, and phase-separation. We show that RNA binding favors ORC1 chromatin release, by regulating its phosphorylation and subsequent degradation. Our results unveil a non-coding function of RNA as a dynamic component of the chromatin, orchestrating the activation of replication origins.


Conflict of interest statement

The authors declare no competing interests.

Figures

Fig. 1
Fig. 1. ORC1 binds in vivo to RNAs produced from active replication origins.
a Schematic representation of human ORC1 protein domains,,. b Cross-correlation between endogenous ORC1, and unlabeled (control) or EU-labeled RNA (short or long pulse), comparing STORM experimental (EXP) and randomized (RND) analysis in the chromatin fraction of U2OS cells synchronized in G1. Data were presented as mean values (n > 50 cells). Indicated p values (ns denoting p value >0.05) derive from unpaired two-sample t-test. c Schematic of RIP-seq and iCLIP experimental approaches, where endogenous or Flag-tagged ORC1 is immunoprecipitated from native or UV-crosslinked nuclear extracts, followed by recovery of full-length or digested bound RNAs. Below, the number of genes identified by both methods, with different iCLIP stringencies, and hypergeometric test p values of the experimental overlap (RIP-iCLIP) on top of the bars; red for selected high confidence (HC) ORC1-RNAs. d Genomic distributions of ORC1 iCLIP crosslinks, and (below) their density around TSSs (−/+ 10 kb) of ORC1-bound genes. e Gene length and expression level of high confidence (HC) ORC1-RNAs (iCLIP-RIP overlap) and ORC1-RNAs (iCLIP-RIP union), relative to sample size-matched control genes with different fold changes (FC) in ORC1 RIP-seq. n = number of genes in each category (Supplementary Data 2; from iCLIP data [>5 crosslink sites and <0.05 FDR] and RIP-seq data [log2 fold change >1 and p value <0.05]). Box plots show the median distribution between Q1 and Q3. *** denotes p value <0.001, derived from unpaired two-tailed Student’s t-test. f Gene biotypes of ORC1-RNAs. g Percentage of ORC1-RNA and high confidence ORC1-RNA (HC) genes with mutual interactions according to Hi-C analysis, compared to controls shown in Fig. 1e. Bars represent mean values. **** denotes p value <0.0001, derived from a two-proportion z-test. h, i Density plots of h ORC1 ChIP-seq and i SNS-seq normalized reads across six quantiles (Q) of ORC1-RNA genes, defined by ORC1 iCLIP, centered around their TSSs (−/+ 5 kb). j Browser snapshot of representative high confidence ORC1-RNA genes, showing data of ORC1 RNA-binding (ORC1 RIP-seq or iCLIP crosslinks), and replication origins (SNS-seq) at their TSSs, in HCT116 cells. Green arrows indicate positions of GAA repeats.
Fig. 2
Fig. 2. RNAs bound by ORC1 are necessary for optimal origin activation.
a RNA-FISH representative images, and signal quantification (below), of RNAs containing GAA repeats, in ASO-transfected HCT116 cells. Dots represent mean values (n = 4 biologically independent samples) ±SEM. * denotes p value < 0.05, derived from unpaired two-tailed Student’s t-test. b DNA fiber quantification of inter-origin distances and fork rates of ASO-transfected HCT116 cells. Red lines indicate the median. ns denotes p value > 0.05, ** denotes p value < 0.01, **** denotes p value <0.0001, derived from unpaired two-tailed Mann–Whitney t-test. c SNS-seq peak count frequency and distribution relative to TSS positions (±3 kb) in ASO control and anti-GAA treated HCT116 cells. d GSEA showing the reduction of SNS-seq signal (peaks enriched in the control condition) in anti-GAA downregulated genes. Statistical significance (adjusted p value 0.038) of the enrichment score (ES) derives from a permutation test. e CDC45 and PCNA chromatin immunofluorescences per cell (HCT116) upon ASO knockdown, after soluble protein washout. Data were presented as mean values (n > 100 cells) ±SEM. *** denotes p value < 0.001, derived from unpaired two-tailed Mann–Whitney t-test. f ORC1 western blot and protein quantification, in chromatin extracts of ASO-transfected HCT116 cells. Data were presented as mean values (n = 5 biologically independent experiments) ±SEM. ns denotes p value > 0.05, * denotes p value < 0.05, derived from paired two-tailed Student’s t-test. g Browser snapshot at DDX5-CEP95 locus showing ORC1 RIP-seq enrichment, ORC1 iCLIP peaks, and SNS-seq reads in HCT116 cells, with the position of qPCR primers (#) indicated, and origins highlighted in blue. h Enrichment of nascent strands determined by SNS-qPCR at genomic positions indicated in Fig. 2g, in siRNA-treated HCT116 cells. Data were presented as mean values (n = 5 biologically independent experiments) ±SEM. ns denotes p value > 0.05, * denotes p value <0.05, ** denotes p value < 0.01, derived from paired two-tailed Student’s t-test.
Fig. 3
Fig. 3. ORC1 RNA-binding mutant is impaired in origin activation.
a 3D model of human ORC1 showing domains in colors, and residues R441, R444, and R465 (involved in RNA-binding) in red. Below, the vertebrate consensus of ORC1 RNA-binding region, circles indicating mutated residues in MUT-ORC1. b RNA staining of EMSA assays, with GST-tagged purified WT and MUT-ORC1 (amino acids 413–511) (2.5 µM) incubated with fragmented cellular RNA (2.5 µM). Below, the silver staining of proteins used in the assay. c Cross-correlation between ORC1 and EU-labeled RNA (long pulse) in G1-synchronized U2OS cells, untransfected or transfected with Halo-tagged WT and MUT-ORC1, comparing STORM experimental (EXP) and randomized (RND) samples. Data were presented as mean values (n > 50 cells) ± SEM. ns denotes p value >0.05, ** denotes p value <0.01, derived from unpaired two-sample t-test. d DNA fiber quantification of inter-origin distances and fork rates in HCT116 cells transfected with the indicated siRNAs, ±plasmids expressing Flag-tagged WT or MUT-ORC1. Black lines indicate the median. ns denotes p value >0.05, * denotes p value <0.05, ** denotes p value <0.01, **** denotes p value <0.0001, derived from unpaired two-tailed Mann–Whitney t-test. e Browser snapshot at ORC1-RNA PABPC1, NFAT5, and DDX5-CEP95 loci, showing SNS-seq normalized signal of HCT116 cells stably expressing WT or MUT-ORC1. f GSEA showing enrichment of ORC1-RNAs in merged iCLIP-defined quantiles (Q), toward ranked genes according to their WT vs MUT (log2 fold change) SNS-seq coverage at TSSs. Statistical significance (adjusted p value 1.13e-18 or 0.003) of the enrichment scores (ES) were calculated by permutation tests. g CDC45 and PCNA chromatin immunofluorescences per cell, in HCT116 cells stably expressing WT or MUT-ORC1, after soluble protein washout. Data were presented as mean values (n > 100 cells) ± SEM. *** denotes p value <0.001, derived from unpaired two-tailed Mann–Whitney t-test. h Coverage plot of CDC45 ChIP-seq data at TSSs, in WT or MUT-ORC1 HCT116 stably expressing cells, and two-tailed t-test statistical results between their coverage at TSSs of ORC1 iCLIP-defined gene quantiles (Q).
Fig. 4
Fig. 4. RNA regulates ORC1 chromatin release.
a p53 and ORC1-3xFlag protein quantification from western blots with total extracts of HCT116 cells, transfected with WT or MUT-ORC1, and treated with cycloheximide (CHX) or MG-132. Dots represent mean values (n = 3 biologically independent experiments) ± SEM. ns denotes p value >0.05, * denotes p value <0.05, ** denotes p value <0.01, derived from paired two-tailed Student’s t-test. b Western blot on chromatin extracts of HCT116 cells, transfected with Flag-tagged WT-ORC1 and MUT-ORC1, unsynchronized (Uns) or synchronized in G1/S and released at different times (T as in Supplementary Fig. 8c). Below, normalized protein quantification. Dots represent mean values (n = 4 biologically independent experiments) ± SEM. ns denotes p value >0.05, * denotes p value <0.05, derived from paired two-tailed Student’s t-test. c Western blot and quantification of endogenous ORC1 on chromatin in different stages of the cell cycle (T as in Supplementary Fig. 8c), upon depletion of GAA-RNAs (ASO anti-GAA) or control conditions (ASO CTRL). Bars represent mean values (n = 3 biologically independent experiments) ± SEM. ns denotes p value >0.05, * denotes p value <0.05, ** denotes p value <0.01, derived from paired two-tailed Student’s t-test. d Western blot showing the effect of RNase A treatment on WT and MUT-ORC1 chromatin association, along the cell cycle of synchronized cells (T as in Supplementary Fig. 8c). Quantification of independent biological replicates (n = 4) is shown in Supplementary Fig. 8d. e Representation of the IDR in WT and MUT-ORC1, showing RNA-binding regions (orange), and the discrete positions of RNA-binding mutations (black) and phosphorylated residues (red) detected by mass spectrometry, in control or GAA-knockdown conditions. Source data are provided as a Source Data file.

References

    1. Fragkos M, Ganier O, Coulombe P, Méchali M. DNA replication origin activation in space and time. Nat. Rev. Mol. Cell Biol. 2015;16:360–374. doi: 10.1038/nrm4002. - DOI - PubMed
    1. Méndez J, et al. Human origin recognition complex large subunit is degraded by ubiquitin-mediated proteolysis after initiation of DNA replication. Mol. Cell. 2002;9:481–491. doi: 10.1016/S1097-2765(02)00467-7. - DOI - PubMed
    1. Kara N, Hossain M, Prasanth SG, Stillman B. Orc1 binding to mitotic chromosomes precedes spatial patterning during G1 phase and assembly of the origin recognition complex in human cells. J. Biol. Chem. 2015;290:12355–12369. doi: 10.1074/jbc.M114.625012. - DOI - PMC - PubMed
    1. Hossain M, Bhalla K, Stillman B. Multiple, short protein binding motifs in ORC1 and CDC6 control the initiation of DNA replication. Mol. Cell. 2021;6:1951–1969. doi: 10.1016/j.molcel.2021.03.003. - DOI - PMC - PubMed
    1. Marahrens Y, Stillman B. A yeast chromosomal origin of DNA replication defined by multiple functional elements. Science. 1992;255:817–823. doi: 10.1126/science.1536007. - DOI - PubMed

Publication types