. 2023 Jul 24;14(1):4445.
doi: 10.1038/s41467-023-40096-1.

RAD51C-XRCC3 structure and cancer patient mutations define DNA replication roles

Affiliations

RAD51C-XRCC3 structure and cancer patient mutations define DNA replication roles

Michael A Longo et al. Nat Commun. .

Abstract

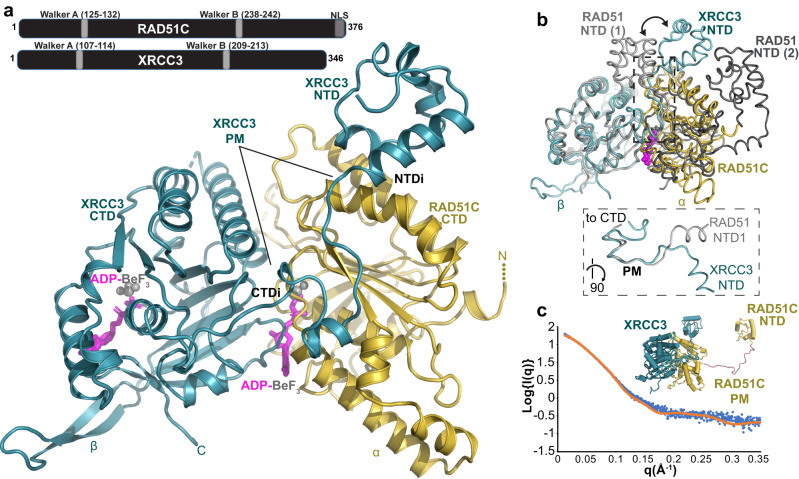
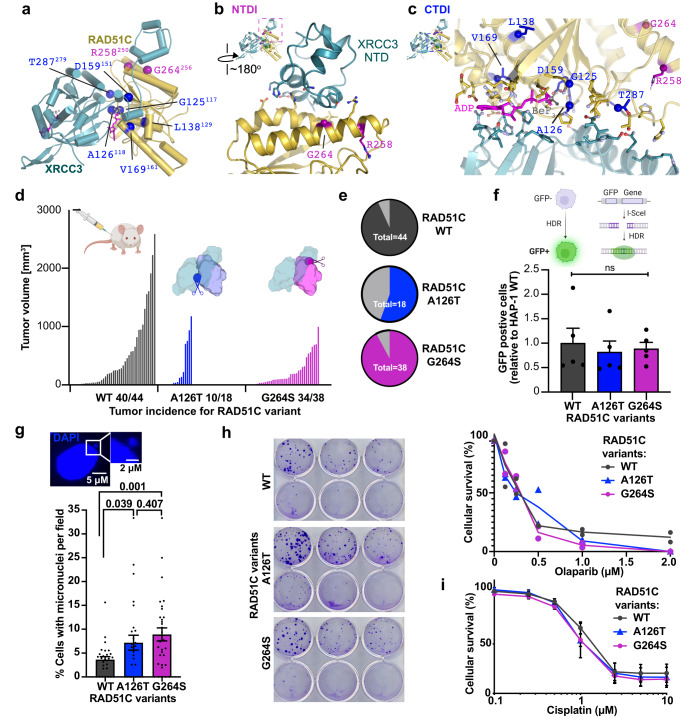
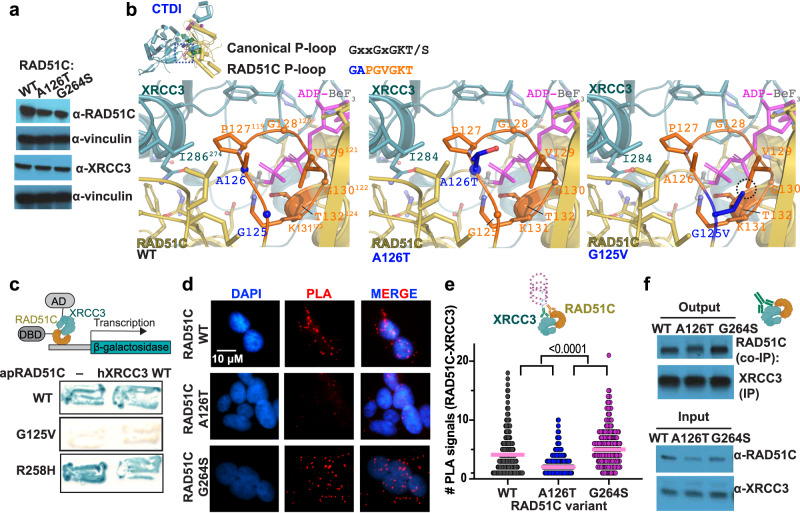
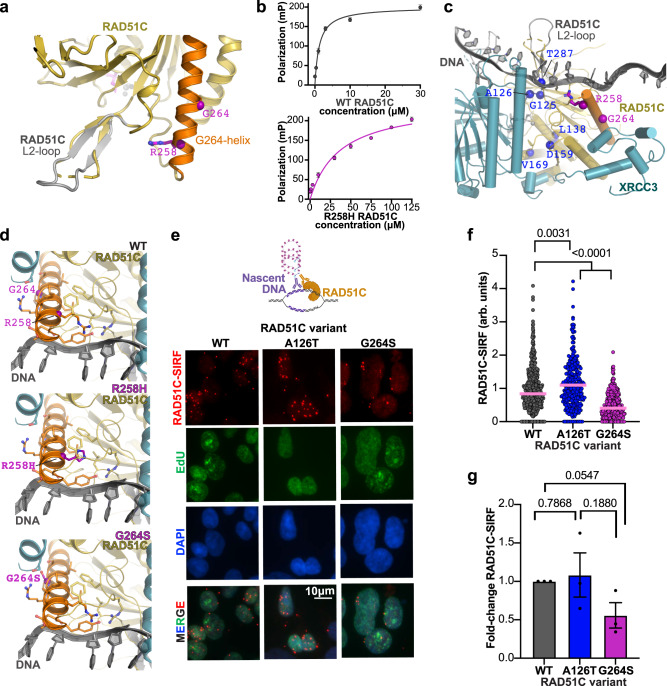
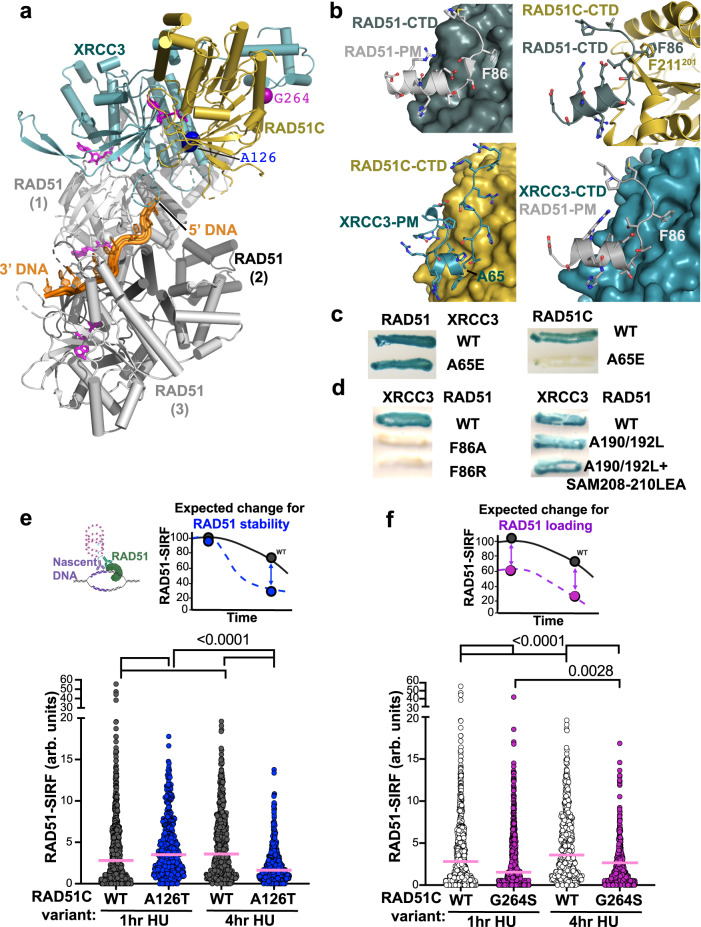
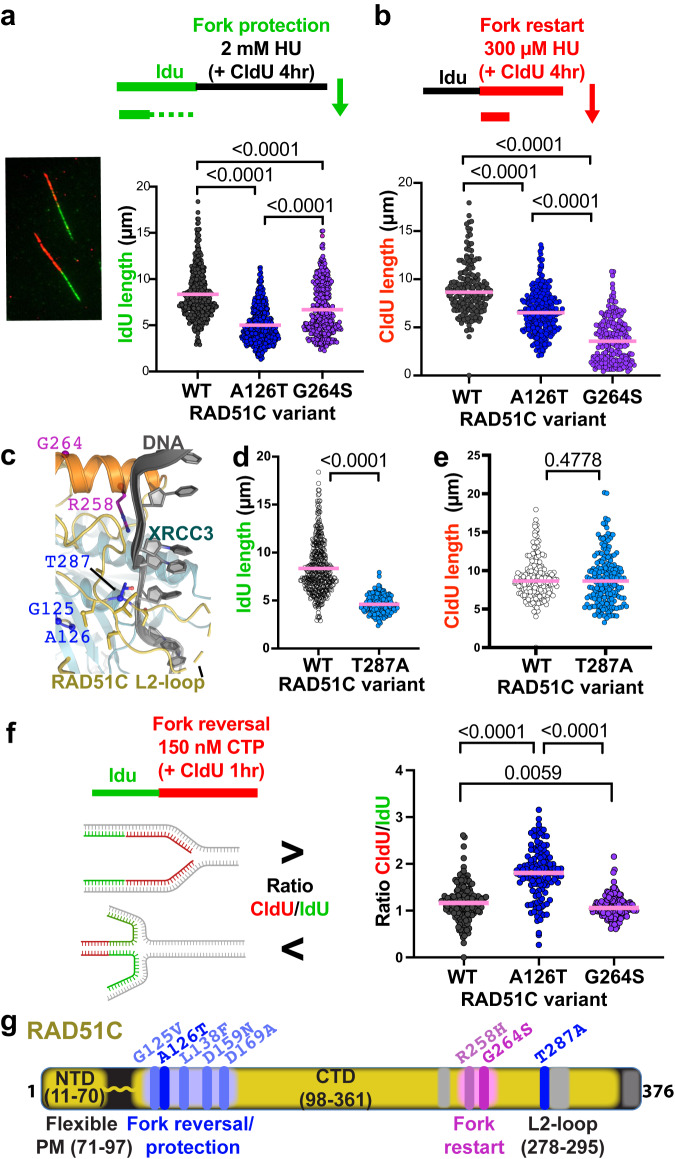
RAD51C is an enigmatic predisposition gene for breast, ovarian, and prostate cancer. Currently, missing structural and related functional understanding limits patient mutation interpretation to homology-directed repair (HDR) function analysis. Here we report the RAD51C-XRCC3 (CX3) X-ray co-crystal structure with bound ATP analog and define separable RAD51C replication stability roles informed by its three-dimensional structure, assembly, and unappreciated polymerization motif. Mapping of cancer patient mutations as a functional guide confirms ATP-binding matching RAD51 recombinase, yet highlights distinct CX3 interfaces. Analyses of CRISPR/Cas9-edited human cells with RAD51C mutations combined with single-molecule, single-cell and biophysics measurements uncover discrete CX3 regions for DNA replication fork protection, restart and reversal, accomplished by separable functions in DNA binding and implied 5' RAD51 filament capping. Collective findings establish CX3 as a cancer-relevant replication stress response complex, show how HDR-proficient variants could contribute to tumor development, and identify regions to aid functional testing and classification of cancer mutations.


Conflict of interest statement

The authors declare no competing interests.

Figures

Fig. 1
Fig. 1. RAD51C-XRCC3 X-ray crystal structure and X-ray scattering define conserved fold and assembly.
a Overview of the apCX3 heterodimer structure with important subdomains, regions, unique features for RAD51C (gold) and XRCC3 (teal), and bound ATP-mimic (magenta) highlighted. top, sketch of RAD51C and XRCC3 sequence with known motifs. b Structural superposition of the apCX3 core dimer with ATP-bound human RAD51 dimer (PDB 7EJC) to highlight the unique positioning of the XRCC3 NTD (teal) subdomain in the CX3 structure (see arrows). Dashed box, zoomed view of boxed area, rotated 90°, comparing the polymerization motif (PM) of RAD51 and XRCC3. c Comparison of a structural model of full-length hCX3 based on our apCX3 core and apRAD51C NTD structures to experimental SAXS data collected on hCX3.
Fig. 2
Fig. 2. RAD51C cancer mutations spotlight two RAD51C-XRCC3 interface regions.
a Mapping of recurrent RAD51C cancer mutations onto the apCX3 structure. Mutations clustered at the RAD51C-XRCC3 NTD interface with RAD51C (NTDI) are colored purple and mutations mapping around the CX3 ATP and CTD interface (CTDI) are colored blue. Residue numbering denotes human RAD51C with corresponding A. pompejana numbering in superscript. b Close up view to show residues within 4.5 Å of the RAD51C-XRCC3 NTDI. c Close up view of the extended CX3 CTDI. Residues within 4.5 Å of the interface are shown. d Tumor volume for xenografts of HAP1 cells expressing wild-type (WT) or RAD51C variants as indicated. Labeling on the x-axis denotes the number of tumors that grew compared to the number of independent injections. Schematics created with http://BioRender.com. e Pie chart representation of tumor take rate. f Dr-GFP HDR proficiency assays of HAP1 cells expressing wild-type (WT) or variant RAD51C as indicated. Top, schematic created with http://BioRender.com of Dr-GFP assay with I-Sce1 endonuclease induced double-strand break to measure homology directed repair (HDR) efficiency by the restoration of a functional green fluorescence protein (GFP). Data are presented as the mean +/− SEM. P values were calculated using an unpaired, two-sided Student T-test, n = 5 independent biological experiments. g Wild-type or RAD51C variant expressing HAP1 cells were assessed for presence of micronuclei expressed as percentage of cells with micronuclei per image field. Data are presented as the mean +/− SEM. P values were calculated using an unpaired, two-sided Student T-test, n = 5 independent biological experiments resulting in a total of n(WT) = 1351, n(A126T) = 1003, and n(G264S) = 1090. h Clonogenic survival assay with Olaparib. Left, images of plates exposed to varying concentrations of Olaparib increasing in from 0 at the top left to 2 µM at the bottom right. Right, Quantification whereby error bars represent the standard error of the mean, n = 2 independent biological experiments. i MTS survival assay with cisplatin. N = 5 independent biological experiments performed in triplicates, error bars represent the standard error of the mean.
Fig. 3
Fig. 3. CX3 CTDI mediates RAD51C-XRCC3 paralog binding.
a Western blot of HAP1 cells and variant RAD51C as indicated against RAD51C, XRCC3, or Vinculin as loading control. Representative image from 3 independent biological experiments. b Zoomed view of the structural environment of wild-type (WT) CX3 A126 and G125 (left) plus models of the RAD51C A126T (middle) and G125V (right) mutations, with mutated residues in blue and major clashes highlighted by a dashed circle. Top left, ATPase P-loop (orange with blue denoting variant positions) with the canonical and conserved RAD51C sequences. c Yeast two-hybrid assay testing interactions between wild-type (WT), G125V and R258H A. pompejana RAD51C (apRAD51C) and human XRCC3 (hXRCC3). Top, graphical sketch of two-hybrid assay adapted from http://BioRender.com. d Representative images of RAD51C-XRCC3 proximity ligation assay (PLA, red) in human HAP1 cells containing indicated variant RAD51C. DAPI denotes nucleus. e Quantification of RAD51C-XRCC3 PLA signals with hydroxyurea (200 µM) from (d), pink bar denotes median. P values (<0.0001 between all variants) were calculated using an unpaired two-sided Student T-test, n(WT) = 494, n(A126T) = 601, n(G264S) = 242, derived from 4 independent biological experiments, top, graphical schematic of a PLA reaction created with http://BioRender.com. f Immunoprecipitation (IP) of XRCC3 from HAP1 cell extracts expressing wild-type (WT), A126T or G264S RAD51C and Western blot against RAD51C Co-IP. A representative immunoblot from 3 independent experiments is shown. Schematic created with http://BioRender.com.
Fig. 4
Fig. 4. CX3 NTDI mediates RAD51C DNA binding.
a Mapping of the R258H location onto apRAD51C-CTD shows positioning toward a disordered loop that corresponds to the DNA-binding RAD51 L2-loop. The α-helix (orange) containing R258 and G264 (purple) with a model of the RAD51C L2-loop, which closely matches the RAD51 L2-loop seen in DNA bound complexes, is overlaid in gray. b Fluorescence polarization assays measuring apRAD51C wild-type (top) and R258H (bottom) binding to single-stranded DNA (ssDNA). For each concentration mean polarization values from n = 3 technical replicates and standard deviation error bars are shown. c A model of ssDNA (gray) binding to the CX3 complex based on superposition of RAD51-ssDNA structures on the CX3 dimer. RAD51C variants are mapped as for Fig. 2. d Zoomed view of the structural environment of CX3 with RAD51C wild-type (WT) with R258 and G264 (top) plus models of the RAD51C R258H (middle) and G264S (bottom) mutations in relation to the modeled ssDNA path. The helix containing R258 and G264 is colored orange with residues within 4.5 Å shown (sticks). e Representative images of RAD51C-SIRF assay with 200 µM hydroxyurea in human HAP1 cells containing indicated variant RAD51C, which produces a red fluorescent signal if RAD51C and EdU labeled biotinylated nascent DNA are in close proximity (<40 nm). Cells were co-clicked with Alexa-Fluor 488 azide and biotin azide to enable simultaneous visualization of newly synthesized DNA (EdU, green) and SIRF signals (RAD51C-SIRF, red), DAPI denotes nucleus. SIRF signals are normalized to total EdU-azide 488 signal to account for potential difference in the amount of nascent DNA available to SIRF signal production (arbitrary unit, a.u.). Top, graphical schematic of a RAD51C-SIRF reaction created with http://BioRender.com. f Quantification of RAD51C SIRF signals from (e), pink bar denotes median. n(WT) = 360, n(126T) = 341, n(G264S) = 415, P values (<0.0001 between G264S and other variants, 0.0031 between WT and A126T) were calculated between each comparison using the two-sided Mann–Whitney test. g Fold-change of average RAD51C-SIRF signals in HAP1 cells with indicated RAD51C variants. Data are presented as the mean +/− SEM. P values were calculated using an unpaired Student two-sided T-test, n = 3 independent biological experiments.
Fig. 5
Fig. 5. CX3 mediates RAD51 filament loading and stability from structural and cellular analyses.
a Structural model showing how CX3 capping at the 5’-end of RAD51 filaments based on superposition of RAD51-ssDNA filament structures (PDB: 7EJC) with our CX3 structure. b Comparison of the canonical RAD51-RAD51 interaction mediated by the F86 polymerization motif (PM) (top left) to the XRCC3 PM interaction with RAD51C (bottom left) and predicted interactions of the RAD51 PMf with RAD51C (top right) and XRCC3 (bottom right) CTDs. c Yeast two-hybrid assay testing interactions between wild-type (WT) RAD51 and RAD51C with XRCC3 WT and PM A65E. d Yeast two-hybrid assay testing interactions between WT XRCC3 with WT RAD51 and indicated PM F86 (left) and CTD pocket (right) mutations. e Quantification of RAD51-SIRF signals in wild-type (WT) and RAD51C A126T HAP1 cells 1 h and 4 h after replication stalling with hydroxyurea, pink bar denotes median. Top left, graphical schematic of a RAD51-SIRF reaction created with http://BioRender.com, top right, expected outcome for RAD51 filament stabilization defects (blue). n(WT, 1 h) = 342, n(A126T, 1 h) = 463, n(WT, 4 h) = 347, n(A126T, 4 h) = 417, from 3 independent biological experiments. f Quantification of RAD51-SIRF signals in RAD51C G264S HAP1 cells 1 h and 4 h after replication stalling with hydroxyurea, pink bar denotes median. Data from wild-type (WT) HAP1 cells is replotted from (e), top right, expected outcome for RAD51 filament loading defects (purple). n(G264S, 1 h) = 701, n(G264S, 4 h) = 723, from 4 independent biological experiments. P values for all RAD51 SIRFs (<0.0001 for all comparisons except 0.0028 for G264S comparison at 1 h and 4 h post HU) were calculated between each comparison using the two-sided Mann–Whitney test.
Fig. 6
Fig. 6. Distinct replication stress reactions by CX3 CTDI and NTDI.
a Dot-blots of nascent IdU replication tracts lengths in human HAP1 cells containing indicated variant RAD51C. left, Representative image of single-molecule DNA fiber tracts labeled with IdU (green) and CldU (red). top, schematic of DNA fiber labeling with IdU, followed by CldU with high concentrations of hydroxyurea (HU) to measure fork protection. n = 4 independent biological experiments. n(WT) = 411, n(A126T) = 455, n(G264S) = 379, derived from 4 independent biological experiments. b Dot-blots of nascent CdU replication tracts lengths in human HAP1 cells containing indicated variant RAD51C. top, schematic of DNA fiber labeling with IdU, followed by CldU with low concentrations of hydroxyurea (HU) to measure replication fork restart. n(WT) = 185, n(A126T) = 275, n(G264S) = 211, derived from 3 independent biological experiments. c Zoomed view, using the CX3-DNA model from Fig. 4c, of the structural environment of RAD51C T287A with DNA, P-loop variants, G264-helix variants and residues within 4.5 Å of T287 (sticks) highlighted. d Dot-blots of nascent IdU replication tracts lengths followed by CldU with 2 mM of HU as in panel (a), in human HAP1 RAD51C T287A cells, results for wild-type HAP1 are replotted. n(T287A) = 170, derived from 2 independent biological experiments. e Dot-blots of nascent CldU replication tracts lengths in the presence of 300 µM HU as in panel (b), in human HAP1 RAD51C T287A cells, results for wild-type HAP1 are replotted. n(T287A) = 188, derived from 2 independent biological experiments. f Dot-blots of ratio of nascent CdU divided by IdU replication tracts lengths in human HAP1 cells containing indicated variant RAD51C. top, schematic created with http://BioRender.com of DNA fiber labeling with IdU, followed by CldU with low concentrations of camptothecin (CPT) to measure replication fork slowing during CPT indicative of replication fork reversal. n(WT) = 162, n(A126T) = 124, n(G264S) = 142, derived from 2 independent biological experiments. P values (shown above brackets in the figure panels) for all DNA fiber analysis and between each comparison were calculated using the two-sided Mann–Whitney test. g Schematic figure of RAD51C protein highlighting regions responsible for fork protection in blue and fork restart in pink.

References

    1. Meindl A, et al. Germline mutations in breast and ovarian cancer pedigrees establish RAD51C as a human cancer susceptibility gene. Nat. Genet. 2010;42:410–414. doi: 10.1038/ng.569. - DOI - PubMed
    1. AACR Project GENIE. Powering precision medicine through an international consortium. Cancer Discov. 2017;7:818–831. doi: 10.1158/2159-8290.CD-17-0151. - DOI - PMC - PubMed
    1. Prakash R, et al. Homologous recombination-deficient mutation cluster in tumor suppressor RAD51C identified by comprehensive analysis of cancer variants. Proc. Natl Acad. Sci. USA. 2022;119:e2202727119. doi: 10.1073/pnas.2202727119. - DOI - PMC - PubMed
    1. Vaz F, et al. Mutation of the RAD51C gene in a Fanconi anemia-like disorder. Nat. Genet. 2010;42:406–409. doi: 10.1038/ng.570. - DOI - PubMed
    1. Tomaszowski K-H, et al. Hypomorphic Brca2 and Rad51c double mutant mice display Fanconi anemia, cancer and polygenic replication stress. Nat. Commun. 2023;14:1333. doi: 10.1038/s41467-023-36933-y. - DOI - PMC - PubMed

Publication types