. 2023 Jul 24;8(1):107.
doi: 10.1038/s41541-023-00697-9.

A TLR7/8 agonist increases efficacy of anti-fentanyl vaccines in rodent and porcine models

Affiliations

A TLR7/8 agonist increases efficacy of anti-fentanyl vaccines in rodent and porcine models

Bethany Crouse et al. NPJ Vaccines. .

Abstract

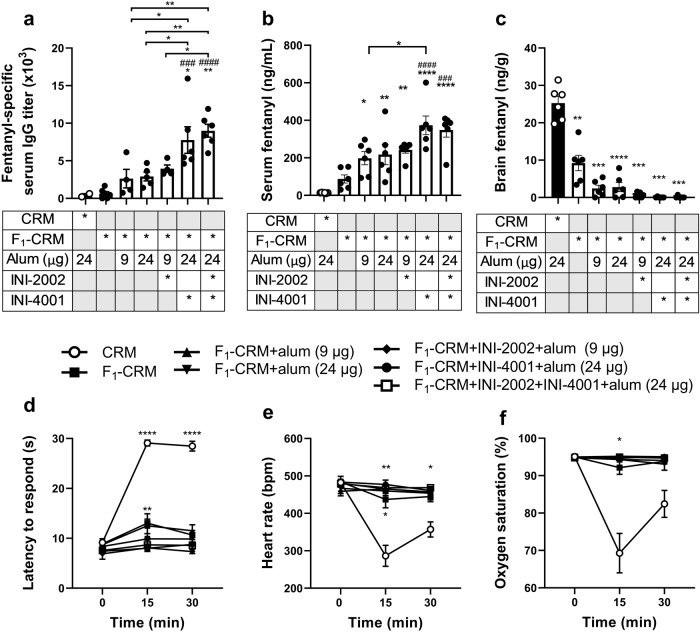
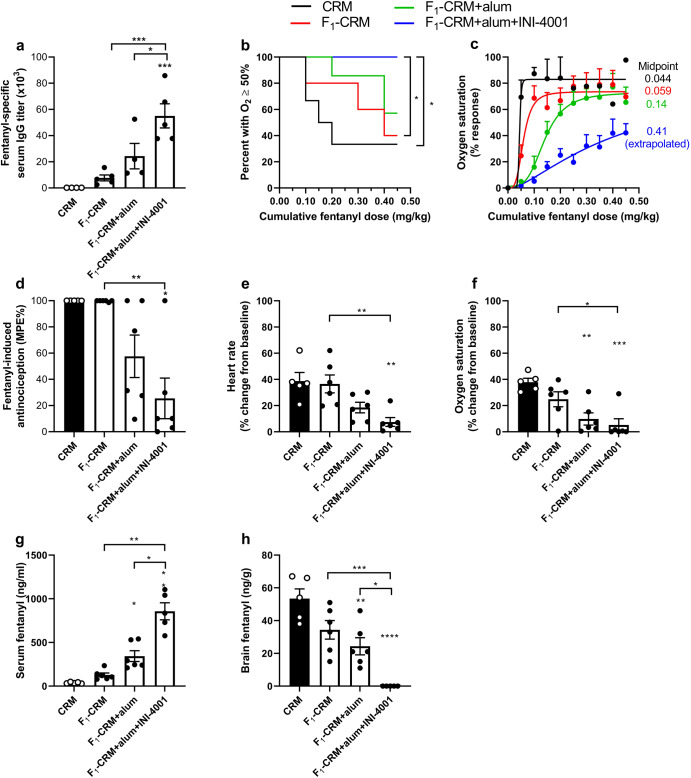
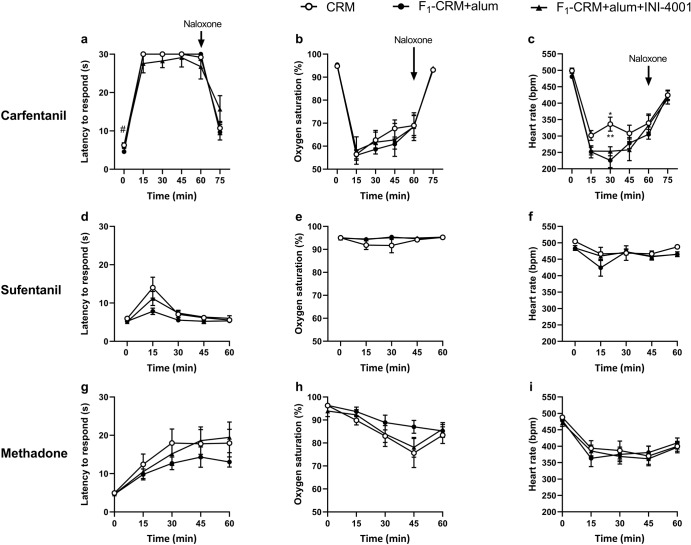
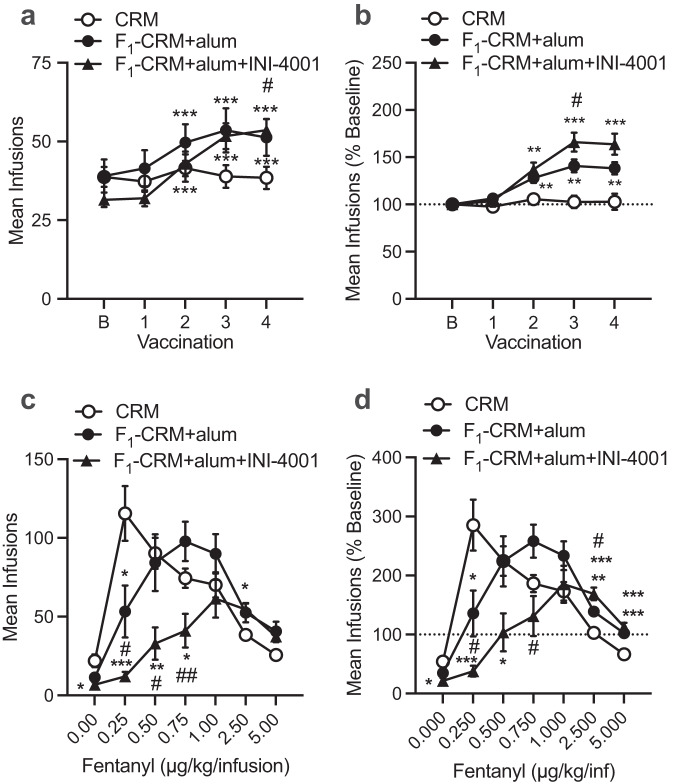
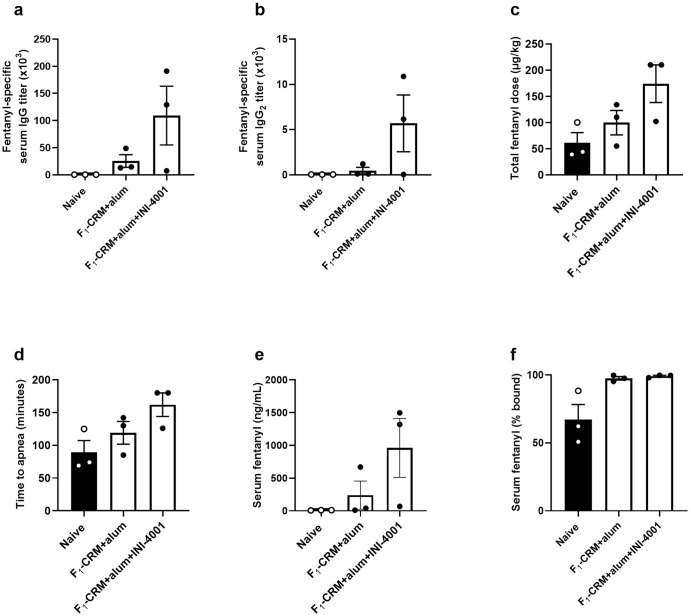
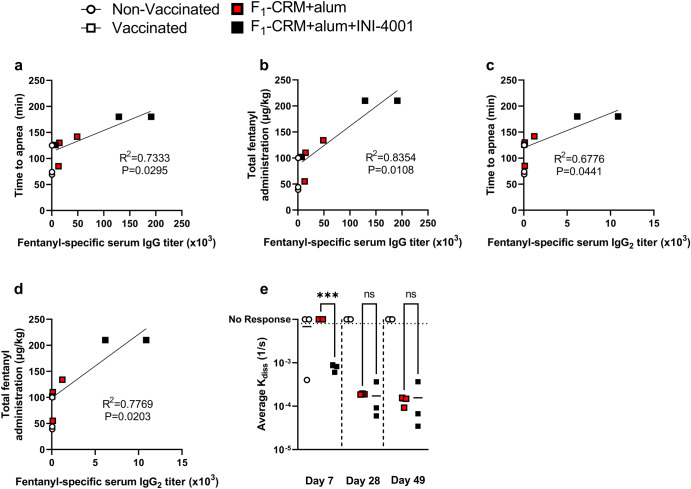
Opioid use disorders (OUD) and overdose are public health threats worldwide. Widespread access to highly potent illicit synthetic opioids such as fentanyl is driving the recent rise in fatal overdoses. Vaccines containing fentanyl-based haptens conjugated to immunogenic carrier proteins offer a long-lasting, safe, and cost-effective strategy to protect individuals from overdose upon accidental or deliberate exposure to fentanyl and its analogs. Prophylactic or therapeutic active immunization with an anti-fentanyl vaccine induces the production of fentanyl-specific antibodies that bind the drug in the blood and prevent its distribution to the brain, which reduces its reinforcing effects and attenuates respiratory depression and bradycardia. To increase the efficacy of a lead anti-fentanyl vaccine, this study tested whether the incorporation of synthetic toll-like receptor (TLR) 4 and TLR7/8 agonists as vaccine adjuvants would increase vaccine efficacy against fentanyl challenge, overdose, and self-administration in either rats or Hanford miniature pigs. Formulation of the vaccine with a nucleolipid TLR7/8 agonist enhanced its immunogenicity and efficacy in preventing fentanyl-induced respiratory depression, analgesia, bradycardia, and self-administration in either rats or mini-pigs. These studies support the use of TLR7/8 adjuvants in vaccine formulations to improve their clinical efficacy against OUD and potentially other substance use disorders (SUD).


Conflict of interest statement

MP is the co-inventor of patents disclosing fentanyl haptens reported in this manuscript (F1 or F, and F3), fentanyl hapten conjugates (F1-CRM, F-CRM), and methods for using them. JTE is a co-inventor of INI-4001 adjuvant, held the CEO position at Inimmune Corporation, and holds stock options in Inimmune Corporation. MP and JTE are co-inventors of patents disclosing formulations of fentanyl vaccines formulated with INI-4001. SMM is an employee of Inimmune Corporation and holds stock options in Inimmune Corporation. All other authors declare no competing interests.

Figures

Fig. 1
Fig. 1. A TLR7/8 agonist, but not TLR4 agonist, increases efficacy of an anti-fentanyl vaccine in rats.
Rats (n = 6/group) were immunized on day 0, 21, and 42. Blood was collected on day 49 for titer measurements. On day 56, rats were challenged with fentanyl (0.05 mg/kg), and parameters of vaccine efficacy were measured at 15 and 30 minutes. Following final behavioral measurements, blood and brain were collected to quantify fentanyl concentration. a Fentanyl-specific antibody titers on day 49. b Serum fentanyl concentration and c brain fentanyl concentration after drug challenge. d Latency to respond, e heart rate, and f oxygen saturation measured at two timepoints after drug challenge. Data are mean ± SEM. Statistical analysis was performed via one-way (a, b) or two-way (df) ANOVA with Tukey’s multiple comparisons post hoc test, or Brown–Forsythe and Welch ANOVA with Dunnett’s T3 multiple comparisons post hoc test (c) * directly over columns indicate significance compared to the control. # directly over columns indicate significance to F1-CRM alone. Statistical symbols: *P < 0.05, ** or ##P < 0.01, ###P < 0.001, **** or ####P < 0.0001.
Fig. 2
Fig. 2. TLR7/8 adjuvanted vaccine protects against fatal levels of respiratory depression and high-dose fentanyl challenge.
Rats (n = 6/group) were immunized on days 0, 21, and 42. On day 49, blood was collected to measure a fentanyl-specific IgG titers via ELISA. Starting on day 56, rats were challenged with a cumulative dose of fentanyl (0.45 mg/kg). Oxygen saturation was measured every 15 minutes. b Kaplan–Meier survival curve of rats who did not fall below 50% oxygen saturation as measured by pulse oximetry. c Dose–response curve of fentanyl-induced respiratory depression calculated as percent maximum possible response [(post-drug SaO2-baseline SaO2)/(SaO2 cutoff-baseline SaO2)]. The following week, rats were challenged with a bolus dose of fentanyl (0.1 mg/kg). 15 minutes post-challenge, d antinociception as a percent maximum possible effect, e heart rate as a percent change from baseline, and f oxygen saturation as a percent change from baseline was measured. After final measurement blood and brain were collected to determine g serum fentanyl concentration and h brain fentanyl concentration via LC-MS. Data are mean ± SEM. Statistical analysis was performed via one-way ANOVA with Tukey’s multiple comparison’s post hoc test (a, e, f, h), or Brown-Forsythe and Welch ANOVA with Dunnett’s T3 multiple comparisons post hoc test (d, g). Kaplan–Meier statistical analysis was performed via Mantel–Cox test between groups (b). * directly over columns indicate significance compared to the control. Statistical symbols: *P < 0.05, **P < 0.01, ***P < 0.001, ****P < 0.0001.
Fig. 3
Fig. 3. Addition of INI-4001 does not significantly alter in vivo efficacy of off-target molecules.
Rats (n = 8/group) were immunized on days 0, 21, and 42. Starting on day 56, rats were challenged with one drug per week. a Latency to respond on a hot plate, b oxygen saturation, and c heart rate after challenge with carfentanil (0.01 mg/kg). 60 minutes post-challenge, rats were given naloxone (0.1 mg/kg) to reverse carfentanil-induced effects. d Latency to respond on a hot plate, e oxygen saturation, and f heart rate after challenge with sufentanil (0.008 mg/kg). g Latency to respond on a hot plate, h oxygen saturation, and i heart rate after challenge with methadone (4.5 mg/kg). Data are mean ± SEM. Statistical analysis was performed via two-way ANOVA with Geisser–Greenhouse correction and Tukey’s multiple comparisons post hoc test. * directly over columns indicate significance compared to the control. # directly over columns indicate significance to F1-CRM alone. Statistical symbols: * or #P < 0.05, **P < 0.01.
Fig. 4
Fig. 4. Effect TLR7/8 adjuvanted anti-fentanyl vaccine on maintenance of fentanyl self-administration.
Mean (±SEM) fentanyl infusions in rats at baseline (B) and 2 weeks after each of the first four vaccinations with CRM (n = 11), F1-CRM+alum (n = 15), or F1-CRM+alum+INI-4001 (n = 16) as self-administration of the fentanyl training dose (2.5 µg/kg/infusion) continued. a Absolute infusion data (mixed-model ANOVA with Geisser-Greenhouse correction followed by Holm-Sidak multiple comparison tests, statistical symbols: different from baseline, ***p < 0.01; F1-CRM+alum+INI-4001 vs CRM, #p < 0.05). b Data from a expressed as a percentage of baseline (mixed-model or one-way ANOVA with Geisser–Greenhouse correction followed by Holm–Sidak multiple comparison tests, statistical symbols: different from CRM, **p < 0.01, ***p < 0.001; F1-CRM+alum vs F1-CRM+alum+INI-4001, #p < 0.05). c, d Mean (±SEM) fentanyl infusions during the last three sessions at each fentanyl unit dose and saline (0 µg/kg) in rats given CRM (n = 11), F1-CRM+alum (n = 13), or F1-CRM+alum+INI-4001 (n = 12) expressed as absolute values (c) or as a percentage of baseline (i.e., pre-vaccination, d). Data analyzed by mixed-model ANOVA with Geisser-Greenhouse correction followed by Holm–Sidak multiple comparison tests. Statistical symbols: different from CRM, *P < 0.05, **P < 0.01, ***P < 0.001. Different from F1-CRM-alum, #P < 0.05, ##P < 0.01.
Fig. 5
Fig. 5. Effect of TLR7/8 adjuvanted anti-fentanyl vaccine on elasticity of demand (α) for fentanyl and antibody titers.
a Mean (±SEM) fentanyl consumption (mg/kg) as a function unit price in rats given CRM, F1-CRM+alum, or F1-CRM+alum+INI-4001. Curves are fit to the data using an exponential function (see Methods). Demand curve parameters are presented in Table 2. Data were analyzed by Brown-Forsythe and Welch ANOVA followed by Dunnett’s T3 tests. b Mean (±SEM) antibody titers in rats given CRM, F1-CRM+alum, or F1-CRM+alum+INI-4001 during the FSA study. Samples were acquired 7–14 days after the fourth immunization. Data analyzed by Brown–Forsythe and Welch ANOVA followed by Dunnett’s T3 tests. Statistical symbols: different from CRM, *P < 0.05, **P < 0.01; different from F1-CRM+alum, #P < 0.05.
Fig. 6
Fig. 6. INI-4001 increases efficacy of an anti-fentanyl vaccine in a porcine model of fentanyl-induced respiratory depression.
Pigs (n = 3/group) were immunized on days 0, 21, and 42. Blood was collected on day 49 ± 3 to measure a fentanyl-specific serum total IgG titers and b IgG2 subclass titers via ELISA. Starting on day 49 ± 3, pigs were challenged with a continuous IV infusion of fentanyl that increased over time until two minutes of continuous apnea was reached. c Total fentanyl dose received before apnea was achieved. d Time until apnea was achieved. e Total serum fentanyl concentration at time of apnea, measured via LC-MS. f Serum fentanyl expressed as percent (%) protein-bound. Data are mean ± SEM.
Fig. 7
Fig. 7. Porcine serum antibody titers are associated with increased vaccine efficacy.
Pig total serum IgG titers were plotted against a time to apnea and b total fentanyl administration at time of apnea. Pig total serum IgG2 subclass titers were plotted against c time to apnea and d total fentanyl administration at time of apnea. e Polyclonal antibody avidity was measured in all groups at three timepoints using biolayer interferometry. Statistical analysis was performed via Pearson correlation after determining data normality using D’Agostino–Pearson’s test (ad), or one-way ANOVA followed by Tukey’s multiple comparison’s post hoc test (e). Statistical symbols: ***P < 0.001.

References

    1. Chang HY, Kharrazi H, Bodycombe D, Weiner JP, Alexander GC. Healthcare costs and utilization associated with high-risk prescription opioid use: a retrospective cohort study. BMC Med. 2018;16:69. doi: 10.1186/s12916-018-1058-y. - DOI - PMC - PubMed
    1. Centers for Disease Control and Prevention. N.C.f.I.P.a.C. Drug Overdose. (2021).
    1. Ahmad, F., Rossen, L. & Sutton, P. Provisional drug overdose death counts. National Center for Health Statistics. (2021).
    1. Control, C.F.D. Drug overdose deaths in the U.S. top 100,000 annually. Available from: https://www.cdc.gov/nchs/pressroom/nchs_press_releases/2021/20211117.htm. (2021).
    1. Administration, S.A.a.M.H.S. MAT statutes, regulations, and guidelines. Available from: https://www.samhsa.gov/medication-assisted-treatment/statutes-regulation.... (2019)