. 2023 Jul 25;14(7):462.
doi: 10.1038/s41419-023-05992-w.

Multidirectional characterization of cellular composition and spatial architecture in human multiple primary lung cancers

Affiliations

Multidirectional characterization of cellular composition and spatial architecture in human multiple primary lung cancers

Yawei Wang et al. Cell Death Dis. .

Abstract

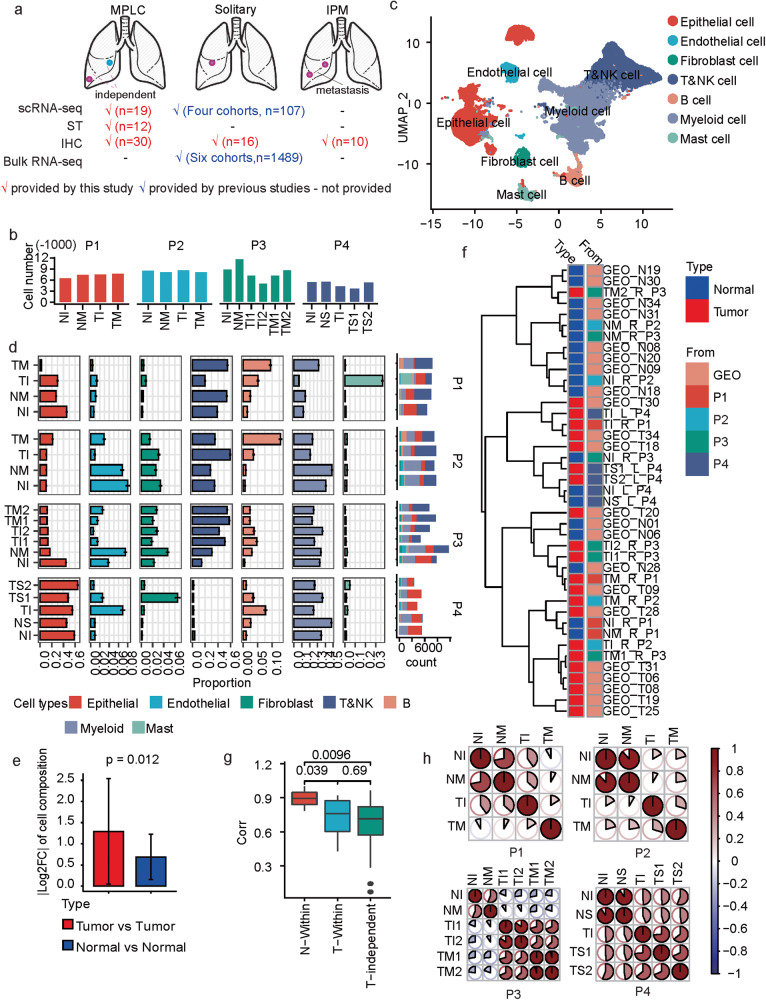
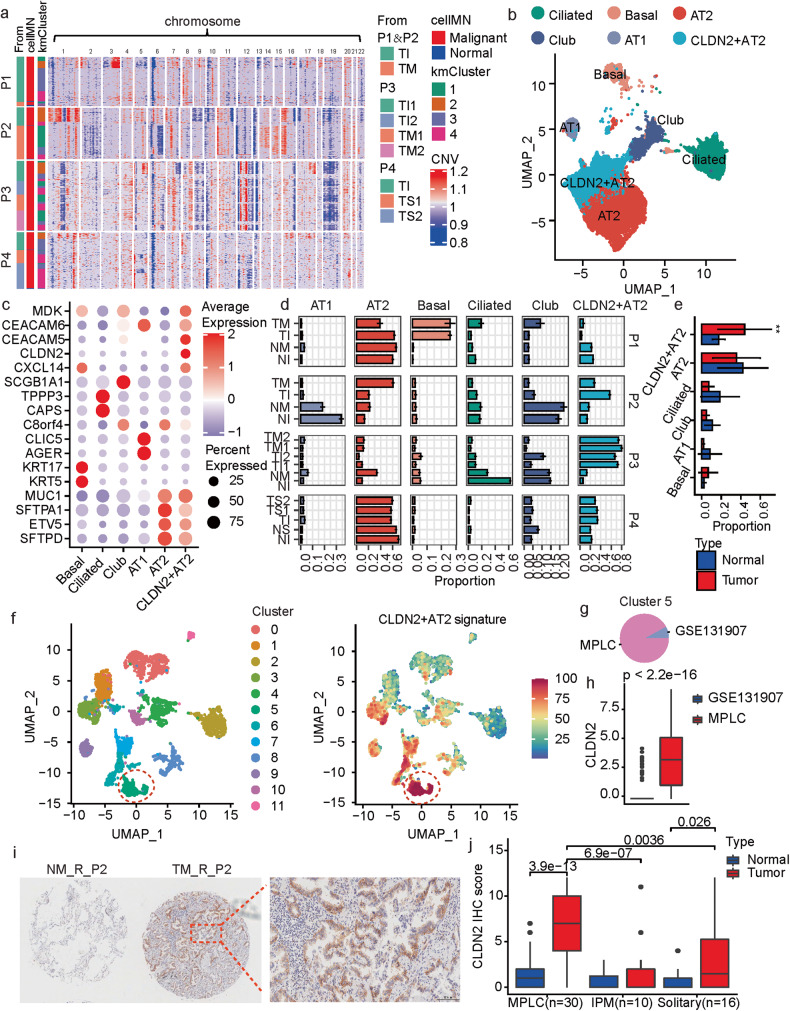
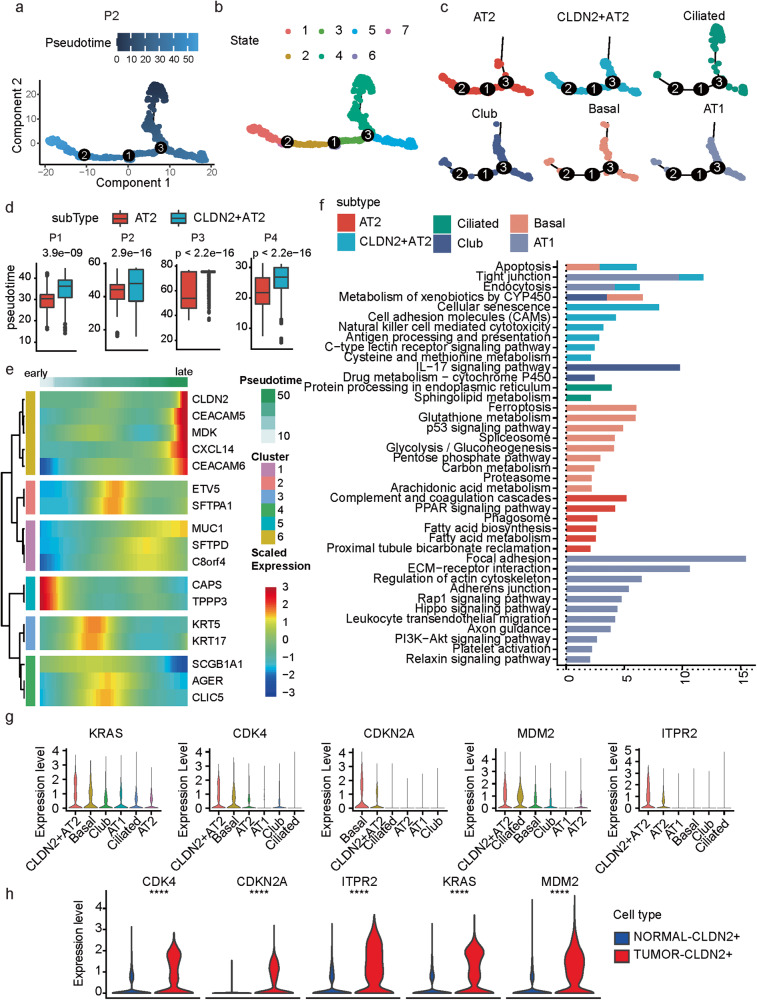
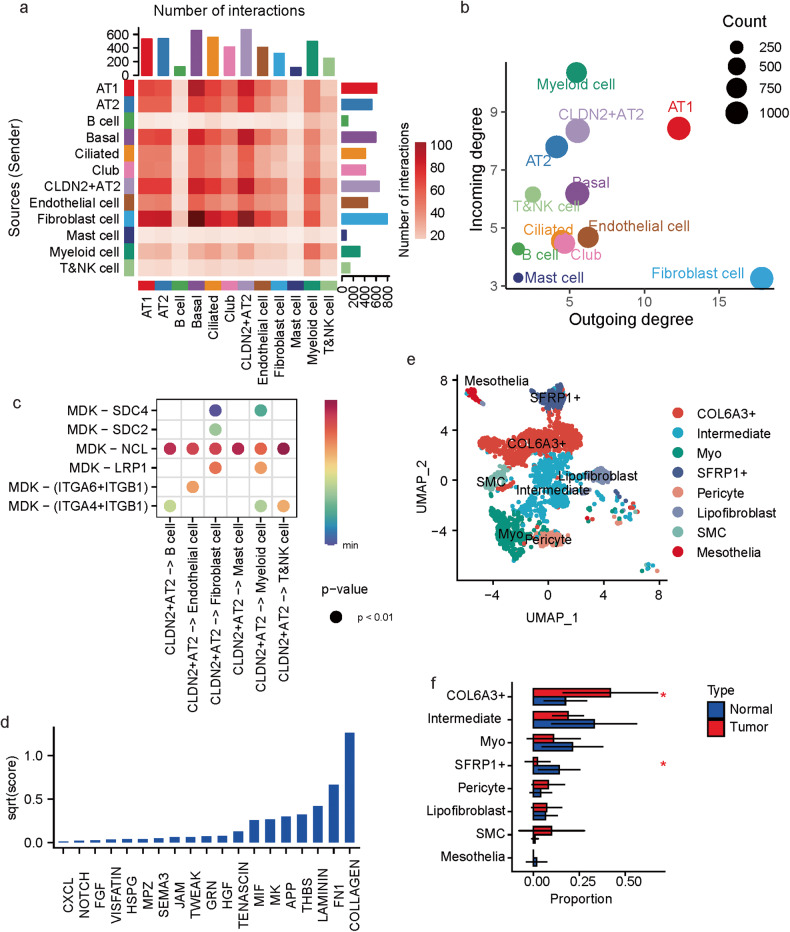
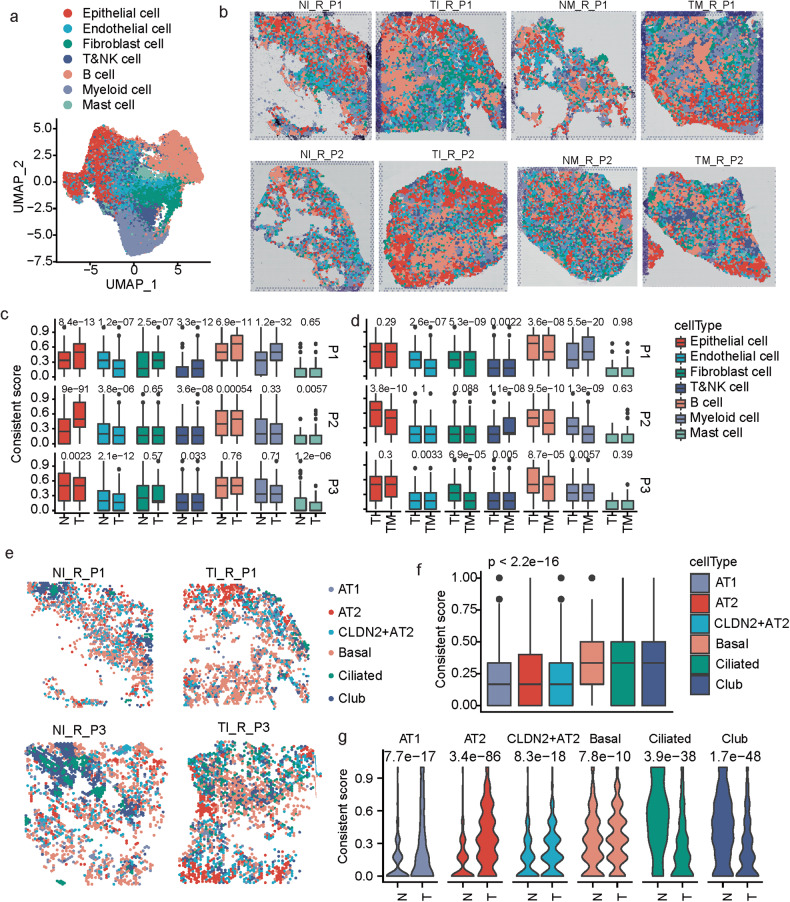
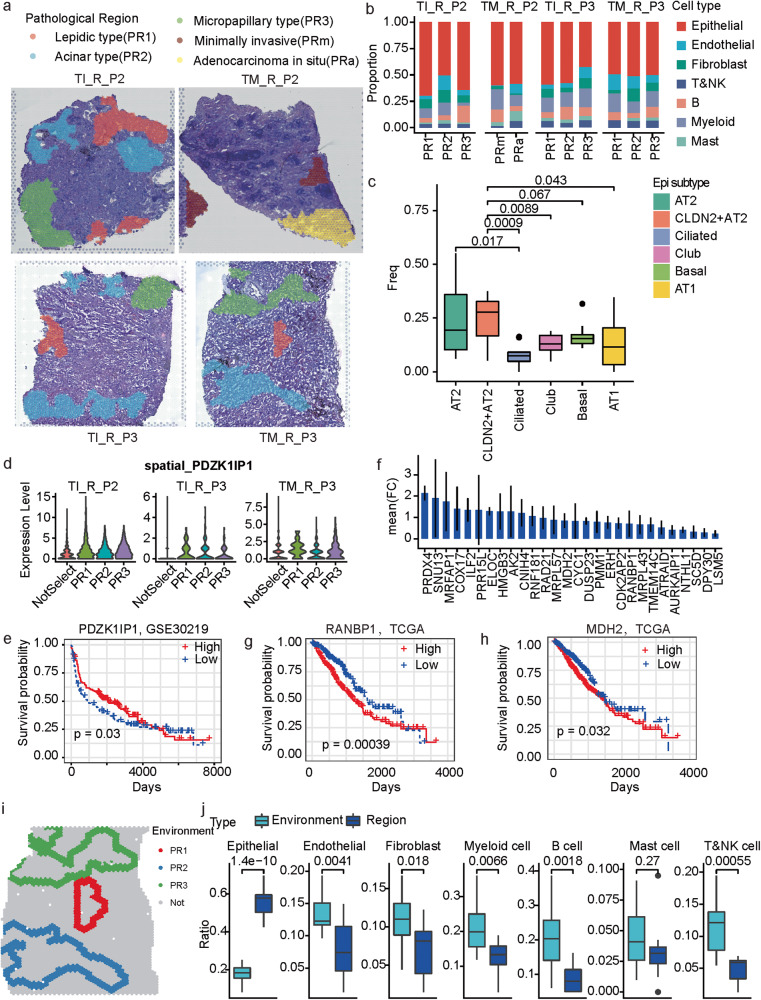
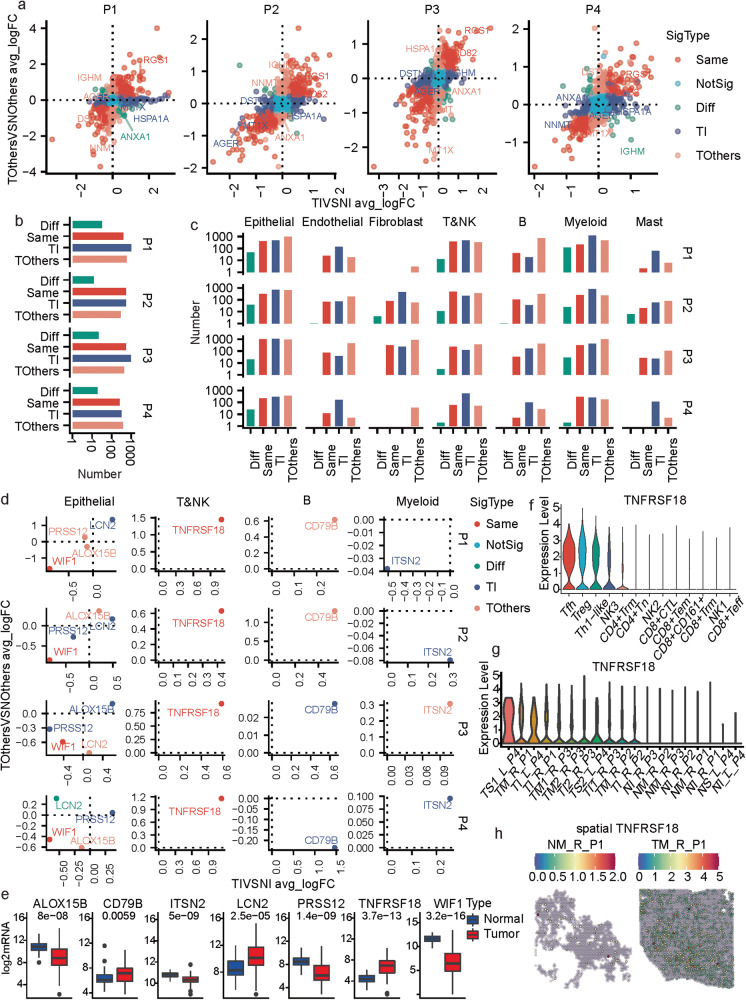
Multiple primary lung cancers (MPLCs) pose diagnostic and therapeutic challenges in clinic. Here, we orchestrated the cellular and spatial architecture of MPLCs by combining single-cell RNA-sequencing and spatial transcriptomics. Notably, we identified a previously undescribed sub-population of epithelial cells termed as CLDN2+ alveolar type II (AT2) which was specifically enriched in MPLCs. This subtype was observed to possess a relatively stationary state, play a critical role in cellular communication, aggregate spatially in tumor tissues, and dominate the malignant histopathological patterns. The CLDN2 protein expression can help distinguish MPLCs from intrapulmonary metastasis and solitary lung cancer. Moreover, a cell surface receptor-TNFRSF18/GITR was highly expressed in T cells of MPLCs, suggesting TNFRSF18 as one potential immunotherapeutic target in MPLCs. Meanwhile, high inter-lesion heterogeneity was observed in MPLCs. These findings will provide insights into diagnostic biomarkers and therapeutic targets and advance our understanding of the cellular and spatial architecture of MPLCs.


Conflict of interest statement

The authors declare no competing interests.

Figures

Fig. 1
Fig. 1. scRNA-seq based tumor heterogeneity overview of MPLCs.
a Overview about the integrative data resources. b Number of cells in each sample after quality control. c Uniform Manifold Approximation and Projection (UMAP) of the 133923 cells based on scRNA-seq data. The cell types were annotated based on canonical cell type markers. d The proportions of different cell types within each measured sample. The y-axis represents the samples, and x-axis represents the percentage or total count. The proportions were estimated based on a bootstrap method, and represented in the form of mean ± s.d. The colors represent cell types. e The change of the cell type proportion between samples from different tumor lesions (red) or tumor-adjacent tissues (blue) within the same MPLCs patient. |·| means absolute value. Data represent mean ± s.d. t test, unpaired, one-sided. f Clustering both the samples collected by this study and the other LUAD tumor and adjacent normal tissue samples from an independent study (GEO dataset ID: GSE131907, n = 11 for both tumor and normal samples) based on the Spearman correlations between the cell type composition of two samples. See also Supplementary Fig. 2 for the clustering details. The sample names from GEO131907 begin with GEO, while the MPLC sample names begin with T or N. The letters L and R in the MPLC sample names represent left and right lung. g Boxplot of the correlations between different types of samples. t test, paired and one sided for comparing T-Within and N-Within, unpaired and two sided for the other comparisons. h The similarities between different samples within the same MPLCs patient. The similarity is based on the Spearman correlation coefficients between the average expressions of variable genes in two samples. MPLC multiple primary lung cancer, IPM intrapulmonary metastasis, ST spatial transcriptomics, IHC immunohistochemistry, TI tumor sample from the inferior lobe, TM tumor tissue from middle lobe, TS tumor tissue from superior lobe, NI normal tissue adjacent to TI, NM normal tissue adjacent to TM, NS normal tissue adjacent to TS, Log2FC log2-transformed fold change. N-within: correlations between normal samples within the same MPLCs patient. T-within: correlations between different tumor lesions within the same MPLCs patient. T-independent: correlations between different tumor tissues from different LUAD patients from GSE131907. corr: Spearman correlation coefficient between the cell type compositions of two samples.
Fig. 2
Fig. 2. Subclassification and characterization of epithelial cells in MPLCs.
a Heatmap of CNV profiles estimated from scRNA-seq of tumor lesions from each patient. The vertical axis is arranged by origin patients, samples, cell malignant or not, and on the CNV-based clustering results. The horizontal axis displays all chromosomes in numerical order. kmCluster: the k-means clustering results of epithelial cells based on the CNV profiles. cellMN: whether the cell is malignant or not. b UMAP plot colored by the sub-populations of epithelial cells. c Dot plot of the expression of marker genes for the epithelial cell sub-populations. d Bar plot of the bootstrap proportions of epithelial cell sub-populations within each measured sample. e The epithelial cell sub-population proportions in tumor lesions (red) or the adjacent normal tissues (blue) from the four MPLC patients. Data represent mean ± s.d. **P < 0.01, t test, unpaired. f UMAP view of the clustering results (left) and CLDN2+ AT2 signatures (right) of epithelial cells from both the MPLCs patients and the dataset GSE131907. Batch effects were removed by harmony. The CLDN2+ AT2 signature was calculated based on the cell-wise gene set variation analysis, and the top15 ranked (based on P-values) marker genes for the CLDN2+ AT2 subtype were utilized as the signature gene set. g Pie plot of the data source of cells in Cluster 5 in (f). h Box plot of the differential expressions of CLDN2 between cells from the MPLC patients and GSE131907. Wilcox test, unpaired. i Immunohistochemistry (IHC) of CLDN2 expressions on the MPLCs samples. Samples NM_R_P2 and TM_R_P2 were taken as examples. Red border area was magnified and presented on the right. j Box plot of the differential CLDN2 IHC scores in MPLCs, IPM and solitary LUAD. Each IPM or MPLCs patient possessed two LUAD lesions at ipsilateral different lobes. Wilcox test, unpaired.
Fig. 3
Fig. 3. The CLDN2+ AT2 cells possess a stationary state.
a, b Pseudotime trajectories of malignant epithelial cells in patient P2 are colored by the pseudotime (a) and states (b). c Pseudotime trajectories splitted by epithelial cell subtypes in patient P2. d Box plot of differences in pseudotimes between AT2 and CLDN2+ AT2 cells. Wilcox test, unpaired. e Heatmap of the pseudotime-dependent expression alterations of epithelial subtype marker genes. f Pathway enrichment results based on the marker genes of each epithelial subtype. Colors represent different subtypes. P: hypergeometric distribution. g Violin plot of the expressions of CLDN2-relevant cellular senescence marker genes in different epithelial cell subtypes. h Violin plot of the differential expression of CLDN2-relevant cellular senescence marker genes between CLDN2+ AT2 cells from the tumor and normal tissues. Wilcox test, unpaired. ****P < 0.0001.
Fig. 4
Fig. 4. Cell–cell interactions in MPLCs.
a Heatmap of the cell–cell interactions between different cell types. The row and column, respectively, stand for the source and target cell types of the interactions. The top and right colored bar plot respectively represent the sum of column and row of values displayed in the heatmap. b Scatter plot of the interaction strength of different cell types. c Bubble plot of the interactions originated from the CLDN2+ AT2 cells and mediated by MDK. d Bar plot of the summarized communication probabilities on signaling pathways based on the interactions from fibroblast cells to CLDN2+ AT2 cells. e UMAP plot of the subpopulations of fibroblast cells. Myo: myofibroblast, SMC: smooth muscle cells. f Bar plot of the average proportions of each fibroblast cell sub-population in tumor and tumor-adjacent tissues. Data represent mean ± s.d. *P < 0.05, t test, unpaired.
Fig. 5
Fig. 5. Spatial features of different cell types in MPLCs.
a UMAP plot of 37616 spatial spots colored by cell types. The cell types of each spot were predicted by integrating the ST-seq data with the scRNA-seq data. b Spatial RNA-seq barcoded spots of the samples from patients P1 and P2, labeled by the predicted cell types. c Box plot of the difference of consistent scores of spots from tumor and normal tissues of the same patient in terms of different dominant cell types. d Box plot of the difference of consistent scores of spots from different tumor lesions of the same patient in terms of different dominant cell types. e Spatial spots colored by the predicted dominant epithelial cell subtypes. Four samples were displayed as examples. f Box plot of the difference of consistent scores of the spatial spots dominated by different epithelial cell subtypes. g Violin plot of the difference of consistent scores of spots from tumor and normal tissues in terms of different dominant epithelial cell subtypes. Kruskal test, unpaired.
Fig. 6
Fig. 6. The cellular and molecular profiles of different histologic patterns in MPLC-LUAD.
a Pathological classification of malignant regions into histologic patterns including lepidic type (PR1), acinar type (PR2), micropapillary type (PR3), minimally invasive (PRm) and adenocarcinoma in situ (PRa). b The main cell type compositions of the pathological regions across the four investigated samples. c Boxplot of the proportions of different epithelial cell sub-populations in the pathological regions across all the investigated samples. t test, unpaired. AT2 and CLDN2+ AT2 are, respectively, compared to the other sub-populations. d Violin plot of the spatially resolved high expression of PDZK1IP1 in the region PR1. e KM-plot of the survival curves of patients in GSE30219. The patients were separated into two groups based on the expression of PDZK1IP1. f Bar plot of the mean fold change of PR3 marker genes shared by the three observed samples. g, h KM-plot of the survival curves of TCGA-LUAD patients. The patients were separated into two groups according to whether the expression of RANBP1 (g) and MDH2 (h) was higher than the median level. i. Spatial neighbors (the nearest three circles of spots) of the malignant regions. Colors represent different malignant regions. Sample TM_R_P3 is displayed as one example. j Box plot of the difference of cell compositions between the malignant regions and corresponding spatial neighbors. t test, unpaired.
Fig. 7
Fig. 7. Molecular and cellular commonness and differences between lesions within the same MPLCs patient.
a Scatter plot of the differential expressions of genes in the two different tumor lesions comparing to the corresponding adjacent normal tissues in each of the four MPLC patients. The x-axis represents the average log2FC (avg_logFC) computed by comparing the tumor and normal tissues in the inferior lobe (TIVSNI) of one patient. The y-axis represents the average log2FC (avg_logFC) computed by comparing the tumor and normal tissues in the other diseased lobe (TOthersVSNOthers) of one patient. The point colors represent the significance type. b Summary of the number of different significant types of genes identified based on each patient. c Summary of the number of different significant types of genes identified based on each cell type and each patient. d Seven Genes showed expressional change in all four MPLCs patients in certain cell types. e Box plot of the seven gene expressions in normal and tumor tissues based on the TCGA-LUAD dataset (p-value: kruskal test). f Violin plot of the expressions of TNFRSF18 across T&NK cell subpopulations. g Violin plot of the expressions of TNFRSF18 across all samples. h Spatially featured plot of the expressions of TNFRSF18 in two samples of P1.

References

    1. Siegel RL, Miller KD, Fuchs HE, Jemal A. Cancer Statistics, 2021. CA Cancer J Clin. 2021;71:7–33. doi: 10.3322/caac.21654. - DOI - PubMed
    1. Yang D, Liu Y, Bai C, Wang X, Powell CA. Epidemiology of lung cancer and lung cancer screening programs in China and the United States. Cancer Lett. 2020;468:82–7. doi: 10.1016/j.canlet.2019.10.009. - DOI - PubMed
    1. Zhao L, Liu C, Xie G, Wu F, Hu C. Multiple primary lung cancers: a new challenge in the era of precision medicine. Cancer Manag Res. 2020;12:10361–74. doi: 10.2147/CMAR.S268081. - DOI - PMC - PubMed
    1. Mascalchi M, Comin CE, Bertelli E, Sali L, Maddau C, Zuccherelli S, et al. Screen-detected multiple primary lung cancers in the ITALUNG trial. J Thorac Dis. 2018;10:1058–66. doi: 10.21037/jtd.2018.01.95. - DOI - PMC - PubMed
    1. Detterbeck FC, Franklin WA, Nicholson AG, Girard N, Arenberg DA, Travis WD, et al. The IASLC Lung Cancer Staging Project: background data and proposed criteria to distinguish separate primary lung cancers from metastatic foci in patients with two lung tumors in the forthcoming eighth edition of the TNM classification for lung cancer. J Thorac Oncol. 2016;11:651–65. doi: 10.1016/j.jtho.2016.01.025. - DOI - PubMed

Publication types