. 2023 Jul 24;9(1):258.
doi: 10.1038/s41420-023-01518-7.

A burns and COVID-19 shared stress responding gene network deciphers CD1C-CD141- DCs as the key cellular components in septic prognosis

Affiliations

A burns and COVID-19 shared stress responding gene network deciphers CD1C-CD141- DCs as the key cellular components in septic prognosis

Qiao Liang et al. Cell Death Discov. .

Abstract

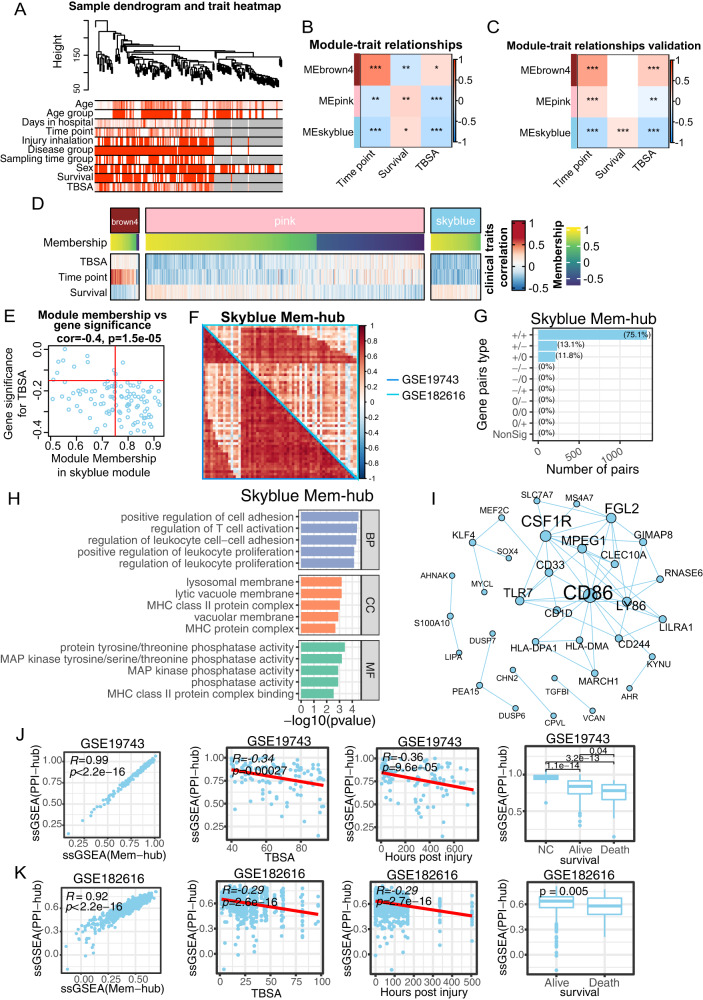
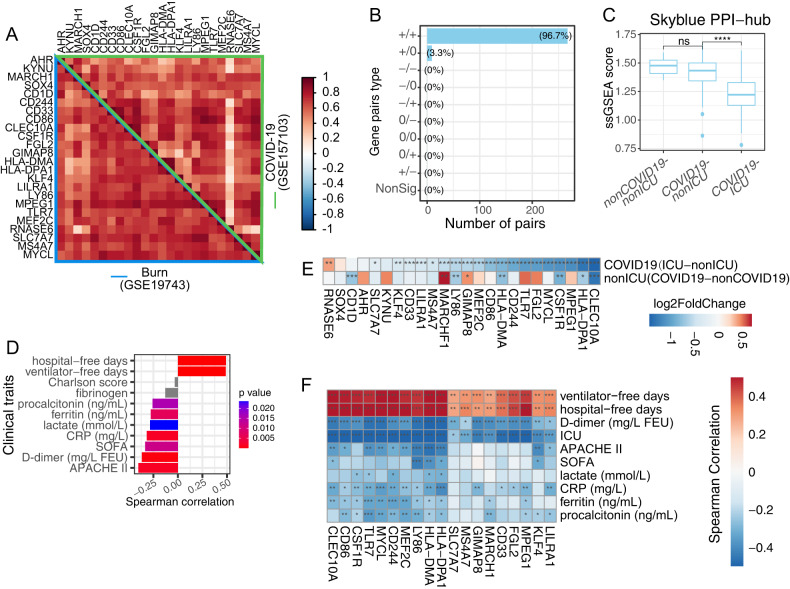
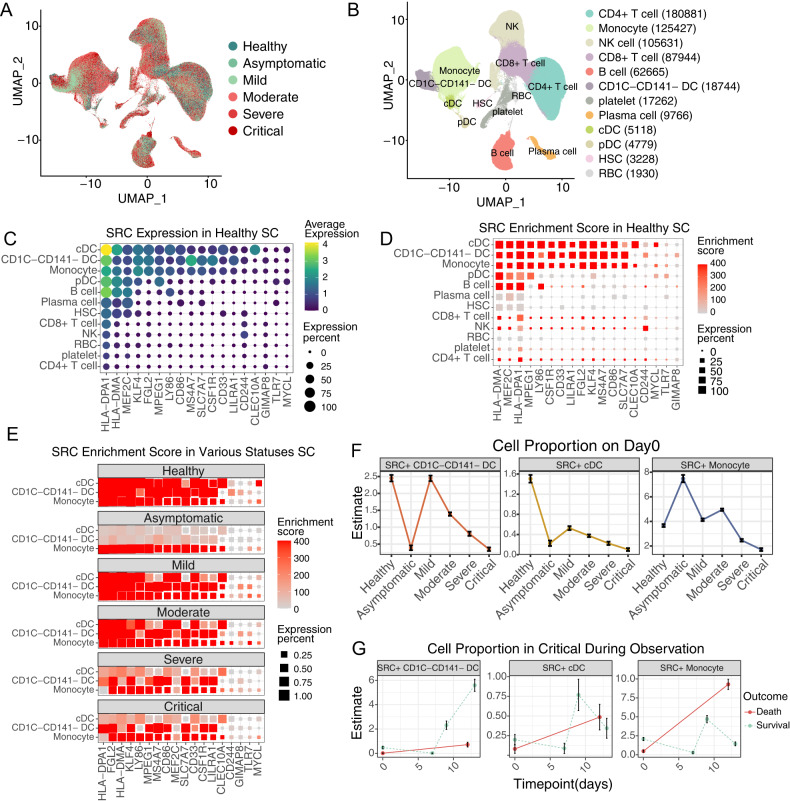
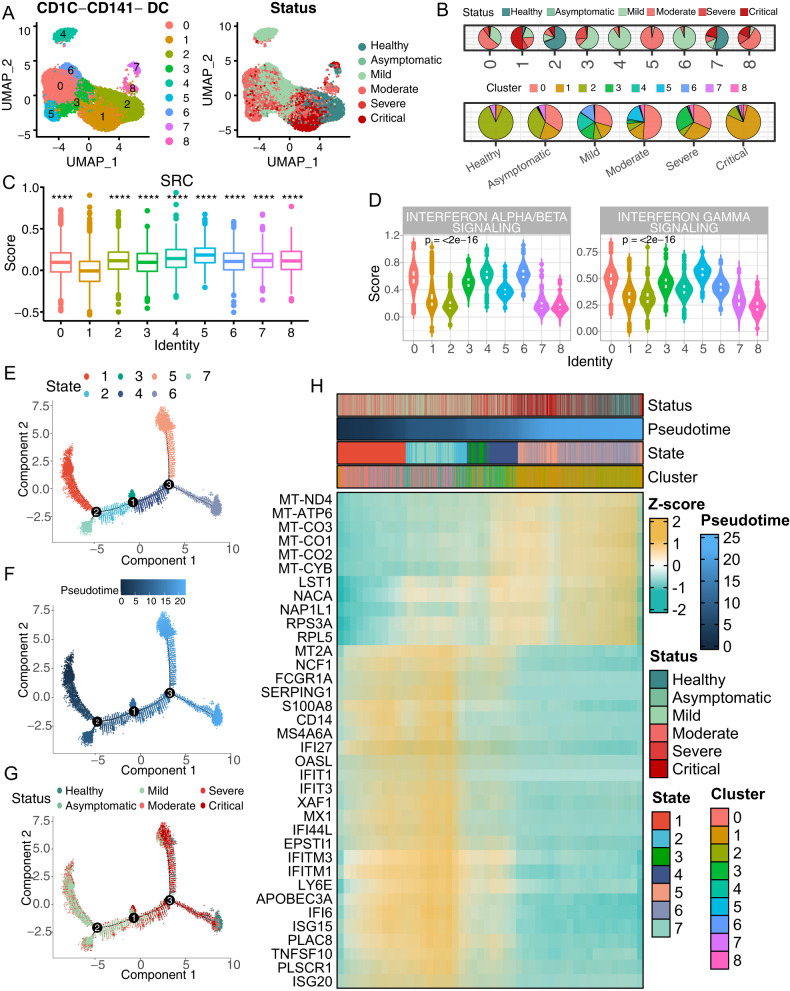
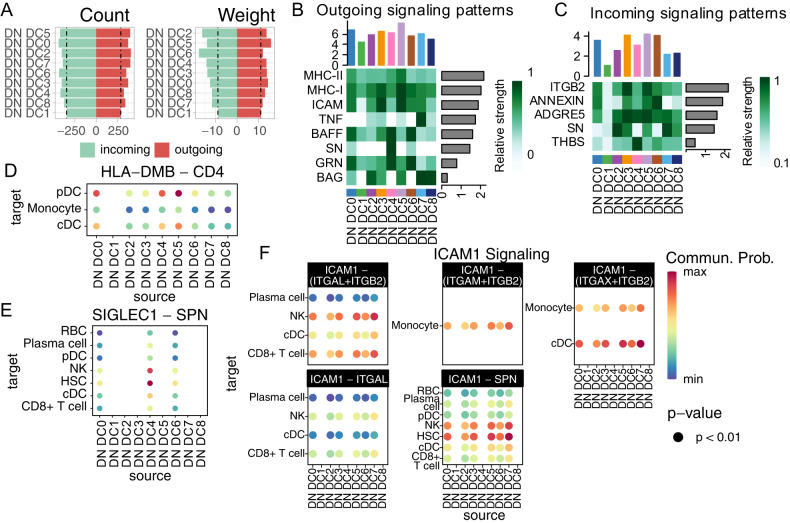
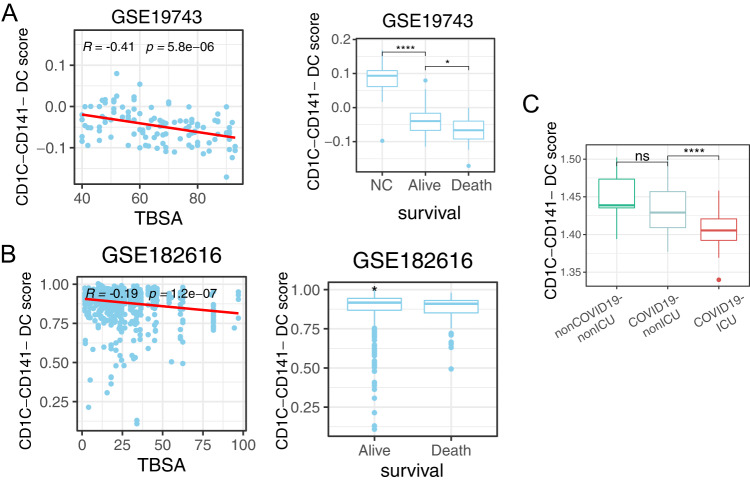
Differential body responses to various stresses, infectious or noninfectious, govern clinical outcomes ranging from asymptoma to death. However, the common molecular and cellular nature of the stress responsome across different stimuli is not described. In this study, we compared the expression behaviors between burns and COVID-19 infection by choosing the transcriptome of peripheral blood from related patients as the analytic target since the blood cells reflect the systemic landscape of immune status. To this end, we identified an immune co-stimulator (CD86)-centered network, named stress-response core (SRC), which was robustly co-expressed in burns and COVID-19. The enhancement of SRC genes (SRCs) expression indicated favorable prognosis and less severity in both conditions. An independent whole blood single-cell RNA sequencing of COVID-19 patients demonstrated that the monocyte-dendritic cell (Mono-DC) wing was the major cellular source of SRC, among which the higher expression of the SRCs in the monocyte was associated with the asymptomatic COVID-19 patients, while the quantity-restricted and function-defected CD1C-CD141-DCs were recognized as the key signature which linked to bad consequences. Specifically, the proportion of the CD1C-CD141-DCs and their SRCs expression were step-wise reduced along with worse clinic conditions while the subcluster of CD1C-CD141-DCs from the critical COVID-19 patients was characterized of IFN signaling quiescence, high mitochondrial metabolism and immune-communication inactivation. Thus, our study identified an expression-synchronized and function-focused gene network in Mono-DC population whose expression status was prognosis-related and might serve as a new target of diagnosis and therapy.


Conflict of interest statement

The authors declare no competing interests.

Figures

Fig. 1
Fig. 1. CD86-centered gene network was the robust and prognostic core signature of burns systematic alternation.
A Clustering dendrogram of samples in burns dataset (GSE19743) based on expression pattern. The clinical information was represented by red color whose intensity was proportional to older age, longer hospital-stay days, later time point of sample-collection, injury inhalation, burns condition, male, survival as well as larger TBSA. Representative heatmap of vital module eigengenes and clinical trait correlation in GSE19743 (B) and GSE182616 (C). D Heatmap of genes membership and clinical-traits correlation in the vital modules. E Skyblue module genes membership and correlation with TBSA. The red line represented the threshold of mem-hub pick-up which was 0.75 and -0.15 for membership and gene significance for TBSA, representatively. F Pearson correlation heatmap of skyblue mem-hub genes of GSE19743 and GSE182616 datasets. The left-bottom and right-top part of heatmap is based on GSE19743 and GSE182616, respectively. G Barplot of DGCA based on skyblue mem-hub genes between GSE19743 and GSE182616. Each gene pair is classed as positive (+), negative (−) and non-significant (0) and grouped by combination of GSE19743 and GSE182616 datasets. H PPI Network of skyblue mem-genes. The size of node and gene label represent the degree of specific node. (I) Barplot of top skyblue mem-hub genes GO enrichment items ordered by p value. SsGSEA scores of skyblue PPI-hub genes and mem-hub and correlation (left), as well as correlated with TBSA (middle-left), time point (middle-right) and survival (right) in GSE19743 (J) and GSE182616 (K). Pearson and Spearman correlation was applied for PPI-hub with mem-hub and clinical traits, respectively. *P < 0.05, **P < 0.01, ***P < 0.001.
Fig. 2
Fig. 2. Burns’ core gene net was conserved in both membership and clinical-trait correlation in COVID-19.
A Pearson correlation heatmap of skyblue PPI-hub genes in burns (GSE19743) and COVID-19 (GSE157103) datasets. The left-bottom and right-top represent burns and COVID-19 datasets and marked by blue and green color, respectively. B Barplot of skyblue PPI-hub gene pairs differential correlation on burns and COVID-19 datasets based on DGCA analysis. Each gene pair is classed as positive (+), negative (−) and non-significant (0) and grouped by combination of GSE19743 and GSE157103 datasets. C Boxplot of ssGSEA sore of skyblue PPI-hub genes across disease conditions in COVID-19 GSE157103 datasets. D Barplot of Spearman correlation index of skyblue PPI-hub ssGSEA score with COVID-19 patients clinical traits. The bar color represents the Spearman correlation p values and p ≥ 0.05 was colored by grey. E DEG log2FoldChange heatmap of skyblue PPI-hub genes in GSE157103 dataset. The color indicated the log2FoldChange in each disease status comparison. F Spearman correlation coefficient heatmap of SRC genes in GSE157103 dataset. *P < 0.05, **P < 0.01, ***P < 0.001.
Fig. 3
Fig. 3. CD1C-CD141- DCs are distinctive and prognostic cell source of SRC genes in COVID-19 scRNA-seq.
UMAP dimensionality reduction embedding of healthy and COVID-19 patients peripheral blood mononuclear cells after QC and colored by disease status (A) and annotated cell types (B). The numbers indicated the cell number of each cell type in (B). C SRC genes expression dot plot in healthy subjects. The dot color and size indicated the scaled expression level and percentage. D SRC enrichment score of each cell type in healthy subjects. The square color and size represented the enrichment score and expression percentage. E SRC enrichment score of CD1C-CD141- DCs, monocytes and cDCs across the disease statuses. The square color and size represented the enrichment score and expression percentage. F SRC + CD1C-CD141- DCs, monocytes and cDCs proportion of different disease statuses on sample-collection time. The error bar represented the 95% confidence interval and the y axis represented the cell percentage. G SRC + CD1C-CD141- DCs, monocytes and cDCs proportion of critical COVID-19 patients during disease progression. The outcome was annotated by line color. The error bar represented the 95% confidence interval. ****P < 0.0001.
Fig. 4
Fig. 4. CD1C-CD141- DCs subcluster of critical COVID-19 patients is IFN- unresponsive.
A UMAP embedding visualization of CD1C-CD141- DC sub-clusters which colored by cluster identity (left) and disease status (right). B Pie chart of CD1C-CD141- DCs composition in each cluster (top) and disease status (bottom), respectively. C Boxplot of SRC genes score among each CD1C-CD141- DC sub-clusters. Cluster1 was compared to the other clusters. D Violin plot of Interferon signaling score across each CD1C-CD141- DC sub-clusters. Kruskal-Wallis test p value was annotated on the top left. UMAP visualization of CD1C-CD141- DC trajectories colored by state (E), pseudotime (F), and disease status (G). H Representative heatmap of differentially expressed and correlated with pseudotime genes.
Fig. 5
Fig. 5. CD1C-CD141- DCs subcluster of critical COVID-19 patients is immune-crosstalk quiet with other immune cells.
A Barplot of CD1C-CD141- DC subclusters overall signaling pathway count (left) and weight (right). The bar was colored by the incoming and outgoing status. DN DC: CD1C-CD141- DC. Representative heatmap of CD1C-CD141- DC outgoing (B) and incoming (C) signaling relative strength. Representative dot plot of CD1C-CD141-DC outgoing signaling, including HLA-DMB–CD4 (D), SIGLEC1-SPN (E) and ICAM1 (F) signaling. The dot size indicated the p value and the color represent communication probability. DN DC represents CD1C-CD141-DC.
Fig. 6
Fig. 6. CD1C-CD141- DCs gene markers were related to clinical traits in burn and COVID-19 bulk transcriptomes.
CD1C-CD141- DCs gene marker scores correlated with TBSA (left) and prognosis (right) in burns transcriptome datasets of GSE19743 (A) and GSE182616 (B). C Boxplot of CD1C-CD141- DCs gene marker scores in COVID-19 transcriptome dataset. P values were adjusted by FDR. *P < 0.05, **P < 0.01, ***P < 0.001.

Similar articles

References

    1. Yaribeygi H, Panahi Y, Sahraei H, Johnston TP, Sahebkar A. The impact of stress on body function: a review. EXCLI J. 2017;16:1057–72. doi: 10.17179/excli2017-480. - DOI - PMC - PubMed
    1. Hosseini A, Hashemi V, Shomali N, Asghari F, Gharibi T, Akbari M, et al. Innate and adaptive immune responses against coronavirus. Biomed Pharmacother. 2020;132:110859. doi: 10.1016/j.biopha.2020.110859. - DOI - PMC - PubMed
    1. Lord JM, Midwinter MJ, Chen YF, Belli A, Brohi K, Kovacs EJ, et al. The systemic immune response to trauma: an overview of pathophysiology and treatment. Lancet. 2014;384:1455–65. doi: 10.1016/S0140-6736(14)60687-5. - DOI - PMC - PubMed
    1. Osuka A, Ogura H, Ueyama M, Shimazu T, Lederer JA. Immune response to traumatic injury: harmony and discordance of immune system homeostasis. Acute Med Surg. 2014;1:63–9. doi: 10.1002/ams2.17. - DOI - PMC - PubMed
    1. Tsirigotis P, Chondropoulos S, Gkirkas K, Meletiadis J, Dimopoulou I. Balanced control of both hyper and hypo-inflammatory phases as a new treatment paradigm in sepsis. J Thorac Dis. 2016;8:E312–6. doi: 10.21037/jtd.2016.03.47. - DOI - PMC - PubMed