. 2023 Jul 24;14(1):4452.
doi: 10.1038/s41467-023-40142-y.

Glial Draper signaling triggers cross-neuron plasticity in bystander neurons after neuronal cell death in Drosophila

Affiliations

Glial Draper signaling triggers cross-neuron plasticity in bystander neurons after neuronal cell death in Drosophila

Yupu Wang et al. Nat Commun. .

Abstract

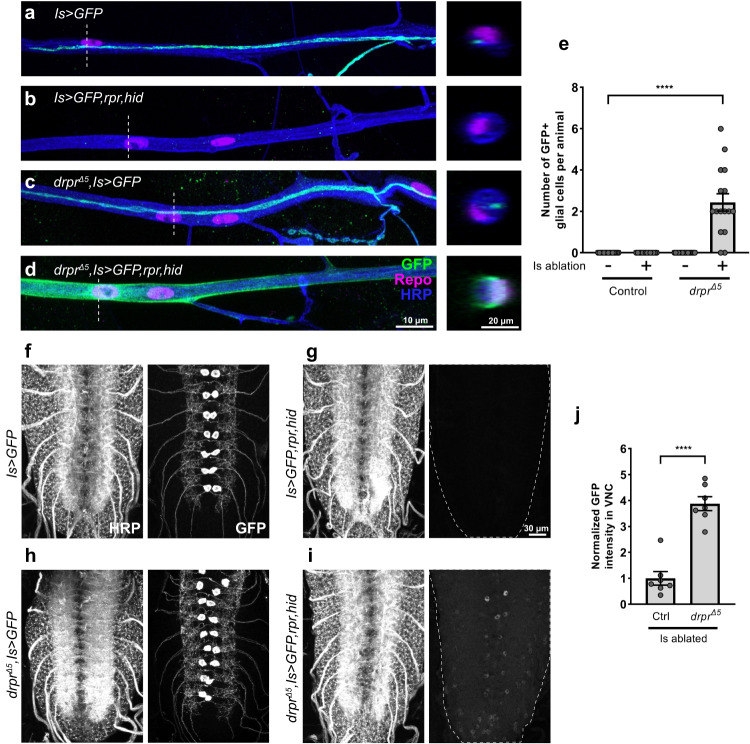
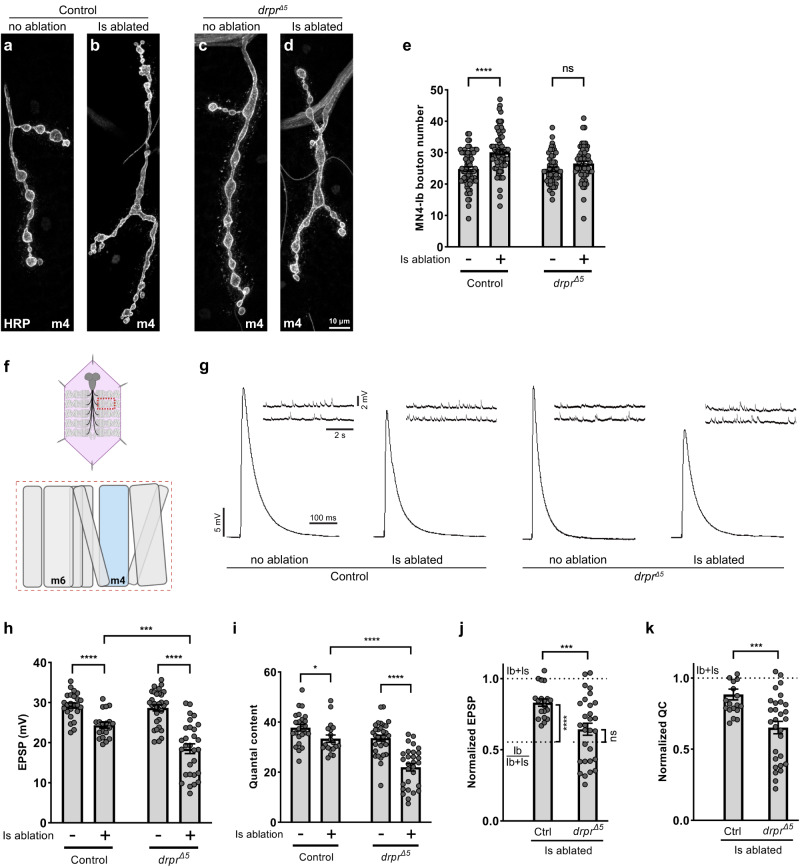
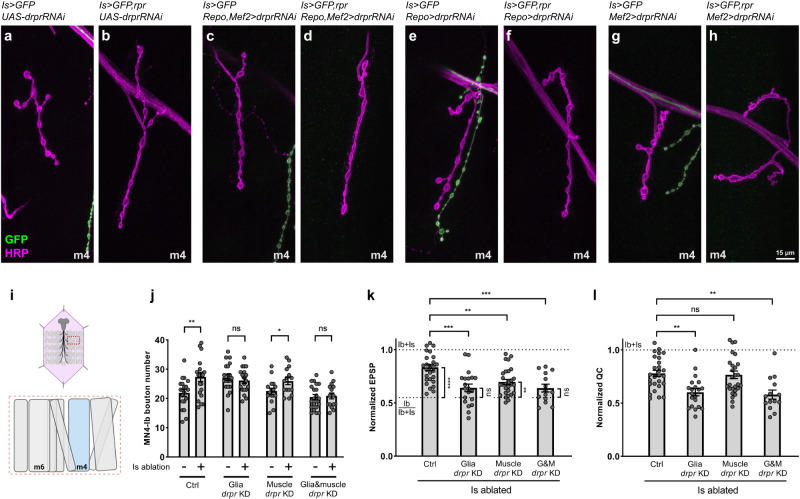
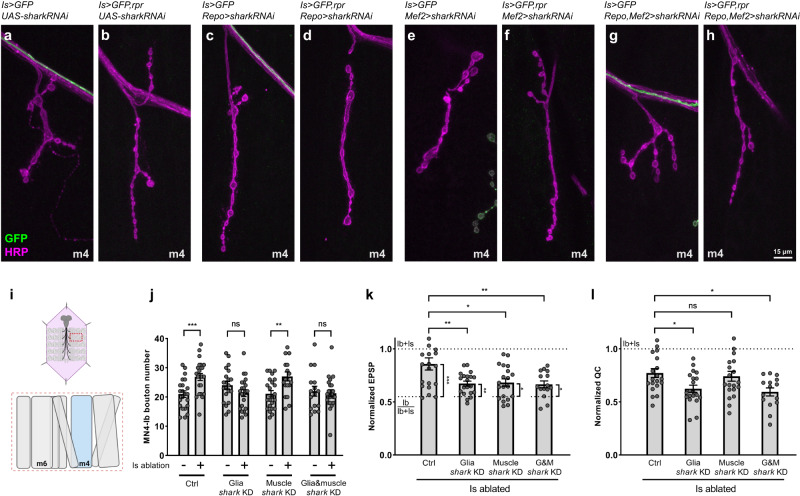
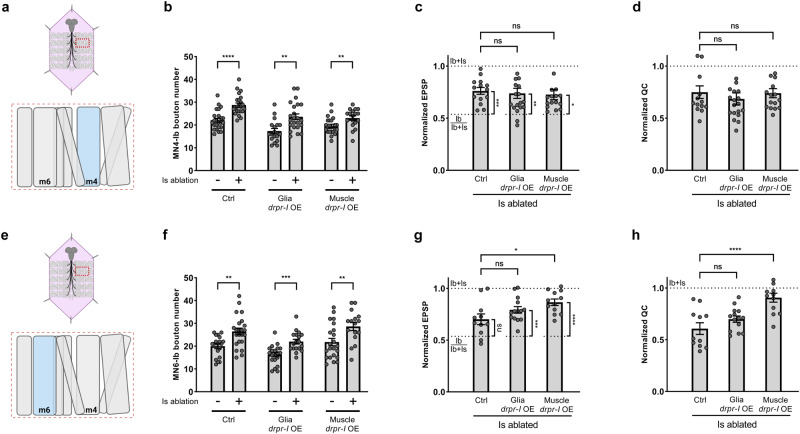
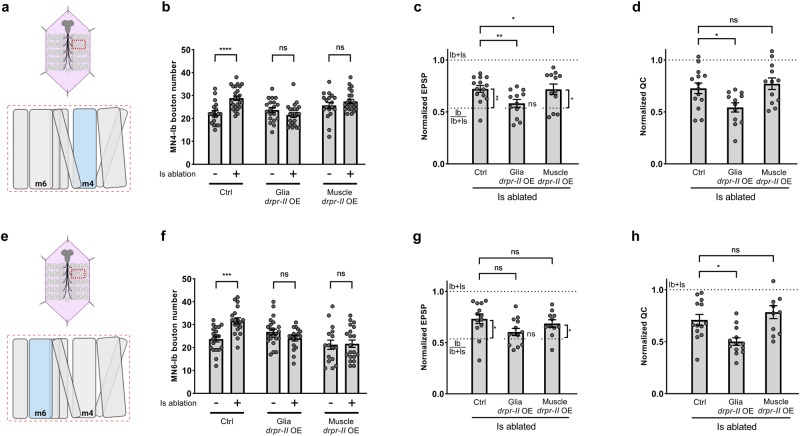
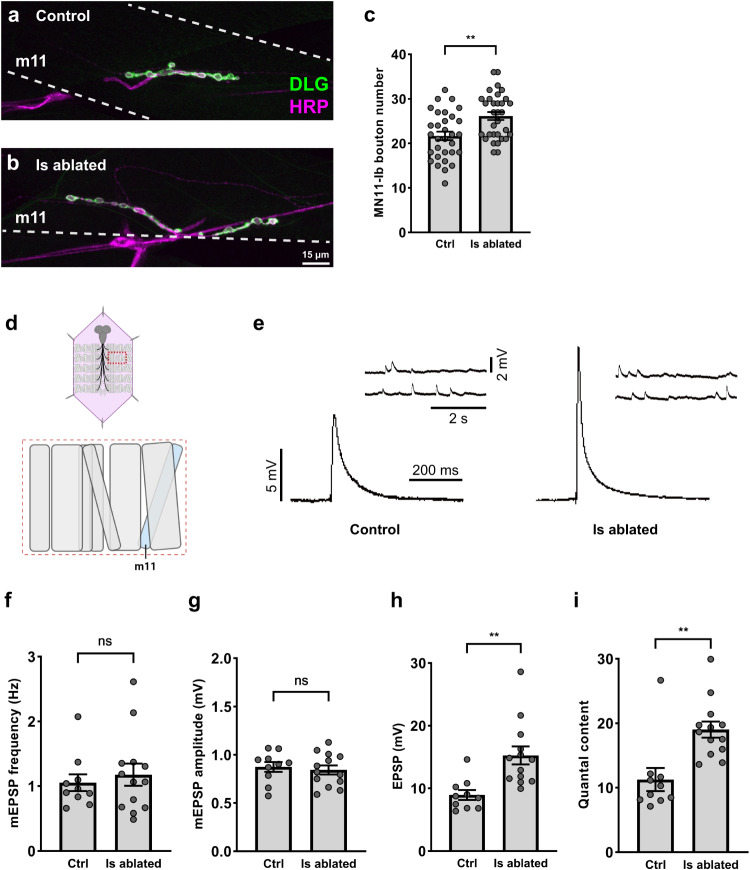
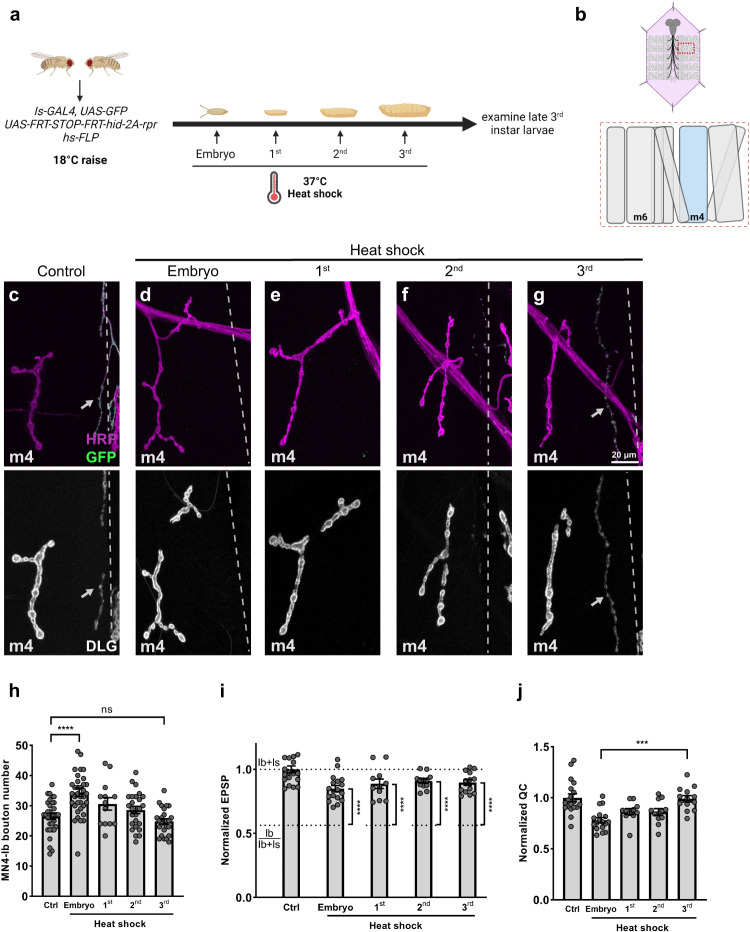
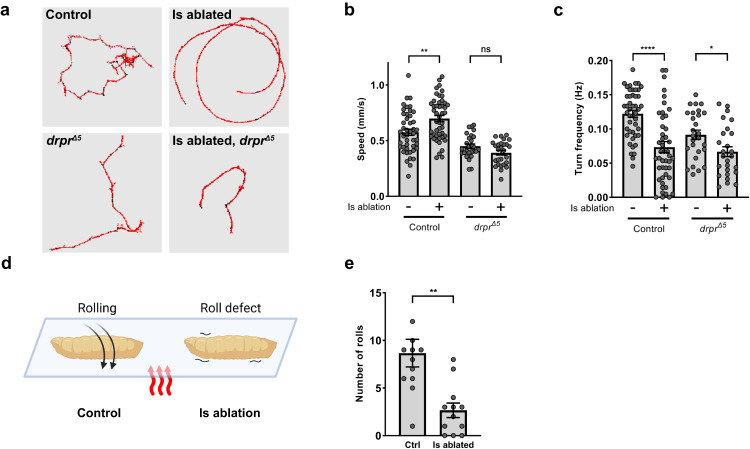
Neuronal cell death and subsequent brain dysfunction are hallmarks of aging and neurodegeneration, but how the nearby healthy neurons (bystanders) respond to the death of their neighbors is not fully understood. In the Drosophila larval neuromuscular system, bystander motor neurons can structurally and functionally compensate for the loss of their neighbors by increasing their terminal bouton number and activity. We term this compensation as cross-neuron plasticity, and in this study, we demonstrate that the Drosophila engulfment receptor, Draper, and the associated kinase, Shark, are required for cross-neuron plasticity. Overexpression of the Draper-I isoform boosts cross-neuron plasticity, implying that the strength of plasticity correlates with Draper signaling. In addition, we find that functional cross-neuron plasticity can be induced at different developmental stages. Our work uncovers a role for Draper signaling in cross-neuron plasticity and provides insights into how healthy bystander neurons respond to the loss of their neighboring neurons.


Conflict of interest statement

The authors declare no competing interests.

Figures

Fig. 1
Fig. 1. Draper is required for debris clearance after Is MN ablation.
Axon bundles in third instar (a) non-ablated control (Is > GFP), (b) Is ablated (Is > GFP,hid,rpr), (c) non-ablated draper mutant (drprΔ5, Is > GFP) and (d) Is ablated draper mutant (drprΔ5, Is > GFP,hid,rpr) larvae, labeled with GFP (green), Repo (glial cell marker, magenta) and HRP (neuronal marker, blue). Gray dashed lines indicate the position of cross sections. Significant GFP positive debris accumulated in glial cells when ablating Is MNs in a draper mutant background. e Quantification of the number of GFP+ glial cells per animal. F(3,57) = 14.09, p < 0.0001, One-way ANOVA. N (larvae) =15, 14, 16, 16. fi VNCs of first instar larvae of displayed genotypes labeled with HRP and GFP. Note the significant amount of GFP signal remaining in (i). j Quantification of GFP intensity in VNC. t(12) = 7.703, p < 0.0001, unpaired t test, two-tailed. N (VNCs) = 7, 7. Error bars indicate ± SEM, ****p < 0.0001.
Fig. 2
Fig. 2. Draper is required for cross-neuron plasticity.
NMJs of MN4-Ib in third instar (a) non-ablated control (Is > GFP), (b) Is ablated (Is > GFP,hid,rpr), (c) non-ablated draper mutant (drprΔ5, Is > GFP) and (d) Is ablated draper mutant (drprΔ5, Is > GFP,hid,rpr) larvae, labeled with HRP (gray). The NMJ was expanded in control Is ablated larvae due to cross-neuron plasticity (b), and this expansion is absent in a draper mutant background (d). e Quantification of MN4-Ib bouton numbers in non-ablated and Is ablated larvae in control and drprΔ5 backgrounds. Control (N = 66 and 69 NMJs), t(133) = 5.030, p < 0.0001, unpaired t test, two-tailed. drprΔ5 (N = 53 and 56 NMJs), t(107) = 1.838, p = 0.0688, unpaired t test, two-tailed. f Cartoon representation of a dissected larva (pink) and a hemisegment highlighted by dashed red rectangle. The target muscle examined in this figure is shown in blue. Cartoon is generated with Biorender. g EPSP and mEPSP traces from non-ablated and Is ablated larvae in control and drprΔ5 backgrounds. h Quantification of EPSP amplitude of non-ablated and Is ablated larvae in control and drprΔ5 backgrounds. Control, t(41) = 4.924, p < 0.0001, unpaired t test, two-tailed. drprΔ5, t(48.04) = 7.011, p < 0.0001, unpaired t test, two-tailed, with Welch’s correction. Is ablated control vs Is ablated in drprΔ5, t(43.54) = 4.075, p = 0.0002, unpaired t test, two-tailed, with Welch’s correction. i Quantification of quantal content of non-ablated and Is ablated larvae in control and drprΔ5 backgrounds. Control, t(41) = 2.224, p = 0.0317, unpaired t test, two-tailed. drprΔ5, t(58) = 6.194, p < 0.0001, unpaired t test, two-tailed. Is ablated control vs Is ablated in drprΔ5, t(46) = 5.304, p < 0.0001, unpaired t test, two-tailed. For (h) and (i), N (NMJs) = 24, 19, 31, 29. j Quantification of normalized EPSP of Is ablated larvae in control and drprΔ5 backgrounds. Is ablated control vs drprΔ5, t(43.20) = 3.753, p = 0.0005, unpaired t test, two-tailed, with Welch’s correction. Is ablated control vs Ib/Ib+Is, t(29) = 6.506, p < 0.0001, unpaired t test, two-tailed. Is ablated in drprΔ5 vs Ib/Ib+Is, t(37.82) = 1.524, p = 0.1357, unpaired t test, two-tailed, with Welch’s correction. k Quantification of normalized quantal content of Is ablated larvae in control and drprΔ5 backgrounds. t(46) = 3.730, p = 0.0005, unpaired t test, two-tailed. For (j, k), N (NMJs) = 19 and 29. Error bars indicate ± SEM, ns = non-significant, *p < 0.05, ***p < 0.001, ****p < 0.0001.
Fig. 3
Fig. 3. Draper is required in glial cells for cross-neuron plasticity.
ah NMJs of MN4-Ib in third instar non-ablated and Is ablated larvae in control, glia draper knockdown, muscle draper knockdown, and double knockdown backgrounds, labeled with GFP (green) and HRP (magenta). NMJ expansion was observed upon Is MN ablation (b), and this expansion is absent in double draper knockdown (d) and glial draper knockdown (h) backgrounds. i Cartoon representation of a dissected larva (pink) and a hemisegment highlighted by dashed red rectangle. The target muscle examined in this figure is shown in blue. Cartoon is generated with Biorender. j Quantification of MN4-Ib bouton number between non-ablated and Is ablated larvae in control, glia draper knockdown, muscle draper knockdown, and double knockdown backgrounds. Control (N = 20 and 21 NMJs), t(39) = 2.822, p = 0.0075, unpaired t test, two-tailed. Glia draper knockdown (N = 20 and 19 NMJs), t(37) = 0.7525, p = 0.4565, unpaired t test, two-tailed. Muscle draper knockdown (N = 16 and 15 NMJs), t(29) = 2.204, p = 0.0356, unpaired t test, two-tailed. Double knockdown (N = 21 and 16 NMJs), t(35) = 0.2965, p = 0.7686, unpaired t test, two-tailed. k Quantification of normalized EPSP of Is ablated larvae in control, glia draper knockdown, muscle draper knockdown, and double knockdown backgrounds. F(3, 85) = 9.191, p < 0.0001, One-way ANOVA. Is ablated control vs glia draper knockdown, p = 0.0001. Is ablated control vs muscle draper knockdown, p = 0.0042. Is ablated control vs double knockdown, p = 0.0006. Is ablated control vs Ib/Ib+Is, t(37) = 5.462, p < 0.0001, unpaired t test, two-tailed. Is ablated in glia draper knockdown vs Ib/Ib+Is, t(30) = 1.483, p = 0.1486, unpaired t test, two-tailed. Is ablated in muscle draper knock down vs Ib/Ib+Is, t(38) = 3.178, p = 0.0029, unpaired t test, two-tailed. Is ablated in double knockdown vs Ib/Ib+Is, t(24) = 1.540, p = 0.1367, unpaired t test, two-tailed. l Quantification of normalized quantal content of Is ablated larvae in control, glia draper knockdown, muscle draper knockdown, and double knockdown backgrounds. F(3, 85) = 8.263, p < 0.0001, One-way ANOVA. Is ablated control vs glia draper knockdown, p = 0.0028. Is ablated control vs muscle draperknock down, p = 0.9913. Is ablated control vs double knockdown, p = 0.0052. For (k, l), (NMJs) = 27, 20, 28, 14. Error bars indicate ± SEM, ns = non-significant, *p < 0.05, **p < 0.01, ***p < 0.001.
Fig. 4
Fig. 4. Shark is required in glial cells for cross-neuron plasticity.
ah NMJs of MN4-Ib in third instar larvae of non-ablated and Is ablated larvae in control, glia shark knockdown, muscle shark knockdown, and double knockdown backgrounds, labeled with GFP (green) and HRP (magenta). NMJ expansion was observed upon Is MN ablation (b), which is blocked by glia shark knockdown (d) or double knockdown (h). i Cartoon representation of a dissected larva (pink) and a hemisegment highlighted by dashed red rectangle. The target muscle examined in this figure is shown in blue. Cartoon is generated with Biorender. j Quantification of MN4-Ib bouton number in non-ablated and Is ablated larvae in control, glial shark knockdown, muscle shark knockdown, and double knockdown backgrounds. Control (N = 22 and 23 NMJs), t(43) = 3.598, p = 0.0008, unpaired t test, two-tailed. Glial shark knockdown (N = 21 and 22 NMJs), t(41) = 1.566, p = 0.1250, unpaired t test, two-tailed. Muscle shark knockdown (N = 23 and 19 NMJs), t(40) = 3.220, p = 0.0025, unpaired t test, two-tailed. Double shark knockdown (N = 16 and 22 NMJs), t(36) = 0.3390, p = 0.7366, unpaired t test, two-tailed. k Quantification of normalized EPSP of Is ablated larvae in control, glia shark knockdown, muscle shark knockdown, and double knockdown backgrounds. F(3, 71) = 5.533, p = 0.0018, One-way ANOVA. Is ablated control vs glia shark knockdown, p = 0.0062. Is ablated control vs muscle shark knockdown, p = 0.0105. Is ablated control vs double knockdown, p = 0.0093. Is ablated control vs Ib/Ib+Is, t(28.04) = 4.485, p = 0.0001, unpaired t test, two-tailed, with Welch’s correction. Is ablated in glia shark knockdown vs Ib/Ib+Is, t(30) = 2.798, p = 0.0089, unpaired t test, two-tailed. Is ablated in muscle shark knockdown vs Ib/Ib+Is, t(30) = 2.329, p = 0.0268, unpaired t test, two-tailed. Is ablated in double knockdown vs Ib/Ib+Is, t(25) = 2.254, p = 0.0332, unpaired t test, two-tailed. l Quantification of normalized quantal content of Is ablated larvae in control, glia shark knockdown, muscle shark knockdown, and double knockdown backgrounds. F(3, 71) = 4.437, p = 0.0065, One-way ANOVA. Is ablated control vs glia shark knockdown, p = 0.0466. Is ablated control vs muscle shark knockdown, p = 0.9470. Is ablated control vs double knockdown, p = 0.0214. For (k, l), N (NMJs) = 20, 20, 20, 15. Error bars indicate ± SEM, ns = non-significant, *p < 0.05, **p < 0.01, ***p < 0.001.
Fig. 5
Fig. 5. Overexpression of Draper-I boosts cross-neuron plasticity of MN6-Ib.
a Cartoon representation of a dissected larva (pink) and a hemisegment highlighted by dashed red rectangle. The target muscle examined in (bd) is shown in blue. Cartoon is generated with Biorender. b Quantification of MN4-Ib bouton number in non-ablated and Is ablated larvae in control, glia draper-I overexpression, and muscle draper-I overexpression backgrounds. Control (N = 24 and 23 NMJs), t(45) = 5.321, p < 0.0001, unpaired t test, two-tailed. Glia draper-I overexpression (N = 18 and 23 NMJs), t(39) = 3.557, p = 0.001, unpaired t test, two-tailed. Muscle draper-I overexpression (N = 23 and 18 NMJs), t(39) = 2.844, p = 0.0071, unpaired t test, two-tailed. c Quantification of normalized EPSP of MN4-Ib in Is ablated larvae in control, glia draper-I overexpression, and muscle draper-I overexpression backgrounds. F(2, 46) = 0.8117, p = 0.4504, One-way ANOVA. Is ablated control vs glia draper-I overexpression, p = 0.9333. Is ablated control vs muscle draper-I overexpression, p = 0.8633. Is ablated control vs Ib/Ib+Is, t(24) = 4.335, p = 0.0002, unpaired t test, two-tailed. Is ablated in glia draper-I overexpression vs Ib/Ib+Is, t(28.3) = 3.001, p = 0.0056, unpaired t test, two-tailed, with Welch’s correction. Is ablated in muscle draper-I overexpression vs Ib/Ib+Is, t(26) = 2.547, p = 0.0171, unpaired t test, two-tailed. d Quantification of normalized quantal content of MN4-Ib in Is ablated larvae in control, glia draper-I overexpression, and muscle draper-I overexpression backgrounds. F(2, 46) = 0.1383, p = 0.8712, One-way ANOVA. Is ablated control vs glia draper-I overexpression, p = 0.6839. Is ablated control vs muscle draper-I overexpression, p = 0.9923. For (c, d) N (NMJs) = 14, 19, 16. e Cartoon representation of a dissected larva (pink) and a hemisegment highlighted by dashed red rectangle. The target muscle examined in (fh) is shown in blue.. Cartoon is generated with Biorender. f Quantification of MN6-Ib bouton number in non-ablated and Is ablated larvae in control, glia draper-I overexpression, and muscle draper-I overexpression backgrounds. Control (N = 19 and 23 NMJs), t(40) = 3.493, p = 0.0012, unpaired t test, two-tailed. Glia draper-I overexpression (N = 20 and 18 NMJs), t(36) = 4.103, p = 0.0002, unpaired t test, two-tailed. Muscle draper-I overexpression (N = 22 and 16 NMJs), t(36) = 2.818, p = 0.0078, unpaired t test, two-tailed. g Quantification of normalized EPSP of MN6-Ib in Is ablated larvae in control, glia draper-I overexpression, and muscle draper-I overexpression backgrounds. F(2, 34) = 4.361, p = 0.0206, One-way ANOVA. Is ablated control vs glia draper-I overexpression, p = 0.2235. Is ablated control vs muscle draper-I overexpression, p = 0.0153. Is ablated control vs Ib/Ib+Is, t(19) = 2.074, p = 0.0519, unpaired t test, two-tailed. Is ablated in glia draper-I overexpression vs Ib/Ib+Is, t(22) = 4.041, p = 0.0005, unpaired t test, two-tailed. Is ablated in muscle draper-I overexpression vs Ib/Ib+Is, t(20) = 5.061, p < 0.0001, unpaired t test, two-tailed. h Quantification of normalized quantal content of MN6-Ib in Is ablated larvae in control, glia draper-I overexpression, and muscle draper-I overexpression backgrounds. F(2, 34) = 12.27, p < 0.0001, One-way ANOVA. Is ablated control vs glia draper-I overexpression, p = 0.2951. Is ablated control vs muscle draper-I overexpression, p < 0.0001. For (g, h), N (NMJs) = 11, 14, 12. Error bars indicate ± SEM, ns = non-significant, *p < 0.05, **p < 0.01, ***p < 0.001, ****p < 0.0001.
Fig. 6
Fig. 6. Overexpression of Draper-II suppress cross-neuron plasticity.
a Cartoon representation of a dissected larva (pink) and a hemisegment highlighted by dashed red rectangle. The target muscle examined in (bd) is shown in blue. Cartoon is generated with Biorender. b Quantification of MN4-Ib bouton number in non-ablated and Is ablated larvae in control, glia draper-II overexpression, and muscle draper-II overexpression backgrounds. Control (N = 19 and 24 NMJs), t(41) = 4.458, p < 0.0001, unpaired t test, two-tailed. Glia draper-II overexpression (N = 19 and 23 NMJs), t(40) = 1.440, p = 0.1578, unpaired t test, two-tailed. Muscle draper-II overexpression (N = 18 and 23 NMJs), t(39) = 1.114, p = 0.2720, unpaired t test, two-tailed. c Quantification of normalized EPSP of MN4-Ib in Is ablated larvae in control, glia draper-II overexpression, and muscle draper-II overexpression backgrounds. F(2, 35) = 1.535, p = 0.2296, One-way ANOVA. Is ablated control vs glia draper-II overexpression, p = 0.0466. Is ablated control vs muscle draper-II overexpression, p = 0.9980. Is ablated control vs Ib/Ib+Is, t(24) = 3.443, p = 0.0021, unpaired t test, two-tailed. Is ablated in glia draper-II overexpression vs Ib/Ib+Is, t(22) = 0.4045, p = 0.6897, unpaired t test, two-tailed. Is ablated in muscle draper-II overexpression vs Ib/Ib+Is, t(22) = 2.610, p = 0.0160, unpaired t test, two-tailed. d Quantification of normalized quantal content of MN4-Ib in Is ablated larvae in control, glia draper-II overexpression, and muscle draper-II overexpression backgrounds. F(2, 35) = 0.3700, p = 0.6934, One-way ANOVA. Is ablated control vs glia draper-II overexpression, p = 0.0370. Is ablated control vs muscle draper-II overexpression, p = 0.8123. For (c, d), N (NMJs) = 14, 12, 12. e Cartoon representation of a dissected larva (pink) and a hemisegment highlighted by dashed red rectangle. The target muscle examined in (fh) is shown in blue. Cartoon is generated with Biorender. f Quantification of MN6-Ib bouton number in non-ablated and Is ablated larvae in control, glia draper-II overexpression, and muscle draper-II overexpression backgrounds. Control (N = 19 and 19 NMJs), t(36) = 4.319, p = 0.0001, unpaired t test, two-tailed. Glia draper-II overexpression (N = 23 and 17 NMJs), t(38) = 1.626, p = 0.1122, unpaired t test, two-tailed. Muscle draper-II overexpression (N = 16 and 20 NMJs), t(34) = 0.1763, p = 0.8611, unpaired t test, two-tailed. g Quantification of normalized EPSP of MN6-Ib in Is ablated larvae in control, glia draper-II overexpression, and muscle draper-II overexpression backgrounds. F(2, 34) = 2.731, p = 0.0795, One-way ANOVA. Is ablated control vs glia draper-II overexpression, p = 0.0680. Is ablated control vs muscle draper-II overexpression, p = 0.7116. Is ablated control vs Ib/Ib+Is, t(21) = 2.606, p = 0.0165, unpaired t test, two-tailed. Is ablated in glia draper-II overexpression vs Ib/Ib+Is, t(21) = 1.008, p = 0.3250, unpaired t test, two-tailed. Is ablated in muscle draper-II overexpression vs Ib/Ib+Is, t(19) = 2.162, p = 0.0436, unpaired t test, two-tailed. h Quantification of normalized quantal content of MN6-Ib in Is ablated larvae in control, glia draper-II overexpression, and muscle draper-II overexpression backgrounds. F(2, 34) = 8.539, p = 0.0010, One-way ANOVA. Is ablated control vs glia draper-II overexpression, p = 0.0130. Is ablated control vs muscle draper-II overexpression, p = 0.5614. For (g, h), N (NMJs) = 13, 13, 11. Error bars indicate ± SEM, ns = non-significant, *p < 0.05, **p < 0.01.
Fig. 7
Fig. 7. MN11-Ib displayed cross-neuron plasticity upon Is ablation.
a, b NMJs of MN11-Ib in third instar control (Is > GFP) and Is ablated (Is > GFP,hid,rpr) larvae labeled with GFP (green) and HRP (magenta). Note the larger NMJs in Is ablated larvae. c Quantification of MN11-Ib bouton number in non-ablated (N = 31 NMJs) and Is ablated (N = 32 NMJs) larvae. t(61) = 3.408, p = 0.0012, unpaired t test, two-tailed. d Cartoon representation of a dissected larva (pink) and a hemisegment highlighted by dashed red rectangle. The target muscle examined in this figure is shown in blue (fi). Cartoon is generated with Biorender. e EPSP and mEPSP recordings of muscle 11 from non-ablated and Is ablated larvae. f Quantification of mEPSP frequency. t(21) = 0.5408, p = 0.5943, unpaired t test, two-tailed. g Quantification of mEPSP amplitude. t(21) = 0.4446, p = 0.6611, unpaired t test, two-tailed. h Quantification of EPSP amplitude. t(18.02) = 3.840, p = 0.0012, unpaired t test, two-tailed, with Welch’s correction. i Quantification of quantal content. t(21) = 3.657, p = 0.0015, unpaired t test, two-tailed. For (fi), N (NMJs) = 10, 13. Error bars indicate ± SEM, ns = non-significant, **p < 0.01.
Fig. 8
Fig. 8. Acute Is MN ablation induces functional plasticity, but not structural plasticity.
a Schematic of heat-shock induced Is MN ablation protocol. b Cartoon representation of a dissected larva (pink) and a hemisegment highlighted by dashed red rectangle. The target muscle examined in this figure is shown in blue. Cartoon is generated with Biorender. NMJs of MN4-Ib in late third instar larvae (hs-FLP,UAS-GFP/ + ;UAS-FRT stop FRT-hid-2A-rpr/+;Is-GAL4/+) with (c) no heat-shock, (d) embryo heat-shock, (e) first instar heat-shock, (f) second instar heat-shock and (g) third instar heat-shock, stained with GFP (green), HRP (magenta), and DLG (gray). In embryos and first and second instar heat-shocked larvae, the Is NMJs were fully cleared, while Is synaptic debris remains in third instar heat-shocked larvae. Arrows indicate the Is MN (c) or Is MN debris (g). h Quantification of MN4-Ib bouton number in late third instar larvae with Is MNs ablated at different developmental stages. F(4, 127) = 10.23, p < 0.0001, One-way ANOVA. Control vs embryo heat-shock, p < 0.0001. Control vs first instar heat shock, p = 0.3021. Control vs second instar heat-shock, p = 0.7310. Control vs third instar heat-shock, p = 0.8756. N (NMJs) = 33, 36, 13, 25, 25. i Comparison of the normalized EPSP of late third instar larvae with Is MNs ablated at different developmental stages to Ib/Ib+Is baseline. Embryo heat-shock, t(27) = 7.126, p < 0.0001, unpaired t test, two-tailed. First instar heat-shock, t(21) = 6.622, p < 0.0001, unpaired t test, two-tailed. Second instar heat-shock, t(22) = 9.485, p < 0.0001, unpaired t test, two-tailed. Third instar heat-shock, t(23) = 8.557, p < 0.0001, unpaired t test, two-tailed. j Quantification of normalized quantal content of late third instar larvae with Is ablated at different developmental stages. F(4, 67) = 9.109, p < 0.0001, One-way ANOVA. Embryo heat-shock vs third instar heat-shock, p = 0.0002. Non-significant for the others. This result suggested an increase of cross-neuron plasticity when acutely ablated Is MNs. For (i, j), N (NMJs) = 19, 17, 11, 12, 13. Error bars indicate ± SEM, ns = non-significant, ***p < 0.001, ****p < 0.0001.
Fig. 9
Fig. 9. Cross-neuron plasticity increases larval locomotion speed.
a Representative crawling traces. b Quantification of crawling speed. Control, t(84) = 3.107, p = 0.0026, unpaired t test, two-tailed. drprΔ5, t(52) = 1.991, p = 0.0517, unpaired t test, two-tailed. c Quantification of turn frequency. Control, t(72.67) = 4.518, p < 0.0001, unpaired t test, two-tailed, with Welch’s correction. drprΔ5, t(51) = 2.493, p = 0.0160, unpaired t test, two-tailed. For (b, c), N (larvae) = 45, 47, 27, 27. d Schematic of heat induced roll behavior difference in control and Is ablated larvae. Cartoon is generated with Biorender. e Quantification of the number of rolls of control and Is ablated larvae. t(16.59) = 3.647, p = 0.0021, unpaired t test, two-tailed, with Welch’s correction. N (larvae) = 12, 12. Error bars indicate ± SEM, *p < 0.05, **p < 0.01, ****p < 0.0001.

Update of

References

    1. Citri A, Malenka RC. Synaptic plasticity: Multiple forms, functions, and mechanisms. Neuropsychopharmacol. 2008;33:18–41. doi: 10.1038/sj.npp.1301559. - DOI - PubMed
    1. Bliss TVP, Lømo T. Long‐lasting potentiation of synaptic transmission in the dentate area of the anaesthetized rabbit following stimulation of the perforant path. J Physiol. 1973;232:331–356. doi: 10.1113/jphysiol.1973.sp010273. - DOI - PMC - PubMed
    1. Mulkey RM, Malenka RC. Mechanisms underlying induction of homosynaptic long-term depression in area CA1 of the hippocampus. Neuron. 1992;9:967–975. doi: 10.1016/0896-6273(92)90248-C. - DOI - PubMed
    1. Hebb D. O. The organization of behavior; a neuropsychological theory. (Wiley, 1949).
    1. Murthy VN, Schikorski T, Stevens CF, Zhu Y. Inactivity produces increases in neurotransmitter release and synapse size. Neuron. 2001;32:673–682. doi: 10.1016/S0896-6273(01)00500-1. - DOI - PubMed

Publication types

LinkOut - more resources