. 2023 Jul 24;13(1):11912.
doi: 10.1038/s41598-023-39226-y.

Myocardial strain-curve deformation patterns after Fontan operation

Affiliations

Myocardial strain-curve deformation patterns after Fontan operation

Michal Schäfer et al. Sci Rep. .

Abstract

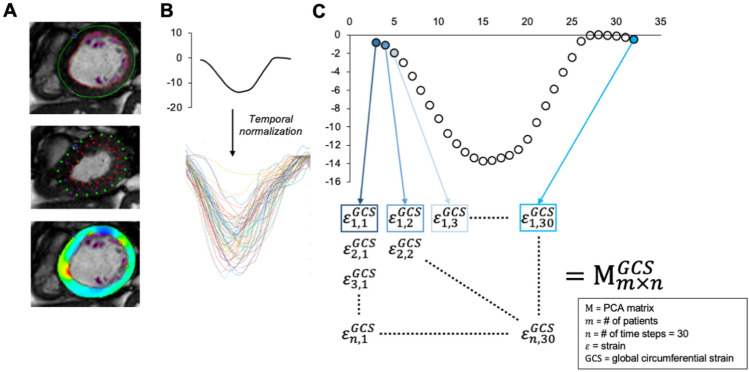
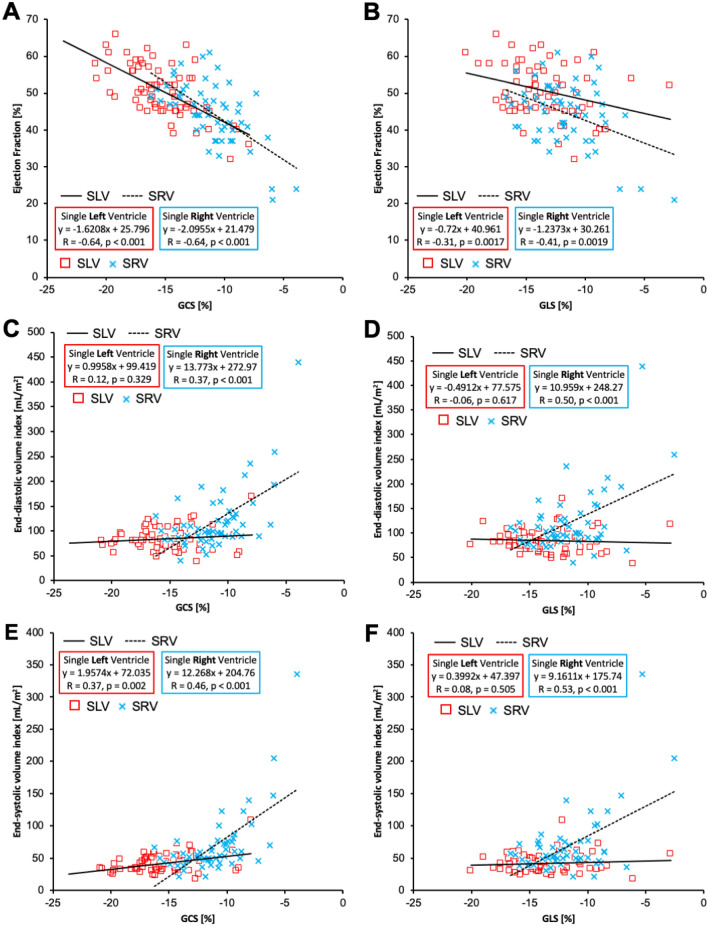
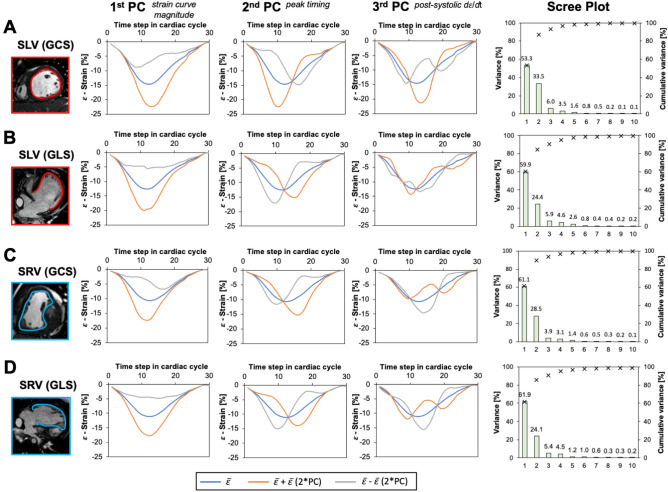
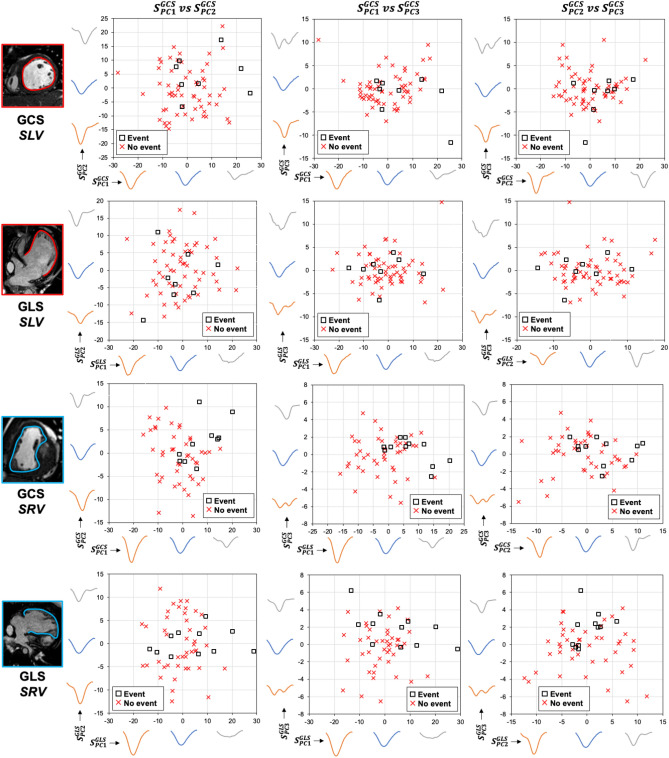
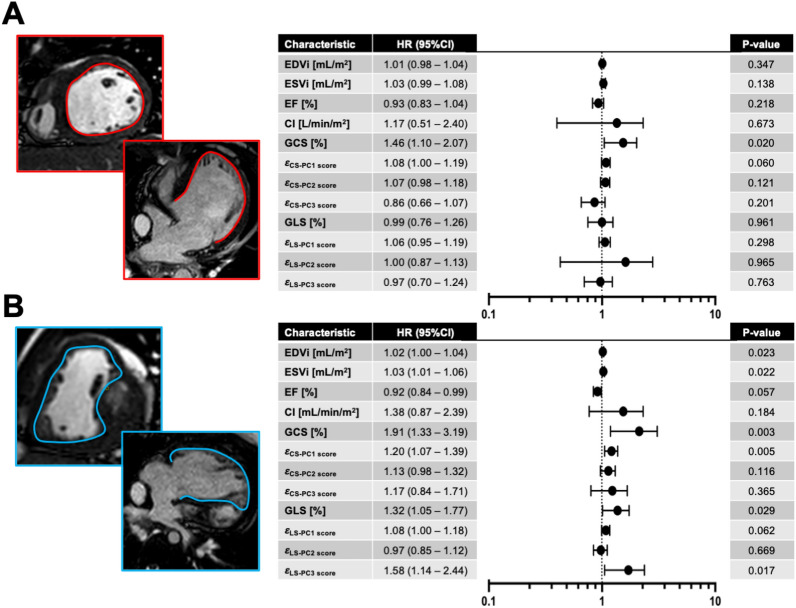
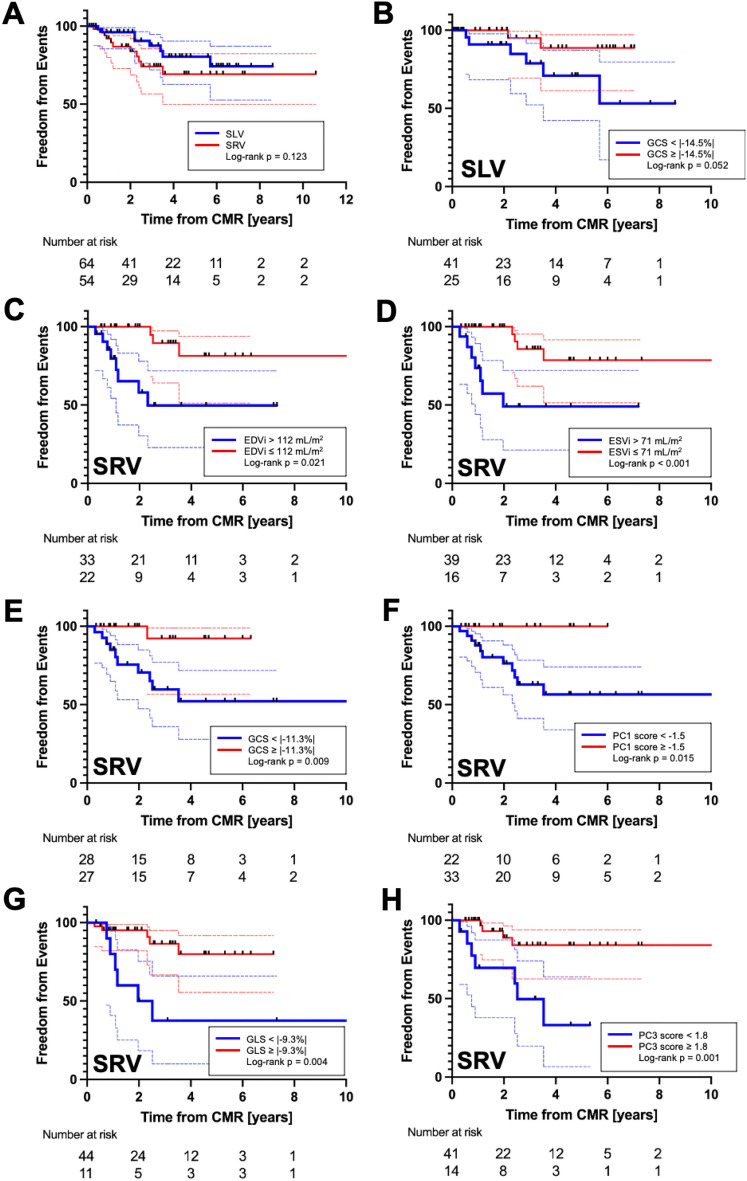
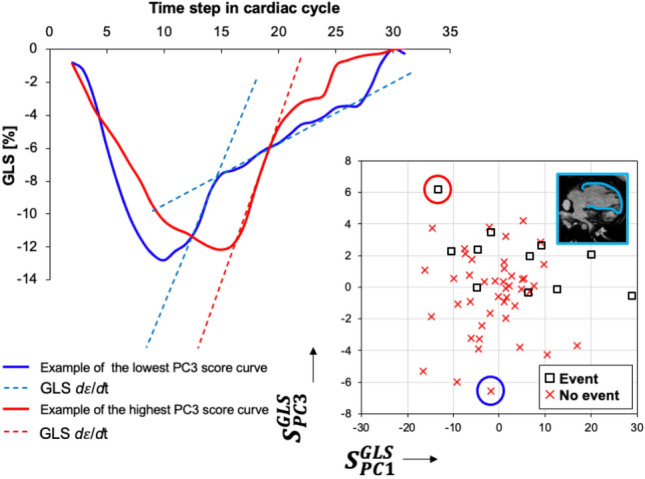
Myocardial deformation analysis by cardiac MRI (CMR) yielding global circumferential and longitudinal strain (GCS and GLS) is an increasingly utilized method to accurately quantify systolic function and predict clinical events in patients with Fontan circulation. The purpose of this study was to use principal component analysis (PCA) to investigate myocardial temporal deformation patterns derived from strain-time curves to learn about latent strain features beyond peak values. We conducted the study with specific attention to dominant single left or right ventricle (SLV and SRV) morphologies. Methods and Results: Patients remote from Fontan operation who underwent follow-up CMR were analyzed for standard volumetric and function hemodynamics including myocardial deformation parameters including GCS and GLS. We applied PCA to investigate in an unbiased fashion the strain-time curve morphology and to calculate patient specific shape scores. All variables were subjected to single variable Cox regression analysis to detect composite clinical outcome including death, heart transplant, protein losing enteropathy and plastic bronchitis. A total of 122 patients, (SLV = 67, SRV = 55) with a mean age of 12.7 years underwent comprehensive CMR analysis. The PCA revealed 3 primary modes of strain-curve variation regardless of single ventricle morphology and type of strain investigated. Principle components (PCs) described changes in (1) strain-time curve amplitude, (2) time-to-peak strain, and (3) post-systolic slope of the strain-time curve. Considering only SLV patients, GCS was only CMR variable predictive of clinical events (HR 1.46, p = 0.020). In the SRV group, significant CMR predictors of clinical events were derived indexed end-diastolic (HR 1.02, p = 0.023) and end-systolic (HR 1.03, p = 0.022) volumes, GCS (HR 1.91, p = 0.003) and its related first component score (HR 1.20, p = 0.005), GLS (HR 1.32, p = 0.029) and its third component score (HR 1.58, p = 0.017). CMR derived global strain measures are sensitive markers of clinical outcomes in patients with Fontan circulation, particularly in patients with the SRV morphology. Myocardial strain-time curve morphology specific to SLV and SRV patients inspired by unbiased PCA technique can further aid with predicting clinical outcomes.


Conflict of interest statement

The authors declare no competing interests.

Figures

Figure 1
Figure 1
Strain–time curve pre-processing and input into the principal component analysis (PCA). (A) After endocardial contouring and generation strain–time curves, (B) all signals were temporally adjusted for heart rate and sampling rate. (C) Time specific strain values were the iteratively incorporate into the PCA matrix M specific to type of global strain and single ventricle type.
Figure 2
Figure 2
Relationship between peak strain indices and standard CMR measures of ventricular size and function. (A) GCS correlated with ejection fraction in similar manner for both SLV and SRV groups with higher dEF/dGCS or steeper slope for SRV group. (B) GLS was associated with EF for both SLV and SRV groups but to a lesser degree than GCS, again with higher dEF/dGCS in SRV patients. (C) GCS was not associated with EDVi in SLV group but lower GCS values were associated with higher EDVi in SRV group. (D) Similarly, GLS was not associated with EDVi in SLV group, but reduced GLS was associated with higher EDVi in SRV patients. (E) GCS was associated with ESVi in both SLV and SRV groups with higher dESVi/dGCS in SRV group. (F) GLS did not reveal any relationship with ESVi in SLV group but showed a significant relationship in SRV group.
Figure 3
Figure 3
Graphical summary of the strain–time principal component analysis. Principal components derived for the SLV patients specific or global circumferential strain (A) and global longitudinal strain (B) revealed similar modes of deformation with similar proportion of individual components accounting for the cumulative variance. Similar observation was noted in the SRV group for GCC (C) and GLS (D) strain–time curves. SLV single left ventricle, SRV single right ventricle, GCS global circumferential strain, GLS global longitudinal strain, PC principal component, ε¯ = mean strain–time curve.
Figure 4
Figure 4
The combination of the first three PCs strain scores plotted against each other for specific and single ventricle morphology and type of strain. X- and Y- axes further display how are calculated strain–time curve scores reflective of shape deformation. SLV single left ventricle, SRV single right ventricle, GCS global circumferential strain, GLS global longitudinal strain, PC principal component, S = principal component specific score individual to each patient.
Figure 5
Figure 5
Forest plot summarizing single variable Cox proportional hazard analysis for standard CMR and myocardial strain markers. (A) Single left ventricle specific plot highlighting GCS as the only predictor of composite clinical events. (B) Single right ventricle plot depicting EDVi, ESVi. GCS, εCS-PC1, GLS, and εLS-PC3 as markers associated with clinical events. GCS global longitudinal strain, GLS global longitudinal strain, EDVi end-diastolic volume index, ESVi end-systolic volume index, EF ejection fraction, ε = strain (LS/CS longitudinal or circumferential strain), PC principal component, HR hazard ratio.
Figure 6
Figure 6
Kaplan–Meier plots for SLV versus SRV comparison (A) and variables found to be predictive of clinical events on single variable Cox proportional hazard analysis. (B) GCS measured in the SLV group with cutoff value 14.5% approached statistical significance. In the SRV group, (C) EDVi > 112 mL/m2 and (D) ESVi > 71 mL/m2 had worse freedom from clinical events. (E) GCS in the SRV patients with value worse than − 11.3% and its related first PC score < − 1.5 (F) had overall worse freedom from events. GLS measured in SRV patients worse than − 9.3% (G) and its related third PC score < 1.8 (H) were also associated with cumulatively worse outcomes.
Figure 7
Figure 7
Graphical demonstration of the third principal component describing the post-systolic dε/dt pattern derived from GLS curves in patients with SRV morphology. Strain–time curves of the two most representative patients with the most extreme opposite score values are depicted. Blue strain–time curve depicts a patient without clinical event demonstrating two distinct post-systolic relaxation slopes in early and late diastole, respectively (blue-dashed lines). This is analogous to a double peak diastolic strain rate pattern conventionally described as early and late diastolic strain rates. On the opposite end of the spectrum is a patient with a clinical event and corresponding strain–time curve (red) with primarily a single dε/dt slope throughout the majority of diastole (single dashed red line). This would translate to a single peak diastolic strain rate.

References

    1. Meyer SL, St. Clair N, Powell AJ, Geva T, Rathod RH. Integrated clinical and magnetic resonance imaging assessments late after Fontan operation. J. Am. Coll. Cardiol. 2021;77:2480–2489. doi: 10.1016/j.jacc.2021.03.312. - DOI - PubMed
    1. Meyer SL, et al. Serial cardiovascular magnetic resonance feature tracking indicates early worsening of cardiac function in Fontan patients. Int. J. Cardiol. 2020;303:23–29. doi: 10.1016/j.ijcard.2019.12.041. - DOI - PubMed
    1. Dardeer AM, Hudsmith L, Wesolowski R, Clift P, Steeds RP. The potential role of feature tracking in adult congenital heart disease: Advantages and disadvantages in measuring myocardial deformation by cardiovascular magnetic resonance. J. Congenit. Cardiol. 2018;21(2):1–11.
    1. Kato A, et al. Pediatric Fontan patients are at risk for myocardial fibrotic remodeling and dysfunction. Int. J. Cardiol. 2017;240:172–177. doi: 10.1016/j.ijcard.2017.04.073. - DOI - PubMed
    1. Rösner A, et al. Classic-pattern dyssynchrony in adolescents and adults with a Fontan circulation. J. Am. Soc. Echocardiogr. 2018;31:211–219. doi: 10.1016/j.echo.2017.10.018. - DOI - PubMed

Publication types