. 2023 Jul 24;13(1):11950.
doi: 10.1038/s41598-023-37300-z.

m5C regulator-mediated methylation modification phenotypes characterized by distinct tumor microenvironment immune heterogenicity in colorectal cancer

Affiliations

m5C regulator-mediated methylation modification phenotypes characterized by distinct tumor microenvironment immune heterogenicity in colorectal cancer

Zhihua Chen et al. Sci Rep. .

Abstract

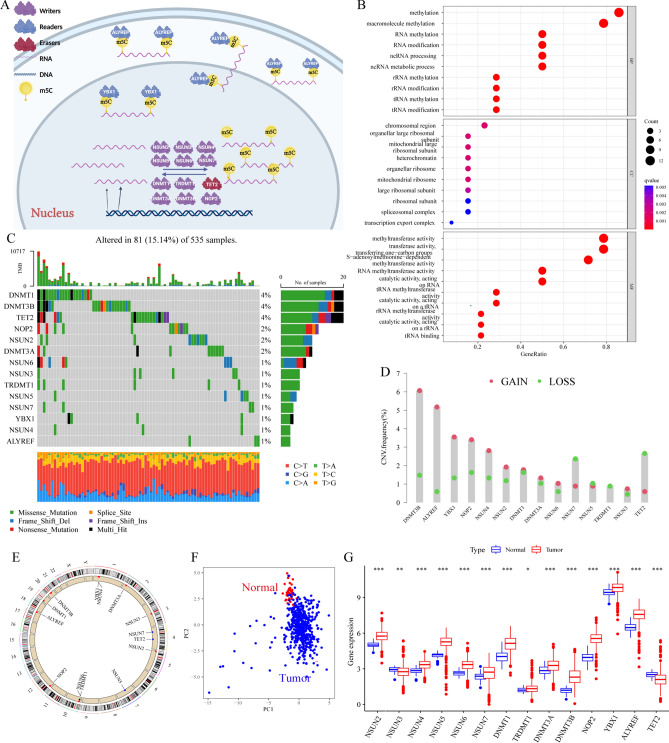
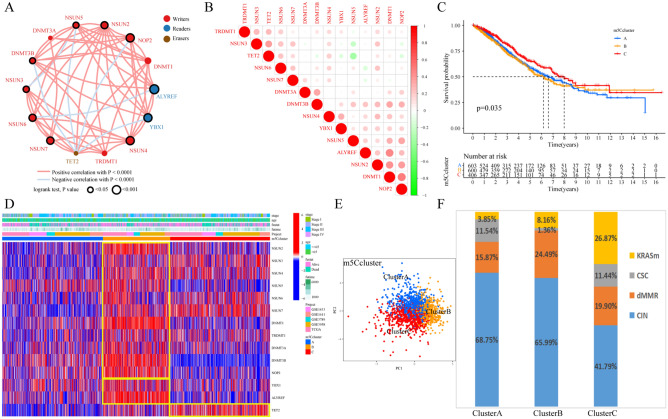
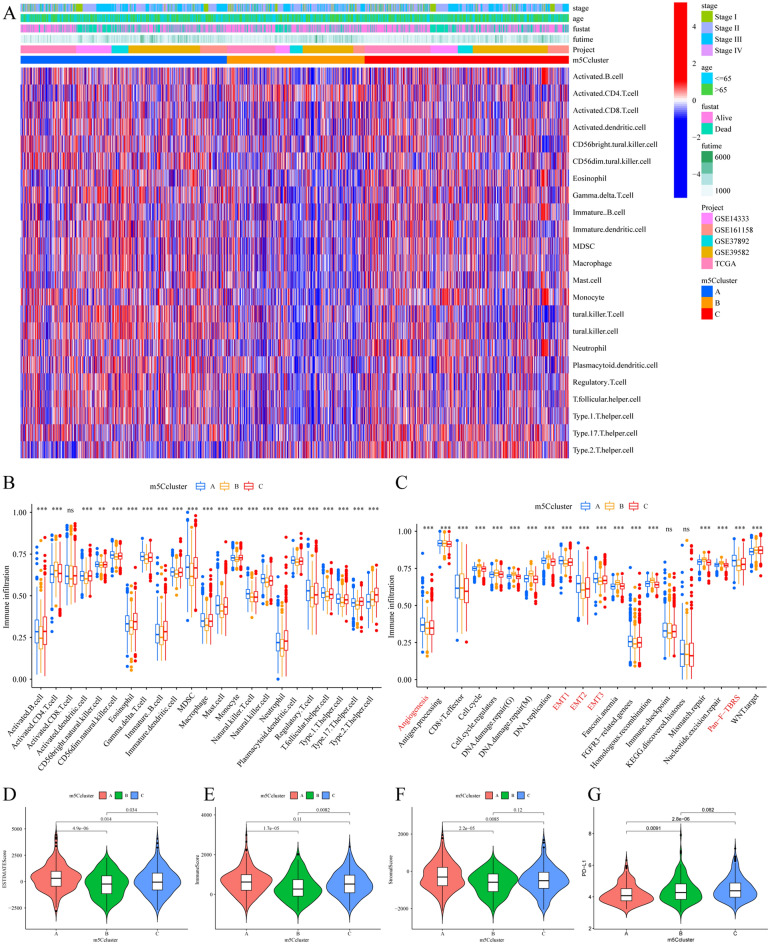
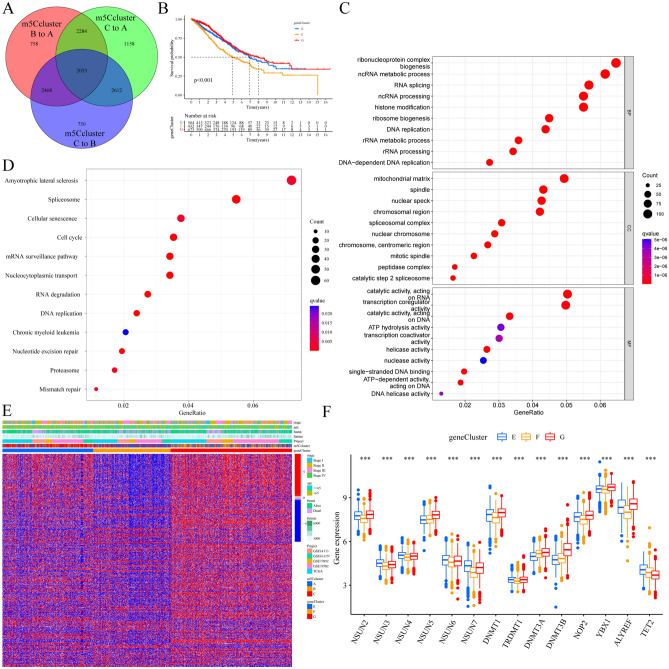
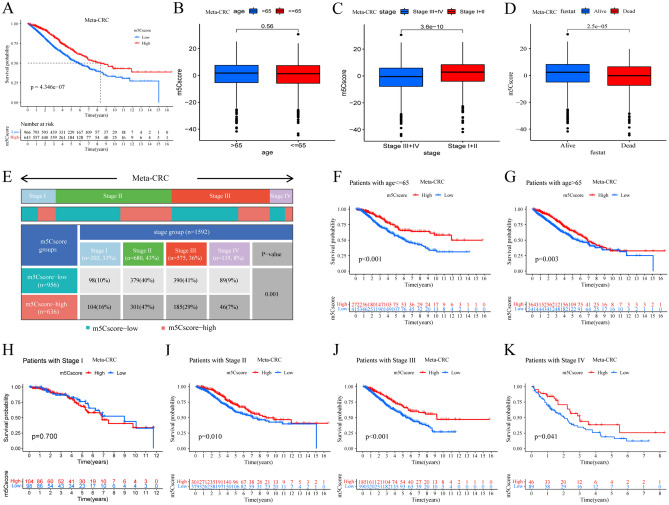
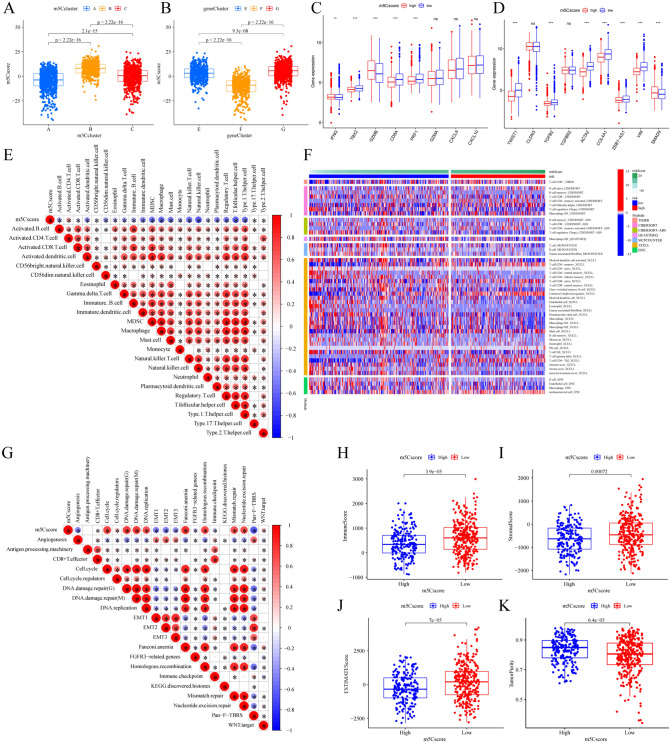
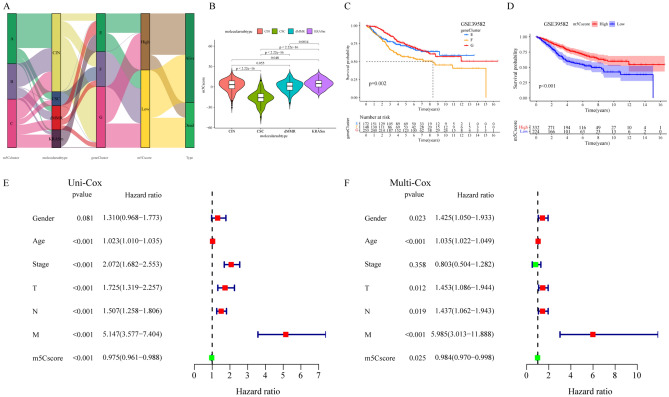
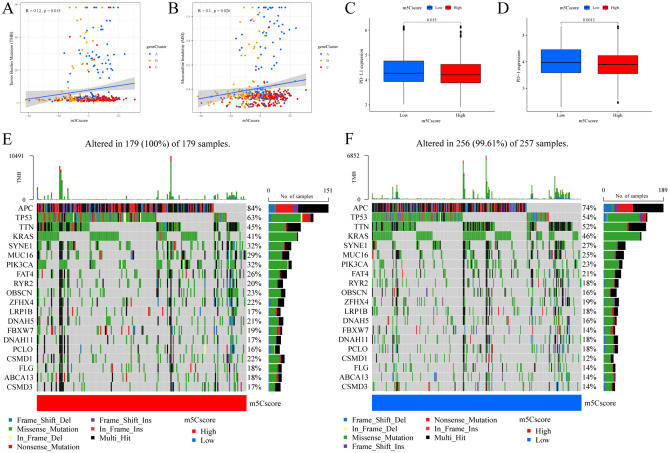
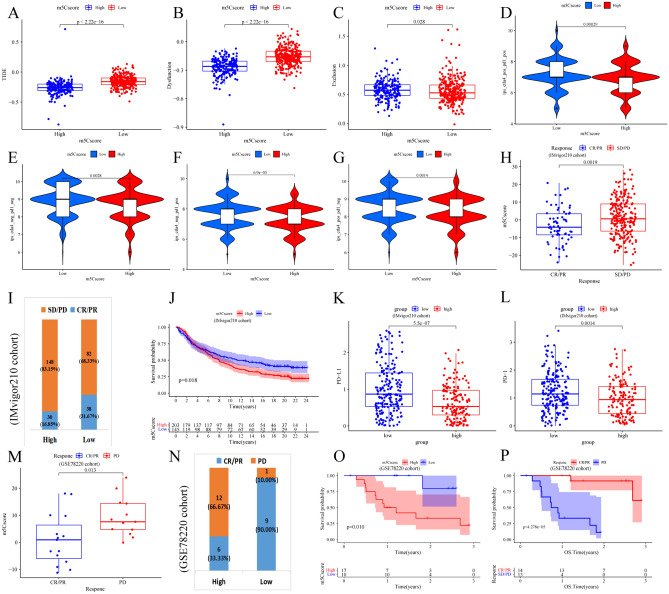
The RNA 5-methylcytosine (m5C) modification has been demonstrated to be an important epigenetic regulator and to impact colorectal cancer (CRC) progression. However, the potential roles of m5C modification in immune cell infiltration in the CRC tumor microenvironment (TME) remain unknown. The m5C modification phenotypes were comprehensively evaluated based on 14 m5C regulators in a meta-CRC cohort of 1792 patients and systematically correlated with the m5C modification phenotypes, immune cell infiltration characteristics and known biological processes. The m5Cscore model was constructed by principal component analysis (PCA) algorithms to quantify the m5C modification phenotypes of individual CRC samples and was used to predict the immunotherapy response. We identified three m5C modification phenotypes associated with distinct clinical outcomes and biological processes among the 1792 meta-CRC patients. Three phenotypes with a highly consistent TME landscape and characteristics were revealed: immune excluded, immune desert and immune inflammation. The meta-CRC patients were divided into high and low m5Cscore subgroups based on the m5Cscore. The m5Cscore was confirmed to have a negative correlation with infiltrating immune cells and PD-L1 expression and a positive correlation with tumor mutation burden (TMB), mutation rate and microsatellite instability (MSI) score. Moreover, patients in the low m5Cscore group had better immunotherapy responses and significant durable survival benefits in independent anti-PD-1/L1 immunotherapy cohorts for the immune checkpoint inhibitor (ICI) therapeutic strategy. This study revealed that m5C modification plays a crucial role in TME composition and complexity. Comprehensive evaluation of the m5C modification phenotypes of individual patients will enhance our understanding of TME characteristics and promote the application of more appropriate and personalized treatment strategies.


Conflict of interest statement

The authors declare no competing interests.

Figures

Figure 1
Figure 1
The landscape of the genetic alterations and expression of the 14 m5C regulators in CRC. (A) Summary of the regulation of m5C modification and its potential biological functions in RNA metabolism by m5C regulators (writer, reader and eraser proteins). (B) GO biological process enrichment analysis results of 14 m5C regulators. (C) A 15.14% mutation frequency of 14 m5C regulators was observed in 535 patients with CRC from the TCGA-CRC cohort. The individual patients are represented in each column. The upper bar plot is TMB. The mutation frequency for each regulator is shown on the right. The proportion of each variant type is shown on the right bar plot. The fraction of conversions in each patient is shown on the stacked bar plot below. (D) The CNV mutation variation of 14 m5C regulators is presented in the TCGA-CRC cohort. The column is the CNV alteration frequency. The green dot is the deletion frequency; the pink dot is the amplification frequency. (E) The location of CNV alterations in m5C regulators on 23 chromosomes in the TCGA-CRC cohort. (F) PCA of the expression of m5C regulators was used to distinguish tumor samples from normal samples for the TCGA-CRC cohort. Tumor: blue dot; normal: red dot. (G) The differential expression of 14 m5C regulators between normal and tumor tissues of the 1609 meta-CRC patients. Normal: blue dot; tumor: red dot. (*P < 0.05; **P < 0.01; ***P < 0.001).
Figure 2
Figure 2
The distinct patterns of m5C methylation modification and relevant biological characteristics. (A) The interaction of 14 m5C regulator expression in CRC. The circle size represents the effect of the m5C regulator on CRC prognosis calculated by the KM truncation value method (respective from P < 0.001 and P < 0.05). Risk prognostic factors: purple dots in the circle; protective prognostic factors: green dots in the circle. The interactions of regulators are shown as linking lines, and the thickness shows the correlation strength of the regulators. Positive correlations are marked with red, and negative correlations are marked with blue. The red brown and yellow are erasers, readers and writers, respectively. (B) The correlations between these m5C regulators were calculated in CRC using Spearman correlation analysis. The negative correlation is marked with green, and the positive correlation is marked with red. (C) The OS for different m5C clusters of 1609 CRC patients in the meta-CRC cohort with the K-M method (log-rank test). The numbers of patients with the m5C cluster A, m5C cluster B and m5C cluster C phenotypes were 603, 409 and 600, respectively. (D) Unsupervised clustering of 14 m5C regulators in the five independent CRC cohorts. The clinical characteristics and CRC cohort were distributed in distinct m5C clusters. Each column represents a patient, and each row represents an m5C regulator. (E) PCA for the three m5C regulator modification patterns. The three m5C clusters of the meta-CRC cohort were well distinguished based on the transcriptome of m5C regulators. (F) The distribution of molecular subtypes of CRC in the three m5C modification patterns in the GSE39582 cohort.
Figure 3
Figure 3
The distinct TME characteristics between the three m5C modification phenotypes. (A) Heatmap of the different immune cells that infiltrated the TME between the phenotypes. The clinical characteristics and CRC cohort were distributed in distinct m5C clusters. Each column represents patients, and each row represents individual immune cells. (B) The different immune cells infiltrated in the TME of the three m5C clusters calculated by the CIBERSORT algorithm. The Kruskal–Wallis H test was used to statistically analyze the difference between distinct m5C clusters. (C) The difference in the enrichment score of each known biological process gene signature between the three m5C clusters. (D) The immune score, (E) stromal score, and (F) ESTIMATE score of the three gene clusters were analyzed and plotted. (G) The checkpoint gene PD-L1 expression in the distinct m5C clusters.
Figure 4
Figure 4
Construction of an m5C modification phenotype-related differentially expressed gene (DEG) signature and functional annotation in the meta-CRC cohort. (A) A total of 2053 DEGs between the three m5C clusters were identified and are shown in the Venn diagram. (B) The survival curves of the distinct m5C gene signature groups were analyzed by the K-M method (log-rank test). The numbers of patients with the gene cluster E, gene cluster F and gene cluster G phenotypes were 504, 432 and 673, respectively. (C) GO enrichment analysis and (D) KEGG enrichment analysis were performed; functional annotation for m5C modification phenotype-related DEGs is shown (www.kegg.jp/kegg/kegg1.html). The size of the circles represents the enrichment of the genes, and the color depth represents the q-value. (E) Unsupervised clustering of the m5C-related genes into clusters in the five independent CRC cohorts was performed. The clinical characteristics of CRC cohort patients in distinct gene clusters are shown. Each column represents a patient, and each row represent a DEG. (F) Differential expression of 14 m5C regulators between distinct gene cluster groups (*P < 0.05; **P < 0.01; ***P < 0.001).
Figure 5
Figure 5
The value of the m5Cscore and clinical function in the meta-CRC cohort. (A) Survival time and survival status comparisons between the high- and low-m5Cscore groups (K-M method, P < 0.001, log-rank test). (B) The difference in the m5Cscore in the distinct CRC age groups (≤ 65 vs. > 65). (C) The difference in the m5Cscore in the distinct CRC stage groups (I + II vs. III + IV). (D) The difference in the m5Cscore in the distinct CRC outcome groups (alive vs. dead). (E) The distribution diagram of the m5Cscore in the distinct CRC stage groups. (F) The OS between the high- and low-m5Cscore groups in the age ≤ 65 group (687 samples) and (G) the age > 65 group (905 samples). (HK) The OS between the high- and low-m5Cscore groups in I (202 samples), II (680 samples), III (575 samples) and IV (135 samples).
Figure 6
Figure 6
The TME landscapes and biological processes in the distinct m5Cscore groups. (A) The difference in the m5Cscore in the distinct m5C clusters using the Kruskal–Wallis test. (B) The difference in the m5Cscore in the distinct gene clusters. (C) The differential expression of each gene included in the immune activation-related gene signature between the m5Cscore high and low groups. (D) The differential expression of each gene included in the growth factor TGF-β/EMT pathway gene signature between the high and low m5Cscore groups. (E) The correlation between the m5Cscore and each TME-infiltrating cell type using Spearman analyses. The positive correlation is marked with red, and the negative correlation is marked with blue. The size of the circles represents the correlation coefficient (*P < 0.05). (F) Heatmap of the different immune cells that infiltrated the TME between the high and low m5Cscore groups. The clinical characteristics and CRC cohort distribution in the distinct m5Cscore groups. Each column represents patients, and each row represents individual immune cells. (G) Correlations between the m5Cscore and the known biological gene signatures using Spearman analyses. The positive correlation is marked with red, and the negative correlation is marked with blue. The size of the circles represents the correlation coefficient (*P < 0.05). (H) The different immune scores and three m5C clusters were compared and plotted. (I) Stromal score, (J) ESTIMATE score and (K) tumor purity between the high and low m5Cscore groups.
Figure 7
Figure 7
Characteristics of the m5C modification phenotype and m5Cscore and clinical value in the GSE39582 cohort. (A) Sankey diagram of the m5C clusters distributed to different molecular subtypes (dMMR, CSC, KRASm and CIN), m5C gene cluster, and m5Cscore. (B) The difference in the m5Cscore in the distinct molecular subtype groups (dMMR, CSC, KRASm and CIN). (C) The OS between the distinct m5C-related gene cluster groups. (D) The OS between the distinct high- and low-m5Cscore groups. (E) Univariate Cox regression analyses and (F) multivariate Cox regression analyses to estimate the ability of multiple clinical factors and the m5Cscore to predict OS. The length of the horizontal line represents the 95% confidence interval for each group. The vertical dotted line represents the HR of all patients. The vertical solid line represents HR = 1. The red square and hazard ratio > 1 represent risk factors for survival, and the green square and hazard ratio < 1 represent protective factors for survival.
Figure 8
Figure 8
The role of the m5Cscore in predicting immunotherapeutic benefits. (A) The relationship between the m5Cscore and TMB. (B) The relationship between the m5Cscore and MSI. (C) PD-L1 expression and (D) PD-1 expression between the distinct high and low m5Cscore groups in the meta-CRC cohort. (E,F) Tumor somatic mutations were assessed in individuals in the high and low m5Cscore groups (shown in the left and right waterfall plots, respectively). The individual patients are represented in each column. The upper bar plot is TMB. The mutation frequency in each regulator is shown on the right. The proportion of each variant type is shown on the right bar plot. The fraction of conversions in each patient is shown in the stacked bar plot below.
Figure 9
Figure 9
The predictive effect of the m5Cscore the ICI therapy response. (AC) The difference in the TIDE scores between the high and low m5Cscore groups. (DG) The difference in IPS between the high and low m5Cscore groups. (HL) The prediction effect of anti-PD-L1 immunotherapy of m5Cscore in the IMvigor210 cohort. (H) The distribution of the m5Cscore between the patients with clinical response to anti-PD-L1 immunotherapy (CR, complete response; PR, partial response; SD, stable disease; PD, progressive disease). (I) The fraction of patients who responded to anti-PD-L1 immunotherapy in the high and low m5Cscore groups. (J) The survival analyses for low and high m5Cscore groups (K-M method, log-rank test). (K) PD-L1 expression and (D) PD-1 expression between the distinct high and low m5Cscore groups. (MP) The prediction effect of the anti-PD-1 immunotherapy of m5Cscore in GSE78220 cohort. (M) The distribution of the m5Cscore between the patients with different clinical responses to anti-PD-1 immunotherapy. (N) The fraction of patients who responded to anti-PD-1 immunotherapy in the high and low m5Cscore groups. (O) The survival analyses for low and high m5Cscore groups (K-M method, log-rank test). (P) The survival analyses for the patients with distinct clinical response to anti-PD-1 immunotherapy groups (K-M method, log-rank test).

Similar articles

Cited by

References

    1. Pietro B, Filip S, Angana R, et al. MODOMICS: A database of RNA modification pathways. Nucleic Acids Res. 2021;2022(50):231–235. doi: 10.1093/nar/gkab1083. - DOI
    1. Phensinee H, Ying ZY, Yubin Z, et al. RNA modifications and cancer. RNA Biol. 2020;17:1560–1575. doi: 10.1080/15476286.2020.1722449. - DOI - PMC - PubMed
    1. Rong H, Changfeng M, Jiabin H, et al. Identification of RNA methylation-related lncRNAs signature for predicting hot and cold tumors and prognosis in colon cancer. Front Genet. 2020;13:870945. - PMC - PubMed
    1. Gangqiang G, Kan P, Fang Su, et al. Advances in mRNA 5-methylcytosine modifications: Detection, effectors, biological functions, and clinical relevance. Mol. Ther. Nucleic Acids. 2021;26:575–593. doi: 10.1016/j.omtn.2021.08.020. - DOI - PMC - PubMed
    1. Tuorto F, Liebers R, Musch T, et al. RNA cytosine methylation by Dnmt2 and NSun2 promotes tRNA stability and protein synthesis. Nat. Struct. Mol. Biol. 2012;19:900–905. doi: 10.1038/nsmb.2357. - DOI - PubMed

Publication types