. 2023 Jul 24;13(1):11939.
doi: 10.1038/s41598-023-39151-0.

Quantitative assessment of inner ear variation in elasmobranchs

Affiliations

Quantitative assessment of inner ear variation in elasmobranchs

Derek J Sauer et al. Sci Rep. .

Abstract

Considerable diversity has been documented in most sensory systems of elasmobranchs (sharks, rays, and skates); however, relatively little is known about morphological variation in the auditory system of these fishes. Using magnetic resonance imaging (MRI), the inner ear structures of 26 elasmobranchs were assessed in situ. The inner ear end organs (saccule, lagena, utricle, and macula neglecta), semi-circular canals (horizontal, anterior, and posterior), and endolymphatic duct were compared using phylogenetically-informed, multivariate analyses. Inner ear variation can be characterised by three primary axes that are influenced by diet and habitat, where piscivorous elasmobranchs have larger inner ears compared to non-piscivorous species, and reef-associated species have larger inner ears than oceanic species. Importantly, this variation may reflect differences in auditory specialisation that could be tied to the functional requirements and environmental soundscapes of different species.


Conflict of interest statement

The authors declare no competing interests.

Figures

Figure 1
Figure 1
Interspecific scaling relationships of body size and inner ear measurements. Scaling relationships (logarithmic axes) from pGLS models between (a) body mass and surface area of the saccule, lagena, and utricle (and their combined total surface area) across 26 elasmobranch species. Total surface area = 0.45x + 0.16. Saccule = 0.45x – 0.01. Lagena = 0.49x – 0.93. Utricle = 0.42x – 0.52; (b) body mass and mean diameter of the semi-circular canals and ampullae from 26 elasmobranch species. Mean ampulla diameter = 0.15x – 0.16. Mean semi-circular canal diameter = 0.11x – 0.57; (c) and body mass and volume of different inner ear structures in 10 species. Saccule = 0.91x – 1.50. Lagena = 0.79x – 1.95. Utricle = 0.74x – 1.69. Macula neglecta = 0.77x – 2.57. Endolymphatic duct = 0.56x – 1.38. Horizontal canals = 0.70x – 0.39. Soft labyrinth = 0.76x – 0.37. Skeletal labyrinth = 0.93x – 0.20. For full regression outputs, see Tables S1 and S2.
Figure 2
Figure 2
Utricle size in elasmobranchs. Relative utricle size (residuals from pGLS models against body mass) for each species, grouped by diet (coloured) and habitat (segmented). For species abbreviations, see Table 3.
Figure 3
Figure 3
Ear size in elasmobranchs. Relative ear size (residuals from pGLS models against body mass) for each species, grouped by diet (coloured) and habitat (segmented). For species abbreviations, see Table 3.
Figure 4
Figure 4
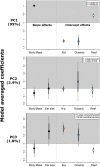
Model-averaged coefficients for main principal components. The slope effects from body size and total ear size, as well as the intercept effects from diet and primary habitat (n = 26 species). Intercept effects are relative to a reference level of coastal, piscivorous species. Note that total ear size was not included as a predictor for PC1, as this principal component characterises variation in total ear size. N-p = non-piscivorous.
Figure 5
Figure 5
Three-dimensional visualisations.The inner ear from a (a) school shark (Galeorhinus galeus), (b) shortfin mako (Isurus oxyrinchus), (c) smooth hammerhead (Sphyrna zygaena), and (d) blue shark (Prionace glauca), illustrating the variation in different inner ear structures. AVC = anterior vertical canal, HC = horizontal canal, PVC = posterior vertical canal, MN = macula neglecta, ED = endolymphatic duct. All visualisations share the same orientation (D = dorsal, C = caudal).
Figure 6
Figure 6
Linear measurement. An individual axial scan slice from the inner ear of a school shark (Galeorhinus galeus) showing (a) the original MR image, (b) the segmentation of inner ear structures, and (c) the linear measurement of the same inner ear structures. Dark blue = utricle; Light blue = saccule, Grey = semi-circular canals. Scale bar = 5 mm.
Figure 7
Figure 7
Phylogenetic tree used in this study. The 26 species of elasmobranchs examined in this study, created by pruning a larger (610 species) molecular tree (Stein et al.) to the desired taxa set.

Similar articles

Cited by

References

    1. Retzius G. Das gehörorgan der fische und amphibien. Samson and Wallin; 1881.
    1. Ladich F, Schulz-Mirbach T. Diversity in fish auditory systems: One of the riddles of sensory biology. Front. Ecol. Evol. 2016;4:1–26. doi: 10.3389/fevo.2016.00028. - DOI
    1. Schulz-Mirbach T, Ladich F. Diversity of inner ears in fishes: Possible contribution towards hearing improvements and evolutionary considerations. In: Sisneros JA, editor. Fish Hearing and Bioacoustics. Advances in Experimental Medicine and Biology. Springer; 2016. pp. 341–391. - PubMed
    1. Popper AN, Coombs S. The morphology and evolution of the ear in actinopterygian fishes. Am. Zool. 1982;22:311–328. doi: 10.1093/icb/22.2.311. - DOI
    1. Platt C, Popper AN. Fine structure and function of the ear. In: Tavolga WN, Popper AN, Fay RR, editors. Hearing and Sound Communication in Fishes, Proceedings in Life Sciences. Springer; 1981. pp. 3–38.

Publication types