Clinical Trial
. 2023 Aug;29(8):2068-2078.
doi: 10.1038/s41591-023-02469-3. Epub 2023 Jul 24.

Neoadjuvant adebrelimab in locally advanced resectable esophageal squamous cell carcinoma: a phase 1b trial

Affiliations
Clinical Trial

Neoadjuvant adebrelimab in locally advanced resectable esophageal squamous cell carcinoma: a phase 1b trial

Jun Yin et al. Nat Med. 2023 Aug.

Erratum in

Abstract

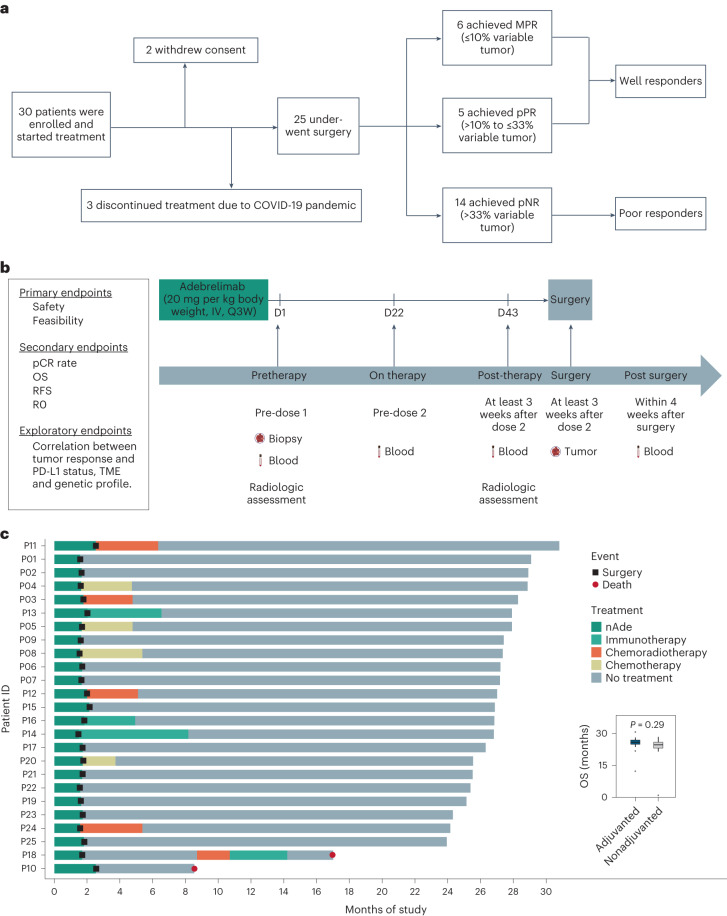
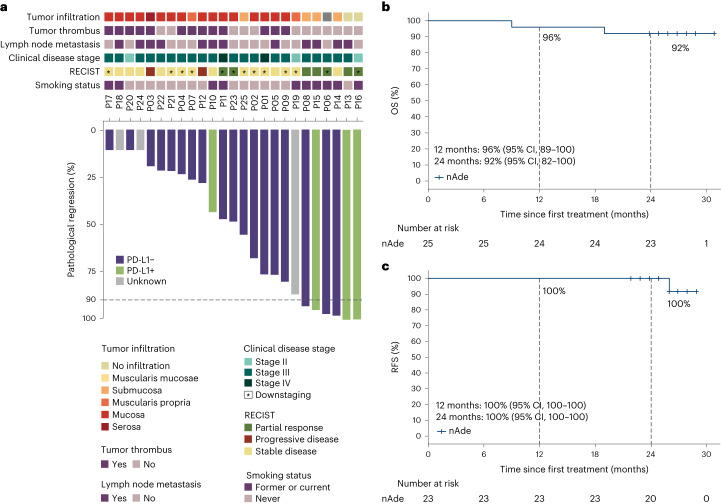
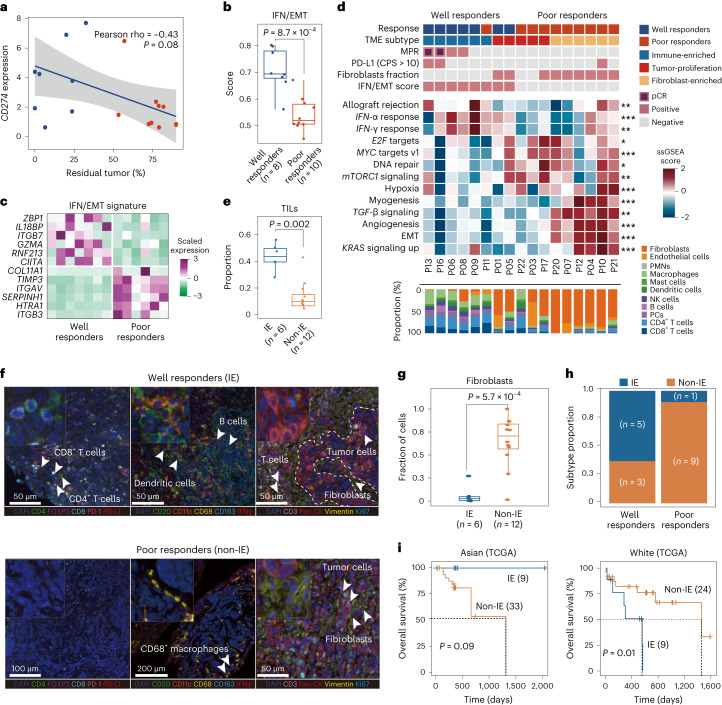
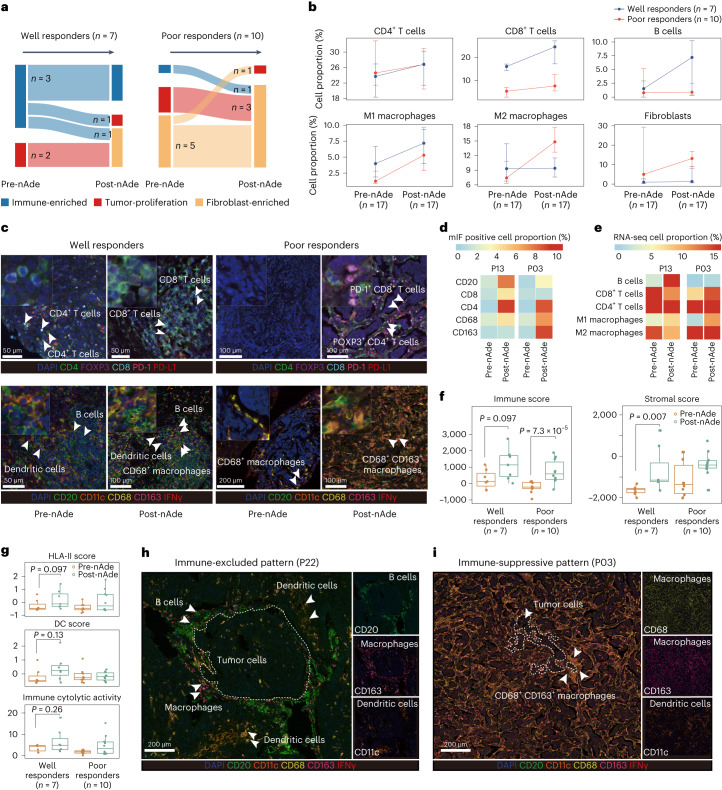
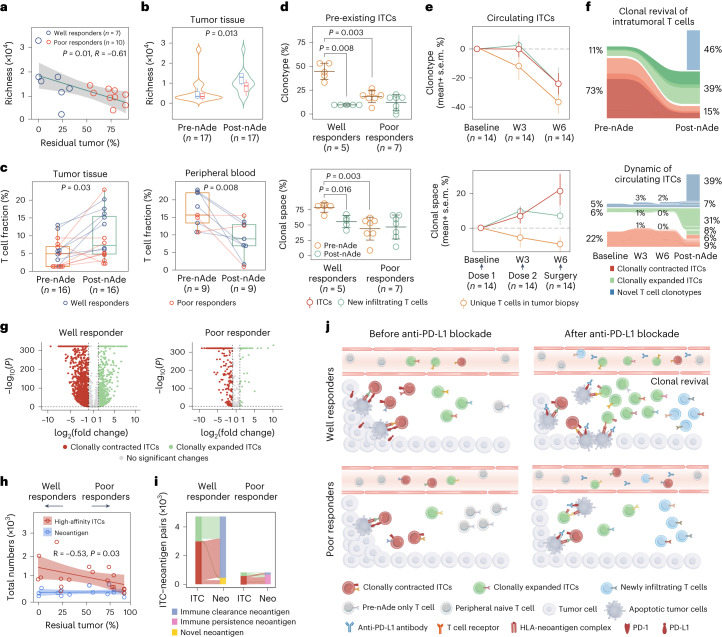
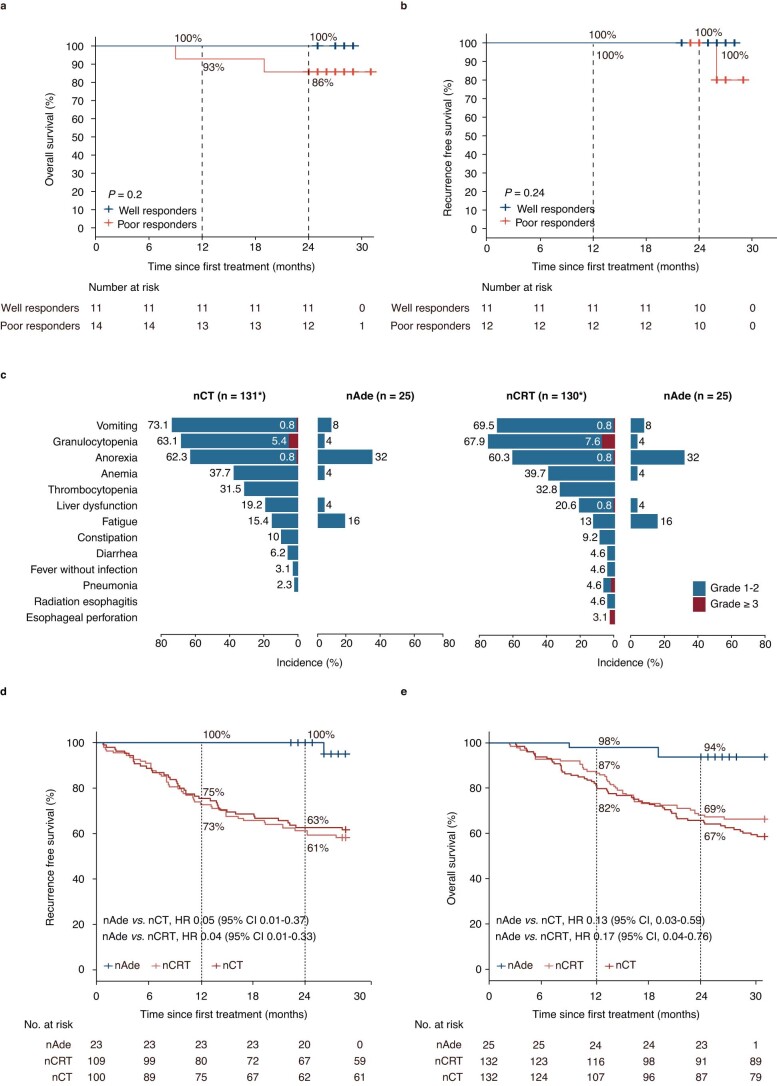
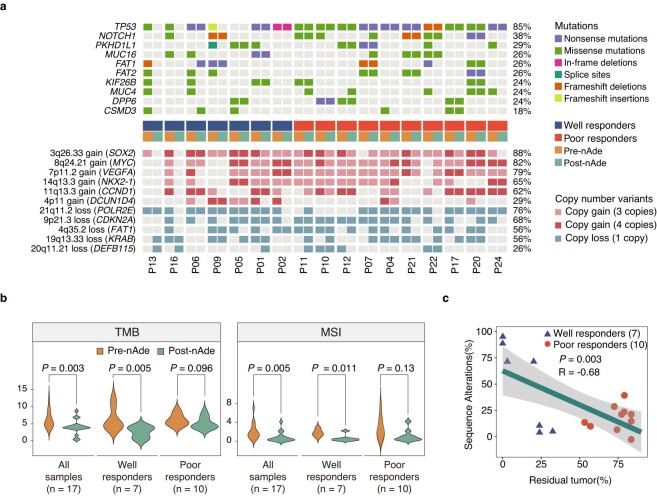
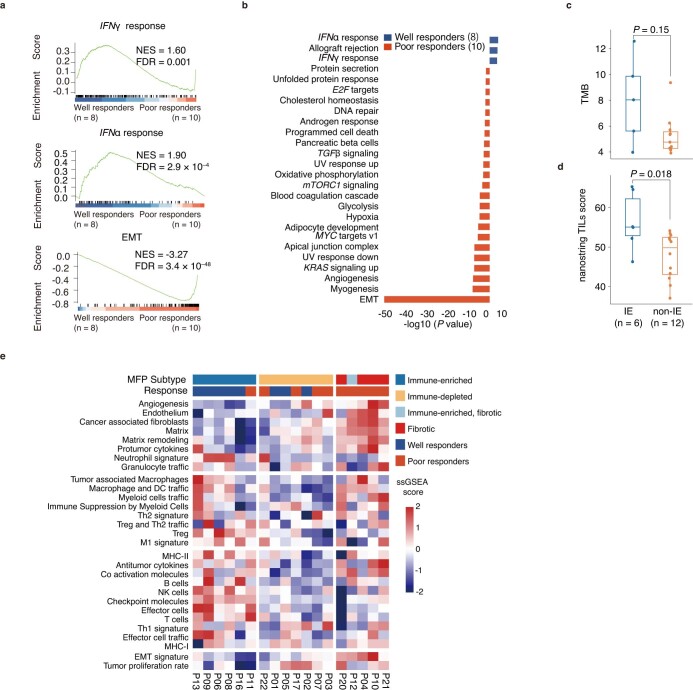
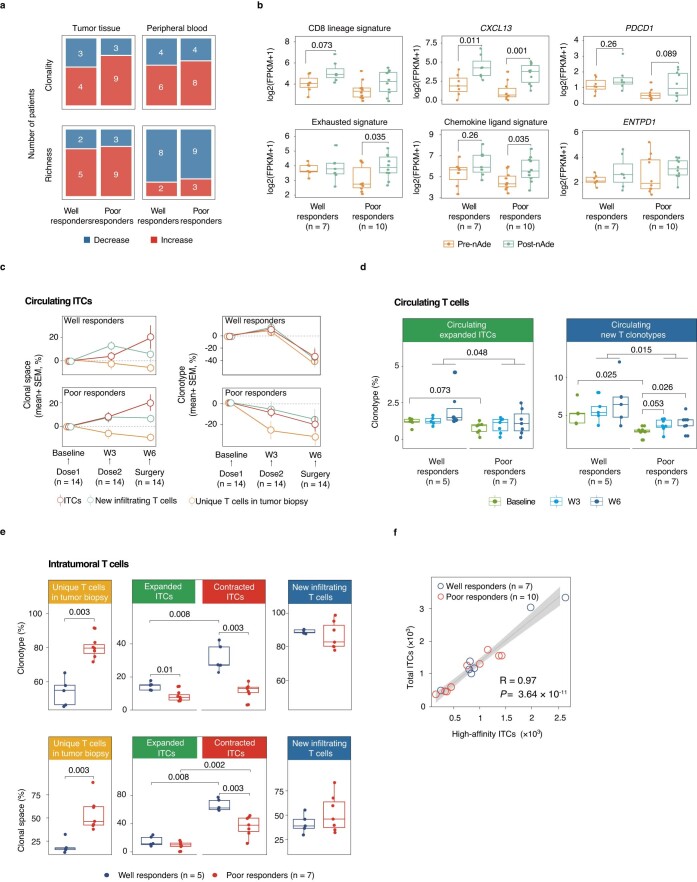
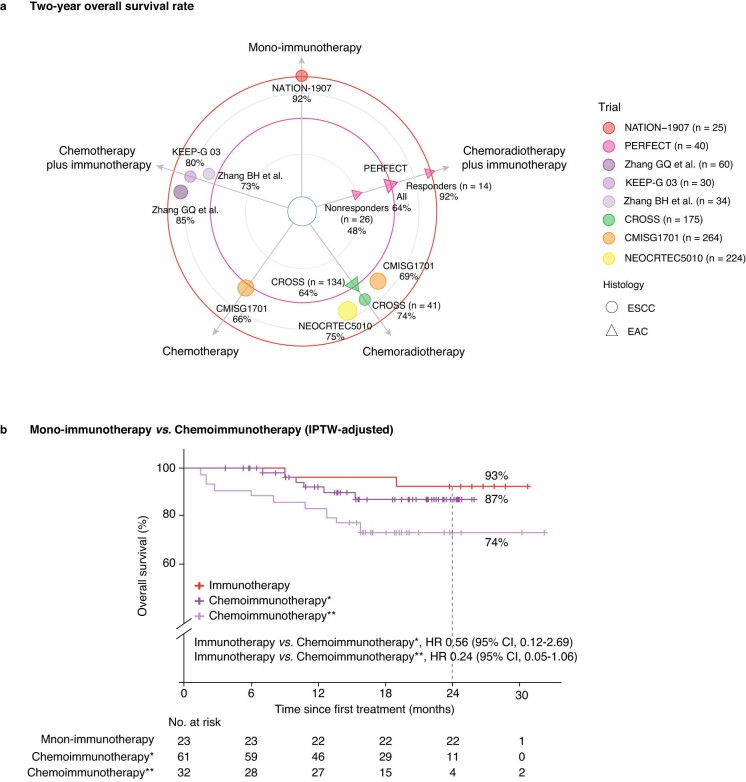
Overall survival (OS) benefits of neoadjuvant immunotherapy remain elusive in locally advanced esophageal squamous cell carcinomas (ESCC). Here, we reported the results of a phase 1b trial of neoadjuvant PD-L1 blockade with adebrelimab in resectable ESCC. Patients received two neoadjuvant doses of adebrelimab followed by surgery. The primary endpoints were safety and feasibility; secondary endpoints included pathologic complete response (pCR) and OS. Our data showed the primary endpoints of safety and feasibility had been met. Common treatment-related adverse events were anorexia (32%) and fatigue (16%), without grade 3 or more adverse events. Of the 30 patients enrolled in the trial, 25 underwent successful resection without surgery delay and 24% had major pathologic responses including a pCR rate of 8%. The 2-year OS was 92%. Responsive patients had an immune-enriched tumor microenvironment phenotype, whereas nonresponsive patients had greater infiltration of cancer-associated fibroblasts at baseline. Clonotypic dynamics of pre-existing intratumoral T cells was a hallmark of responsive patients. These findings provide a rational for neoadjuvant anti-PD-L1 monotherapy as a therapeutic strategy for patients with resectable ESCC. ClinicalTrials.gov identifier: NCT04215471 .


Conflict of interest statement

The authors declare no competing interests.

Figures

Fig. 1
Fig. 1. NATION-1907 study design.
a, NATION-1907 study design. pCR, no viable tumor; MPR, 0% to 10% viable tumor; partial pathologic response (pPR), 10% to 33% viable tumor; pathologic nonresponse (pNR), 33% to 100% viable tumor. b, Trial schema. Eligible patients were treated with two doses of neoadjuvant adebrelimab (20 mg per kg body weight, intravenously (IV), every 21 days (Q3W)), followed by surgical resection. Imaging studies were performed using radiological tools before and after immunotherapy. Tumor samples were collected at baseline and at the time of surgery. Longitudinal blood samples were collected at baseline, before dose 2, before surgery and within 4 weeks after surgery if available. D, day of therapy; R0, complete surgical resection. c, Treatment regimen in the neoadjuvant and adjuvant settings, and follow-up status per patient (n = 25). The boxplot shows OS in patients with (n = 12) or without (n = 13) adjuvant treatment. Symbols (dot or square) within each bar represent progression events, such as death or surgery. P value was calculated by two-sided Wilcoxon rank-sum test. For boxplots the center line and box boundaries represent the median, 25th and 75th percentiles respectively, upper and lower whiskers represent 1.5× interquartile range within the boxes and points indicate outliers. Source data
Fig. 2
Fig. 2. Preliminary efficacy.
a, Pathological response after nAde. The gray horizontal line indicates the threshold for MPR patients. Clinical and pathological features are annotated for each patient, as is PD-L1 expression (determined by Dako 22C3). b,c, Kaplan–Meier curves of OS (b) and RFS (c) for patients who received nAde followed by surgery in the NATION-1907 trial. Median OS and RFS were not reached. Source data
Fig. 3
Fig. 3. Immune-enriched TME phenotype in responsive patients.
a, Pearson correlation (two-sided) between mRNA expression of CD274 and percentage of pathological residual tumor (n = 18). Shaded regions represent 95% CI. The P value from two-sided t-tests is shown for statistical differences. b, ‘IFN/EMT score’ using machine learning methods in well and poor responders. c, Heatmap for the final 12-gene ‘IFN/EMT score’ defined in the NATION-1907 trial. Well responders, n = 7; poor responders, n = 6. d, Characteristics of IE, tumor-proliferation and fibroblast-enriched TME subtypes determined in the NATION-1907 trial. Clinical and exploratory biomarker features are annotated for each patient. Multiple comparisons were adjusted using the Benjamin–Hochberg method and gene sets of a cancer hallmark with q < 0.05 were found to be significantly enriched, as described elsewhere. *q < 0.05, **q < 0.01, ***q < 0.001. P values were computed through the two-sided permutation test (n = 1,000 randomizations). NK, natural killer cells; PC, plasma cell; PMN, polymorphonuclear cell; ssGSEA, single-sample GSEA. e, Proportion of TILs between IE and non-IE subtypes. f, Representative multiplex immunofluorescence images from well responders (IE, top, n = 2) and poor responders (non-IE, bottom, n = 2). The experiment was performed once. g, Proportion of fibroblasts in IE and non-IE subtype tumors. h, Proportion of IE subtype in well and poor responders. i, TME phenotype-guided stratification for OS in the TCGA ESCC Asia and White cohorts. P value was performed with two-sided log-rank test. P values in b, e and g were derived from a two-sided Wilcoxon rank-sum test. For the boxplots in b, e and g, the center line and box boundary represent the median, 25th and 75th percentiles respectively, upper and lower whiskers represent 1.5× interquartile range within the boxes and points indicate outliers. n indicates the number of patients. Source data
Fig. 4
Fig. 4. Dynamic evolution of the TME status in response to nAde.
a, Dynamic of TME subtypes during nAde. b, Proportion of TILs and fibroblasts before and after treatment. Points represent median values, whereas whiskers show the upper and lower quantiles. c, Representative multiplex immunofluorescence images of patients before and after treatment. Well responder (n = 1, P13); poor responder (n = 1, P03). The experiment was performed once. d,e, Heatmaps showing (d) the proportion of immune cells identified by multiplex immunofluorescence (mIF) images and (e) the relative cell proportion estimated by deconvolution analysis using bulk RNA-seq data. The color represents the scaled cellular proportion. f, Changes in the immune score and stromal score signature during nAde. g, Changes in HLA-II score, DC score and immune cytolytic activity between well and poor responders. h,i, Representative multiplex immunofluorescence images of (h) the immune-excluded pattern (n = 1, P22) and (i) the immune-suppressive pattern (n = 1, P03) in poor responders. The experiment was performed once. n is the independent number of patients. P values in f and g were calculated using a two-sided Wilcoxon rank-sum test. For the boxplots in f and g, the center line and box boundaries represent the median, 25th and 75th percentiles respectively, upper and lower whiskers represent 1.5× interquartile range within the boxes and points indicate outliers. Source data
Fig. 5
Fig. 5. Mechanism of pre-existing T cells in response to nAde.
a, Pearson correlation (two-sided) between productive T cell richness and pathological responses in the post-treatment tumor. Shaded region represents 95% CI. b, Productive richness and clonality of the TCR repertoire before and after treatment (well responders, n = 7; poor responders, n = 10). c, T cell fraction in tumor tissues and peripheral blood before and after treatment using WES data. d, Proportion of clonotype and clonal space for pre-existing ITCs. T cell clonal space is defined as the sum frequency of clones relative to the total T cell repertoire. Error bars indicate mean ± s.d. e, Temporal dynamics of circulating ITCs before, during and after therapy. Data show the mean ± s.e.m. W3, week 3; W6, week 6. f, Representative Sankey plot (n = 1, P13) showing clonal space of ITCs and new infiltrating T cells in tumor (upper) and peripheral blood (lower). g, Clonotypic dynamic (clonal expansion and contraction) of pre-existing ITCs during PD-L1 blockade, Representative examples of a well responder (left, P13) and a poor responder (right, P17). P values were calculated using a two-sided Fisher’s exact test. h, Pearson correlation (two-sided) between the number of high-affinity ITCs or neoantigens and the pathological response (n = 17). Shaded regions represent 95% CI. i, Representative Sankey diagrams of the relationship between ITCs and neoantigens in a well responder (left bar) and a poor responder (right bar). Neo, neoantigen. j, Sketch map of the process for the clonal replacement of ITCs and new infiltrated T cells. Mechanism for tumor-reactive T cells: (1) pre-existing ITCs were associated with immunotherapy efficacy; and (2) local expansion of pre-existing ITCs and new infiltrating T clonotypes involved in the response to immunotherapy, a phenomenon termed clonal revival. P values in a and h were calculated using a two-sided t-test, whereas in b, c and d P values were calculated using a two-sided Mann–Whitney test. For the boxplots in b and c, the center line and box boundaries represent the median, 25th and 75th percentiles respectively, upper and lower whiskers represent 1.5× interquartile range within the boxes and points indicate outliers. n is the independent number of patients. Source data
Extended Data Fig. 1
Extended Data Fig. 1. Patterns of radiologic and pathological response.
a, Multi-omics exploratory study design. b, Representative radiologic response before and after neoadjuvant adebrelimab blockade using PET-CT. Top: a well responder (n = 1); Bottom: a poor responder (n = 1); Left: before treatment; Right: after treatment. c, Representative pathological response before and after treatment (Hematoxylin and eosin staining, H&E). Left, a well responder (n = 1); right: a poor responder (n = 1). Experiment was performed once. PET-CT, Positron Emission Tomography and Computed Tomography Scans. WES, whole-exome sequencing; bulk RNA-seq, whole transcriptomic sequencing; TCR-seq, T cell repertoire sequencing; PD-L1 IHC staining (Dako 22C3 antibody); Multiplex IF, multiple immunofluorescences; n reflects the independent number of patients.
Extended Data Fig. 2
Extended Data Fig. 2. Post hoc comparative analysis with historical CMISG1701 trial.
a, b, Kaplan-Meier curves of overall survival and recurrence free survival between well responders and poor responders in NATION-1907 trial. The numbers of patients at risk at 6-month intervals were included below the x-axis. P values were calculated using a two-sided log rank test. c, Comparison of treatment-related adverse events in neoadjuvant adebreliamb (nAde) versus neoadjuvant chemotherapy (nCT) and in nAde versus neoadjuvant chemoradiotherapy (nCRT). Grade 3 or more events were labeled in red color, Grade 1 or 2 events were labeled in blue. Adverse events, *One of 132 patients in nCT group and 2 of 132 patients in nCRT group declined to receive treatment. d,e, Kaplan-Meier curves of recurrence free survival and overall survival in patients treated with nAde versus historical patients with nCT or nCRT after Inverse probability treatment weighting (IPTW) adjustment, respectively. The 2-year recurrence free survival and overall survival rate were estimated by Kaplan-Meier method. n reflects the number of patients. HR, hazard ratio; 95% CI, 95% confidence interval. Source data
Extended Data Fig. 3
Extended Data Fig. 3. Correlation between genomic biomarkers and pathological response.
a, Somatic variants in tumor tissues. b, Violin plot of TMB and MSI in well responders and poor responders. P values were assessed by two-sided Wilcoxon rank-sum test. c, Correlation between the number of sequence alterations and percentage of residual tumor cells after anti-PD-L1 treatment (Pearson rho, R = −0.68; P = 0.003). The dashed green line indicated the linear regression line. Shaded region represent 95% CI. P values from two-sided t-test were shown for statistical differences. n reflects the independent number of patients. TMB, tumor mutation burden; MSI, microsatellite instability. Source data
Extended Data Fig. 4
Extended Data Fig. 4. Validation of IFN/EMT score in pan-cancer immunotherapy cohorts.
a, mRNA expression of CD274, IFNG, CIITA between well and poor responders. b, Differential expressed genes between well and poor responders. P values were derived from two-sided Wald test. The Benjamin-Hochberg method was used to calculate adjusted P values for multiple comparisons. c, Immunofluorescence images of PD-L1 expression in well (n = 2) and poor responders (n = 2). Experiment was performed once. d, IFN/EMT score validated in previously published pan-cancer immunotherapy cohorts between responders and non-responders (R versus NR, or CR/PR versus SD/PD). P values of a and d were derived from two-sided Wilcoxon rank-sum test. For box plots of a and d, center line, box boundaries represent median, 25th and 75th percentiles respectively, and upper and lower whiskers represent 1.5 × interquartile range within the boxes and points indicate outlines. n reflects the independent number of patients. RECIST, Response Evaluation Criteria in Solid Tumors. ESCC, esophageal squamous carcinoma; EAC, esophageal adenocarcinoma; GC, gastric cancer; mUC, metastatic urothelial carcinoma; NSCLC, non-small cell lung cancer. Source data
Extended Data Fig. 5
Extended Data Fig. 5. Differential enriched pathways in responsive patients.
a, b, Enriched pathways of cancer hallmarks between well and poor responders. P values were computed through the two-sided permutation test (n = 1,000 randomizations). The Benjamin-Hochberg method was used to calculate FDR-adjusted P value for multiple comparisons. EMT, epithelial-mesenchymal transition. c, TMB value difference between IE and non-IE subtype tumors. d, TILs infiltration between IE and non-IE subtype tumors using nanostring data. e, Heatmap of MFP classification using previously published method (n = 18). MFP, Molecular Functional Portrait. P values of c and d were derived from two-sided Wilcoxon rank-sum test. For box plots of c and d, center line, box boundaries represent median, 25th and 75th percentiles respectively, and upper and lower whiskers represent 1.5 × interquartile range within the boxes and points indicate outliers. IE, Immune-enriched subtype; non-IE, Tumor-proliferation subtype and Fibroblast-enriched subtype. n reflects the independent number of patients. Source data
Extended Data Fig. 6
Extended Data Fig. 6. Validation of TME phenotype in pan-cancer immunotherapy cohorts.
a, Proportions of IE subtype between responders and non-responders in pan-cancer immunotherapy datasets. P values was assessed by two-sided Wilcoxon rank-sum test. For boxplot, center line, box boundaries represent median, 25th and 75th percentiles respectively, and upper and lower whiskers represent 1.5 × interquartile range within the boxes and points indicate outliers. b, c, Correlation of TME subtype and clinical benefits in pan-cancer immunotherapy datasets. Left panel, heatmap of TME subtype using 13 pathways of cancer hallmarks identified in the NATION-1907 trial; Middle panel, proportion of IE subtype in multiple cancer types; Right panel, Kaplan-Meier overall survival and progression free survival in patients with IE and non-IE subtype. d, Heatmap of TME phenotype in TCGA-ESCC cohort (Asia, n = 42, non-Asia, n = 40) using 13 pathways identified in the NATION-1907 trial. e, Kaplan-Meier overall survival of patients with IE and non-IE subtype in TCGA-ESCC Asian cohort (n = 42) and TCGA-ESCC White cohort (n = 33). P values of b, c and e was calculated using two-sided log rank test of the Kaplan-Meier estimation of overall survival and progression free survival rate. n reflects the independent number of patients. R, responders; NR, non-responders; ESCC, esophgeal squamous carcinoma; EAC, esophageal adenocarcinoma; GC, gastric cancer; mUC, metastatic urothelial carcinoma; NSCLC, non-small cell lung cancer. IE, immune-enriched subtype; non-IE, Tumor-proliferation subtype and Fibroblast-enriched subtype. Source data
Extended Data Fig. 7
Extended Data Fig. 7. TCR repertoire in peripheral blood and tumor tissues.
a, TCR repertoire clonality (top) and richness (bottom) after treatment in tumor tissues and peripheral blood. b, Changes of signature score related to tumor-reactive T cells between well responders and poor responders. c, Temporal dynamics of ITCs in peripheral blood before, on and after therapy. Data show the clonal space and clonotypes with mean ± s.e.m. for well (top) and poor responders (bottom). d, Clonotypes dynamics of expanded ITCs and circulating new T clones in peripheral blood during anti-PD-L1 treatment. Circulating expanded ITCs were defined as shared same clonotypes between peripheral T cell repertoire and clonally expanded ITCs, suggesting expanded ITCs who also existed in peripheral blood. Circulating new T clonotypes were defined as shared same clonotypes between peripheral T cell repertoire and new T clonotypes in the posttreatment tumors, suggesting new T clonotypes who also existed in peripheral blood. e, Clonotypes and clonal space of clonally expanded ITCs, contracted ITCs and new T clones in tumors. f, Correlation between total ITCs and high-affinity ITCs, Pearson rho, 0.97; P < 0.001. Shaded region represent 95% CI. P value from two-sided t-test was shown for statistical differences. P values of b, d and e were derived from two-sided Wilcoxon rank-sum test. n reflects the independent number of patients. For boxplot of b, d and e, center line, box boundaries represent median, 25th and 75th percentiles respectively, and upper and lower whiskers represented 1.5 × interquartile range within the boxes and points indicate outliers. Source data
Extended Data Fig. 8
Extended Data Fig. 8. Clinical efficacy comparison of neoadjuvant therapeutic strategy in esophageal cancers.
a, 2-year of overall survival of esophageal cancer patients in different clinical trials in the neoadjuvant settings; ESCC, esophageal squamous carcinoma; EAC, esophageal adenocarcinoma. b, Kaplan-Meier curves of overall survival in patient with neoadjuvant mono-immunotherapy versus chemoimmunotherapy after IPTW adjustment. 24-month overall survival was 93% (95% CI, 83 to 100) in mono-immunotherapy, compared with 87% (95% CI, 78 to 97) in chemoimmunotherapy* and 74% (95% CI, 60 to 91) in chemoimmunotherapy **, respectively; *, chemoimmunotherapy results from Zhang GQ et al. (Refs. ), **, chemoimmunotherapy results from Zhang BH et al (Ref. ). n reflects the patient’s number. HR, hazard ratio. Source data

References

    1. Eyck BM, et al. Ten-year outcome of neoadjuvant chemoradiotherapy plus surgery for esophageal cancer: the randomized controlled CROSS trial. J. Clin. Oncol. 2021;39:1995–2004. doi: 10.1200/JCO.20.03614. - DOI - PubMed
    1. Tang H, et al. Neoadjuvant chemoradiotherapy versus neoadjuvant chemotherapy followed by minimally invasive esophagectomy for locally advanced esophageal squamous cell carcinoma: a prospective multicenter randomized clinical trial. Ann. Oncol. 2023;34:163–172. doi: 10.1016/j.annonc.2022.10.508. - DOI - PubMed
    1. Yang H, et al. Long-term efficacy of neoadjuvant chemoradiotherapy plus surgery for the treatment of locally advanced esophageal squamous cell carcinoma: the NEOCRTEC5010 randomized clinical trial. JAMA Surg. 2021;156:721–729. doi: 10.1001/jamasurg.2021.2373. - DOI - PMC - PubMed
    1. Kelly RJ, et al. Adjuvant nivolumab in resected esophageal or gastroesophageal junction cancer. N. Engl. J. Med. 2021;384:1191–1203. doi: 10.1056/NEJMoa2032125. - DOI - PubMed
    1. Ho WJ, et al. Neoadjuvant cabozantinib and nivolumab converts locally advanced HCC into resectable disease with enhanced antitumor immunity. Nat. Cancer. 2021;2:891–903. doi: 10.1038/s43018-021-00234-4. - DOI - PMC - PubMed

Publication types

MeSH terms

Associated data