Clinical Trial
. 2023 Aug;29(8):2110-2120.
doi: 10.1038/s41591-023-02478-2. Epub 2023 Jul 24.

Trastuzumab deruxtecan in metastatic breast cancer with variable HER2 expression: the phase 2 DAISY trial

Affiliations
Clinical Trial

Trastuzumab deruxtecan in metastatic breast cancer with variable HER2 expression: the phase 2 DAISY trial

Fernanda Mosele et al. Nat Med. 2023 Aug.

Abstract

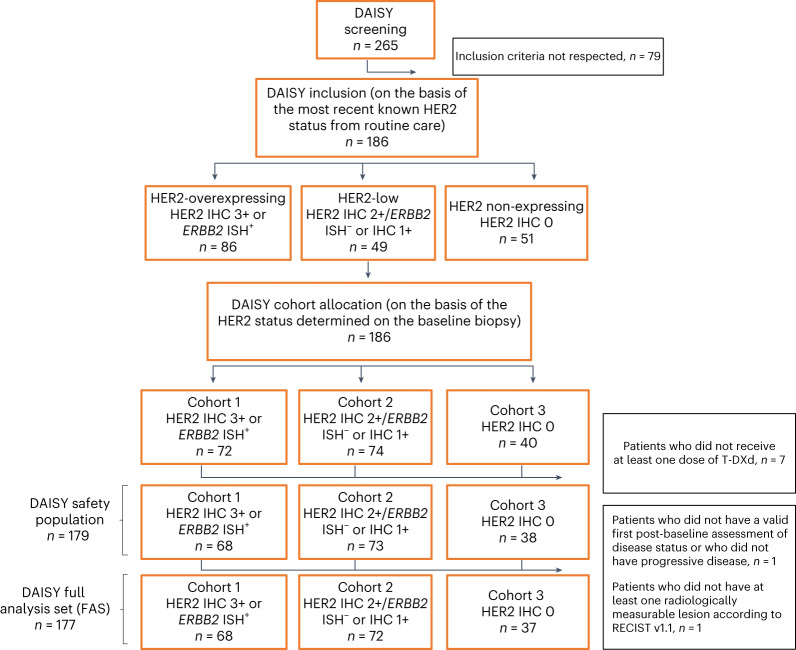
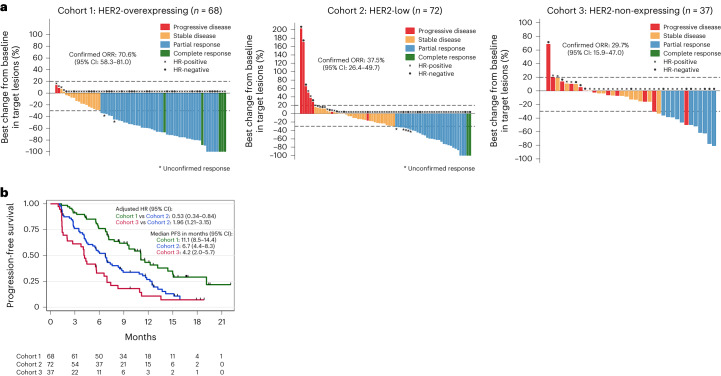
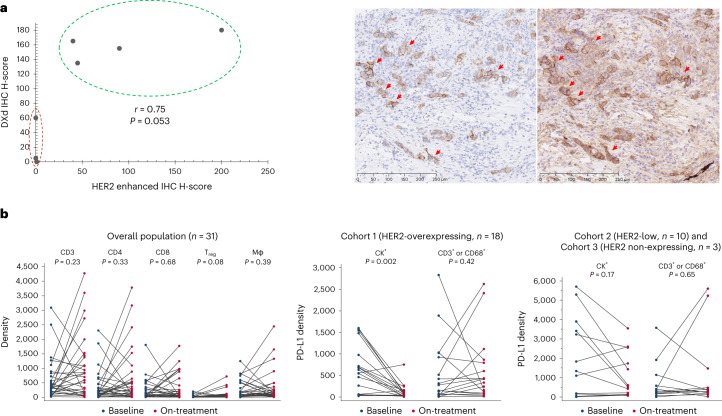
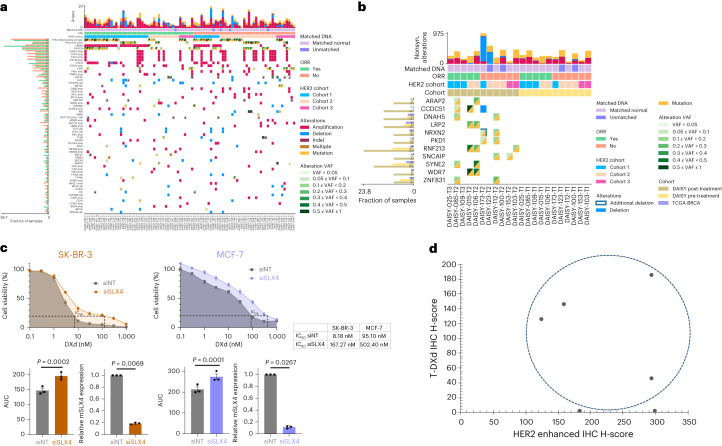
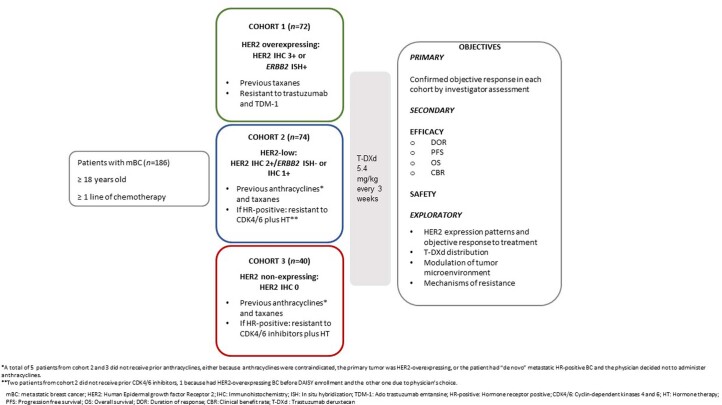
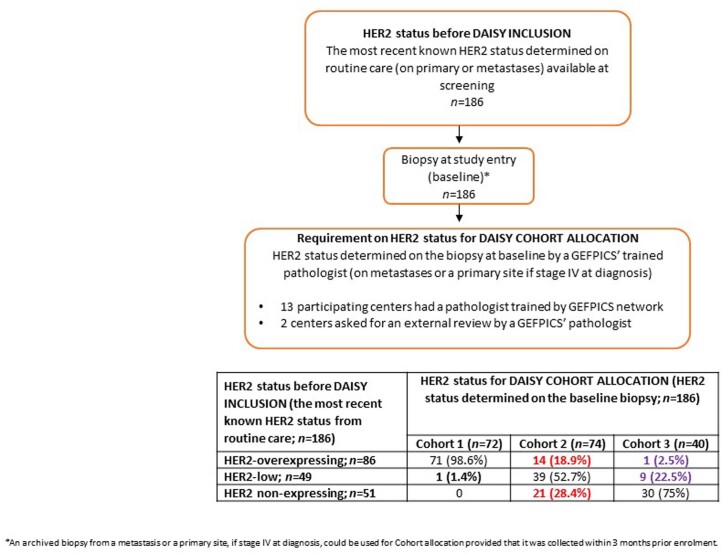
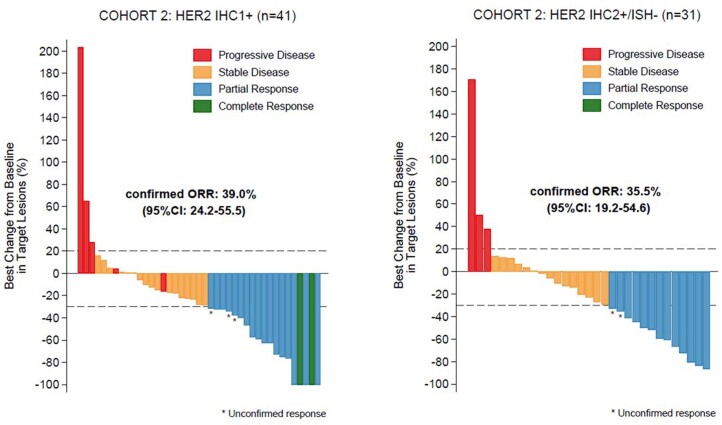
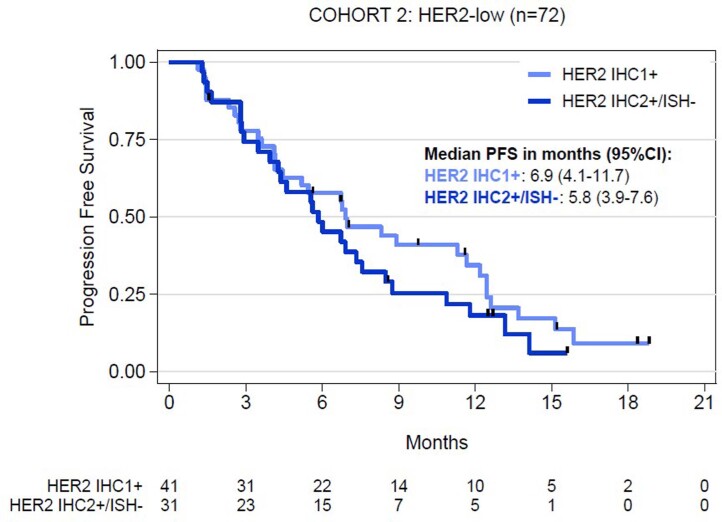
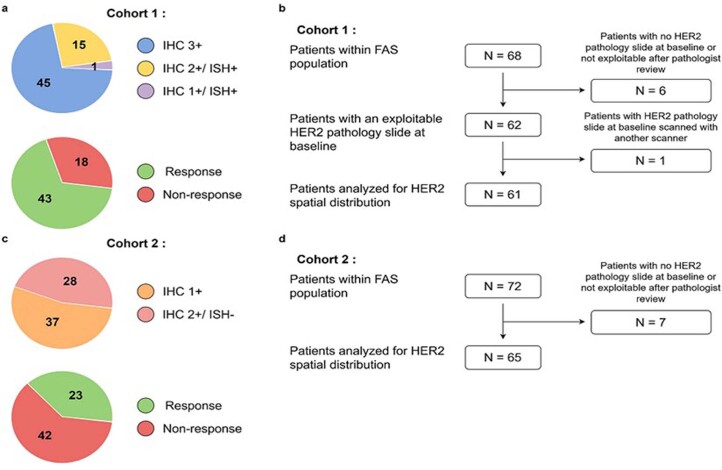
The mechanisms of action of and resistance to trastuzumab deruxtecan (T-DXd), an anti-HER2-drug conjugate for breast cancer treatment, remain unclear. The phase 2 DAISY trial evaluated the efficacy of T-DXd in patients with HER2-overexpressing (n = 72, cohort 1), HER2-low (n = 74, cohort 2) and HER2 non-expressing (n = 40, cohort 3) metastatic breast cancer. In the full analysis set population (n = 177), the confirmed objective response rate (primary endpoint) was 70.6% (95% confidence interval (CI) 58.3-81) in cohort 1, 37.5% (95% CI 26.4-49.7) in cohort 2 and 29.7% (95% CI 15.9-47) in cohort 3. The primary endpoint was met in cohorts 1 and 2. Secondary endpoints included safety. No new safety signals were observed. During treatment, HER2-expressing tumors (n = 4) presented strong T-DXd staining. Conversely, HER2 immunohistochemistry 0 samples (n = 3) presented no or very few T-DXd staining (Pearson correlation coefficient r = 0.75, P = 0.053). Among patients with HER2 immunohistochemistry 0 metastatic breast cancer, 5 of 14 (35.7%, 95% CI 12.8-64.9) with ERBB2 expression below the median presented a confirmed objective response as compared to 3 of 10 (30%, 95% CI 6.7-65.2) with ERBB2 expression above the median. Although HER2 expression is a determinant of T-DXd efficacy, our study suggests that additional mechanisms may also be involved. (ClinicalTrials.gov identifier NCT04132960 .).


Conflict of interest statement

F.M. received consultant fees from Novartis and Pegascy. E.D. received personal fees and non-financial support from Novartis, Pfizer, AstraZeneca, Daiichi Sankyo, GlaxoSmithKline, Eli Lilly and Merck Sharp & Dohme. T.F. received consultant fees outside the submitted work and compensation to the institution from Cellectis, Roche and Eli Lilly. B.P. received fees as advisor/consultant from Pierre Fabre (self), Daiichi Sankyo (self), Merck Sharp & Dohme (institution), Seattle Genetics (institution), Eli Lilly (institution) and Novartis (institution); funding to institution for research support from Daiichi Sankyo and AstraZeneca; and travel expenses from AstraZeneca, Pfizer and Gilead. T.B. reports receiving grants and personal fees from Daiichi Sankyo, AstraZeneca, Pfizer and Seattle Genetics and personal fees from Novartis and Roche outside the submitted work. M.K. and T.K. are employees of Daiichi Sankyo RD Novare. M.L.T. received consultant fees as speaker and consultant from AstraZeneca and Daiichi Sankyo. V.D. received travel expenses from Roche, Novartis, Pfizer, Eli Lilly, AstraZeneca, Daiichi Sankyo, Seagen and Gilead; honoraria as consultant/advisor from Roche, Genentech, Novartis, Eli Lilly, Pfizer, AstraZeneca, AbbVie, Merck Sharp & Dohme, Daiichi Sankyo, Seagen, Gilead, Eisai and Pierre Fabre Oncologie; and honoraria for symposia from Roche, Novartis, Pfizer, Eli Lilly, Astra Zeneca, Daiichi Sankyo, Seagen and Gilead. F.A. received research funding and served as speaker/advisor (compensated to the hospital) from Roche, AstraZeneca, Daiichi Sankyo, Pfizer, Novartis and Eli Lilly. The following authors have no disclosures: A.L., L.L.B., Y.P., A.D., F.V., C.L., N.S., A.A., D.T.N.T., I.J.G., H.T., S.C., M.V., N.D., A.S., L.L., P.S., J.B., M.D., M.J., C.M., V.B., P.L., P.K. and V.M.

Figures

Fig. 1
Fig. 1. CONSORT diagram.
IHC+, IHC-positive; IHC, IHC-negative.
Fig. 2
Fig. 2. Efficacy of T-DXd per cohort.
a, Waterfall plot of the best change from baseline in target lesions according to the best objective response per cohort in the FAS population (n = 177). The confirmed ORR with T-DXd was 70.6% (n = 68, 95% CI 58.3–81) in cohort 1, 37.5% (n = 72, 95% CI 26.4–49.7) in cohort 2 and 29.7% (n = 37, 95% CI 15.9–47) in cohort 3. The likelihood of confirmed objective response was higher in cohort 1 as compared to cohort 2 (adjusted OR: 3.96, 95% CI 1.78–8.77, P = 0.001) and not significantly different between cohort 3 and cohort 2 (adjusted OR: 0.63, 95% CI 0.25–1.54, P = 0.30). The adjusted OR and P value were derived from a multivariable logistic model taking as reference cohort 2 and adjusted for hormone receptor status, interval from initial diagnosis to metastatic disease, number and type of metastatic site, ECOG performance status and interval from diagnosis of metastatic disease to inclusion. All statistical tests were two-sided. b, Kaplan–Meier plot of PFS per cohort in the FAS population (n = 177). The median PFS was 11.1 months (95% CI 8.5–14.4) in cohort 1, 6.7 months (95% CI 4.4–8.3) in cohort 2 and 4.2 months (95% CI 2.0–5.7) in cohort 3. PFS was longer in cohort 1 (adjusted HR: 0.53, 95% CI 0.34–0.84, P = 0.007) and shorter in cohort 3 (adjusted HR: 1.96 95% CI 1.21–3.15, P = 0.006) compared to cohort 2. The adjusted HR and P value were derived from a multivariable Cox proportional hazard model taking as reference cohort 2 and adjusted to the same variables used for the confirmed objective response. All statistical tests were two-sided.
Fig. 3
Fig. 3. HER2 expression patterns and treatment response.
a, Clusters’ relative percentage according to T-DXd sensitivity in cohort 1 (HER2-overexpressing). For each patient, the corresponding HER2 pathology slide (n = 61) was divided into 64 × 64-px non-overlapping patches that were classified into eight clusters using a Mini-Batch K-means algorithm. The following box plot illustrates the relative percentage of each cluster in each slide and its association with the confirmed objective response or non-response to T-DXd. Box center lines, box ranges, whiskers and dots indicate medians, quartiles, 1.5× IQR and outliers, respectively. Cluster 6 presented a significant association with non-response to T-DXd (P = 0.011, FDR-adjusted P = 0.086). P values were calculated using the Mann–Whitney U-test and adjusted for multiple hypothesis testing using the Benjamini–Hochberg method. All statistical tests were two-sided. b, One pair of pathology slides that shows cluster 6 in red. A patient with resistance (left) and sensitivity (right) to T-DXd. Cluster 6 comprised HER2-negative areas with moderate cell density (mean value of 30% (95% CI 25–34)), containing mainly fibroblasts and immune cells (mean value of 56% (95% CI 50–62) and 27% (95% CI 22–32), respectively).
Fig. 4
Fig. 4. Mechanisms of action of T-DXd.
a, Illustration of the correlation between T-DXd distribution and HER2 expression. T-DXd was determined by IHC using an Ac anti-DXd (H-score) and HER2 by an enhanced protocol of IHC (H-score) in seven paired samples at baseline and during treatment. The staining was performed in one sample per case. The correlation was calculated by Pearson correlation coefficient, which showed a moderate correlation (r = 0.75, P = 0.053). P value was calculated using a two-sided Pearson correlation test. On the bottom, a pathology slide that shows HER2 staining (red arrows) on the left and T-DXd staining (red arrows) on the right. b, Illustration of the immune microenvironment modulation by T-DXd. Tumor biopsies at baseline and days 22–43 after cycle 1 of T-DXd were assessed by multiplex immunofluorescence (n = 31). No quantitative modulation of the immune microenvironment by T-DXd in the overall population (n = 31) was observed. There was a significant decrease in PD-L1 expression presumably due to the cytotoxic effect of T-DXd on tumor cells (CK+/PD-L1+) in patients with HER2-overexpressing mBC (n = 18, P = 0.002). Immune cells, represented by CD3+/PD-L1+ or CD68+/PD-L1+, did not show a decrease during treatment in cohort 1 (n = 18, P = 0.42). No significant decrease of PD-L1+ tumor (P = 0.17) or immune cells (P = 0.65) was observed in patients with HER2-low and HER2-non-expressing mBC (n = 13) during treatment. Blue bullets and red bullets represent at-baseline and on-treatment samples, respectively. P values were calculated using the Wilcoxon matched-pairs signed-rank test. All statistical tests were two-sided.Mφ, macrophage; Treg, regulatory T cell.
Fig. 5
Fig. 5. Mechanisms of resistance to T-DXd.
a, Oncoplot of driver mutations and CNAs identified in at least 3% of tumor biopsies at baseline (n = 89). Blood samples were available for analyses in 84 patients. If a gene has at least one driver mutation or CNA in at least 3% of pretreatment biopsies, any other driver alteration of the same gene is shown, regardless of its frequency. b, Oncoplot of acquired genomic alterations identified at resistance (n = 11). Eleven biopsies at resistance (on the left) were matched with pretreatment biopsies (on the right) from the same patient. Only genes that were not altered in any of the 11 pretreatment samples and that acquired an alteration in at least two samples at resistance (three samples in case all events were CNAs) are shown. The left histogram depicts the frequency at which the gene was altered in the pretreatment (n = 89), resistance (n = 21) and TCGA-BRCA (n = 684) cohorts for comparison. c, Dose–response survival curves of SK-BR-3 and MCF-7 cell lines transfected with non-targeting or SLX4-targeted siRNAs (siNT or siSLX4, respectively) and exposed to DXd at the indicated doses for 5 days. Area under the curve (AUC) and IC80 values were determined for each condition. Data are mean surviving fractions ± s.e.m., n = 3 experiments for both cell lines. Statistical analysis was performed using Welch’s t-test (two-tailed). d, Illustration of T-DXd uptake and HER2 expression at resistance (n = 6). T-DXd was determined by IHC using an Ac anti-DXd (H-score) and HER2 by an enhanced protocol of IHC (H-score). T-DXd was observed in four of six patients whose biopsy at resistance was done ≤6 weeks after last T-DXd infusion.
Extended Data Fig. 1
Study Design.
Extended Data Fig. 2
Determination of HER2 status by standard immunohistochemistry before DAISY inclusion and for cohort allocation.
Extended Data Fig. 3
Extended Data Fig. 3. Waterfall plot of the best change from baseline in target lesions according to the best objective response of patients from cohort 2 in FAS population (n = 72) according to HER2 status.
On the left, patients with HER2 IHC 1+ (n = 41) and on the right patients with HER2 IHC 2 + /ERBB2 ISH- (n = 31) treated with T-DXd.
Extended Data Fig. 4
Extended Data Fig. 4. Kaplan-Meier plot of PFS in the FAS population from cohort 2 (n = 72) according to HER2 status.
The median PFS was 6.9 months (95% CI 4.1-11.7) in patients with IHC 1+ (n = 41) and 5.8 months (95% CI 3.9-7.6) in patients with IHC 2 + /ERBB2 ISH- mBC (n = 31).
Extended Data Fig. 5
Extended Data Fig. 5. Dataset description for HER2 expression spatial analysis.
a. Distribution of HER2 IHC score and confirmed objective response in the dataset in cohort 1 (HER2-overexpressing). The numbers represent the number of patients analyzed (n = 61). b. Description of the patient set considered for HER2 spatial distribution analysis in cohort 1. c. Distribution of HER2 IHC score and confirmed objective response in the dataset in cohort 2 (HER2-low). The numbers represent the number of patients analyzed (n = 65). d. Description of the patient set considered for HER2 spatial distribution analysis in cohort 2.
Extended Data Fig. 6
Extended Data Fig. 6. Identifying an optimal number of clusters in cohort 1.
The Davies-Bouldin index was computed from Mini-Batch K-Means clustering using a number of clusters ranging from 7 to 12. This index represents how the clusters are similar to each other, with a lower value pointing toward a better segmentation. Minimum is highlighted on the graph at 8 clusters.
Extended Data Fig. 7
Extended Data Fig. 7. Tissue and blood samples per time point and cohort used for translational analyses.
Cohort 1: HER2-overexpressing (HER2 IHC 3+ or ERBB2 ISH+) mBC, cohort 2: HER2-low (HER2 IHC 2+/ERBB2 ISH- or IHC 1+) mBC, cohort 3: HER2 non-expressing (HER2 IHC0) mBC.
Extended Data Fig. 8
Extended Data Fig. 8. Immune cell density at 0 to 10 µm of tumor cells, in baseline and on treatment tumor biopsies in cohort 1 (HER2-overexpressing, n = 18).
A significant decrease in tumor cell-proximate macrophage was observed during treatment (FDR-adjusted p = 0.0305). Blue bullets and red ones represents at baseline and on-treatment samples, respectively. P-values were calculated using the Wilcoxon matched-pairs signed-rank test and adjusted for multiple hypothesis testing using the Benjamini-Hochberg method. All statistical tests were two sided.

References

    1. Sung, H. et al. Global Cancer Statistics 2020: GLOBOCAN estimates of incidence and mortality worldwide for 36 cancers in 185 countries. CA Cancer J. Clin. 71, 209–249 (2021). - PubMed
    1. Malmgren JA, Mayer M, Atwood MK, Kaplan HG. Differential presentation and survival of de novo and recurrent metastatic breast cancer over time: 1990–2010. Breast Cancer Res. Treat. 2018;167:579–590. doi: 10.1007/s10549-017-4529-5. - DOI - PMC - PubMed
    1. Grinda T, et al. Evolution of overall survival and receipt of new therapies by subtype among 20 446 metastatic breast cancer patients in the 2008–2017 ESME cohort. ESMO Open. 2021;6:100114. doi: 10.1016/j.esmoop.2021.100114. - DOI - PMC - PubMed
    1. National Cancer Institute. Surveillance, Epidemiology, and End Results Program. Cancer Stat Facts: Female Breast Cancer.https://seer.cancer.gov/statfacts/html/breast.html
    1. Cancer Genome Atlas Network. Comprehensive molecular portraits of human breast tumours. Nature490, 61–70 (2012). - PMC - PubMed

Publication types

Associated data