

Impact of virtual monoenergetic levels on coronary plaque volume components using photon-counting computed tomography
- PMID: 37488295
- PMCID: PMC10667372
- DOI: 10.1007/s00330-023-09876-7
Impact of virtual monoenergetic levels on coronary plaque volume components using photon-counting computed tomography
Abstract
Objectives: Virtual monoenergetic images (VMIs) from photon-counting CT (PCCT) may change quantitative coronary plaque volumes. We aimed to assess how plaque component volumes change with respect to VMIs.
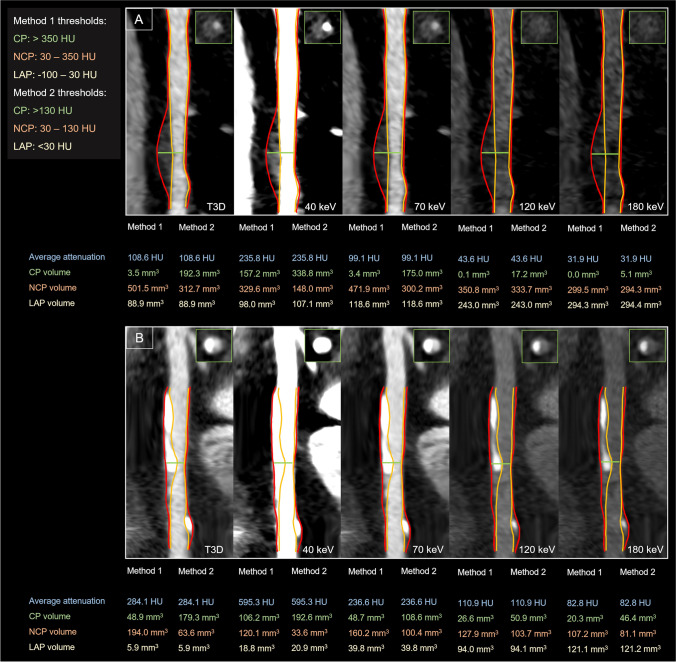
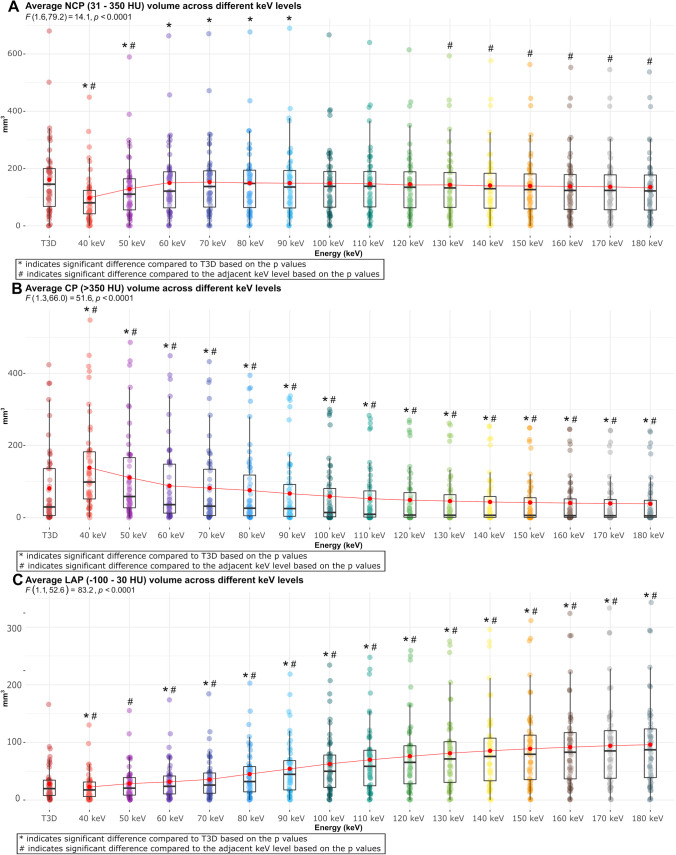
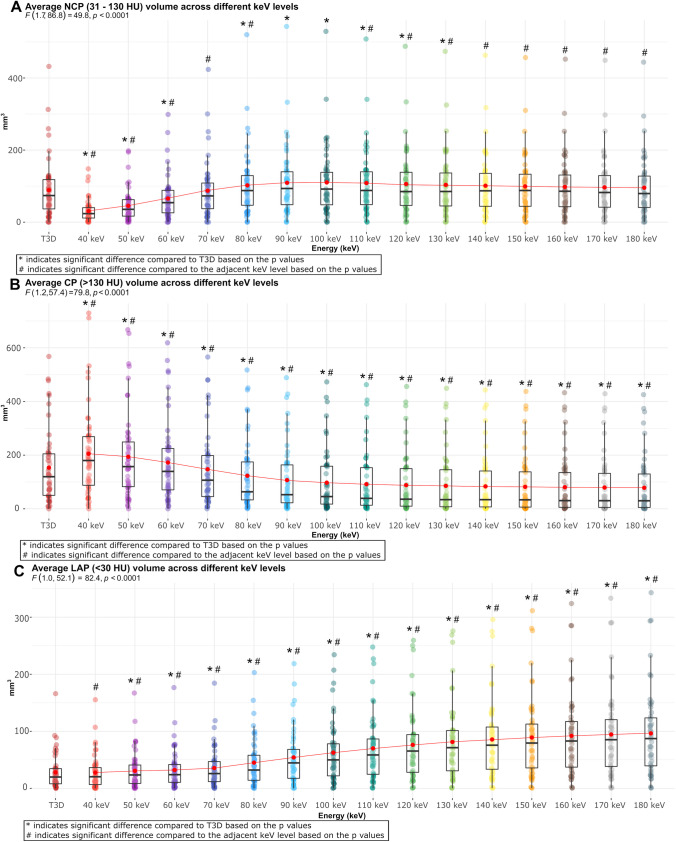
Methods: Coronary CT angiography (CTA) images were acquired using a dual-source PCCT and VMIs were reconstructed between 40 and 180 keV in 10-keV increments. Polychromatic images at 120 kVp (T3D) were used as reference. Quantitative plaque analysis was performed on T3D images and segmentation masks were copied to VMI reconstructions. Calcified plaque (CP; > 350 Hounsfield units, HU), non-calcified plaque (NCP; 30 to 350 HU), and low-attenuation NCP (LAP; - 100 to 30 HU) volumes were calculated using fixed thresholds.
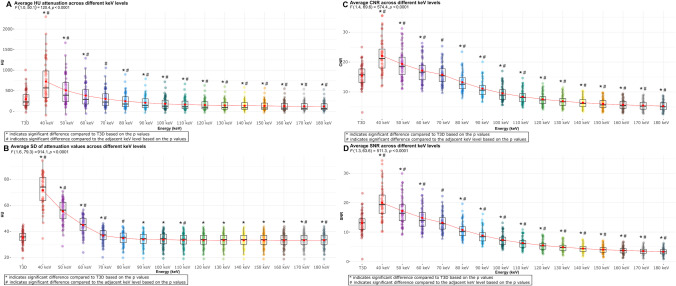
Results: We analyzed 51 plaques from 51 patients (67% male, mean age 65 ± 12 years). Average attenuation and contrast-to-noise ratio (CNR) decreased significantly with increasing keV levels, with similar values observed between T3D and 70 keV images (299 ± 209 vs. 303 ± 225 HU, p = 0.15 for mean HU; 15.5 ± 3.7 vs. 15.8 ± 3.5, p = 0.32 for CNR). Mean NCP volume was comparable between T3D and 100-180-keV reconstructions. There was a monotonic decrease in mean CP volume, with a significant difference between all VMIs and T3D (p < 0.05). LAP volume increased with increasing keV levels and all VMIs showed a significant difference compared to T3D, except for 50 keV (28.0 ± 30.8 mm3 and 28.6 ± 30.1 mm3, respectively, p = 0.63).
Conclusions: Estimated coronary plaque volumes significantly differ between VMIs. Normalization protocols are needed to have comparable results between future studies, especially for LAP volume which is currently defined using a fixed HU threshold.
Clinical relevance statement: Different virtual monoenergetic images from photon-counting CT alter attenuation values and therefore corresponding plaque component volumes. New clinical standards and protocols are required to determine the optimal thresholds to derive plaque volumes from photon-counting CT.
Key points: • Utilizing different VMI energy levels from photon-counting CT for the analysis of coronary artery plaques leads to substantial changes in attenuation values and corresponding plaque component volumes. • Low-energy images (40-70 keV) improved contrast-to-noise ratio, however also increased image noise. • Normalization protocols are needed to have comparable results between future studies, especially for low-attenuation plaque volume which is currently defined using a fixed HU threshold.
Keywords: Atherosclerosis; CT angiography; Coronary arteriosclerosis; Reproducibility of results.
© 2023. The Author(s).
Conflict of interest statement
The authors of this manuscript declare relationships with the following companies:
Michelle C Williams has given talks for Canon Medical Systems and Siemens Healthineers.
Damini Dey has received software royalties from Cedars Sinai Medical Center.
Florian Schwarz and University Hospital Augsburg have received speaker honoraria from Siemens Healthineers.
Figures
References
-
- Williams MC, Kwiecinski J, Doris M, et al. Low-Attenuation Noncalcified Plaque on Coronary Computed Tomography Angiography Predicts Myocardial Infarction: Results From the Multicenter SCOT-HEART Trial (Scottish Computed Tomography of the HEART) Circulation. 2020;141:1452–1462. doi: 10.1161/CIRCULATIONAHA.119.044720. - DOI - PMC - PubMed
MeSH terms
Grants and funding
LinkOut - more resources
Full Text Sources
Research Materials
Miscellaneous
