. 2023 Jul 24;6(1):772.
doi: 10.1038/s42003-023-05081-w.

Comparative pathogenicity of SARS-CoV-2 Omicron subvariants including BA.1, BA.2, and BA.5

Collaborators, Affiliations

Comparative pathogenicity of SARS-CoV-2 Omicron subvariants including BA.1, BA.2, and BA.5

Tomokazu Tamura et al. Commun Biol. .

Abstract

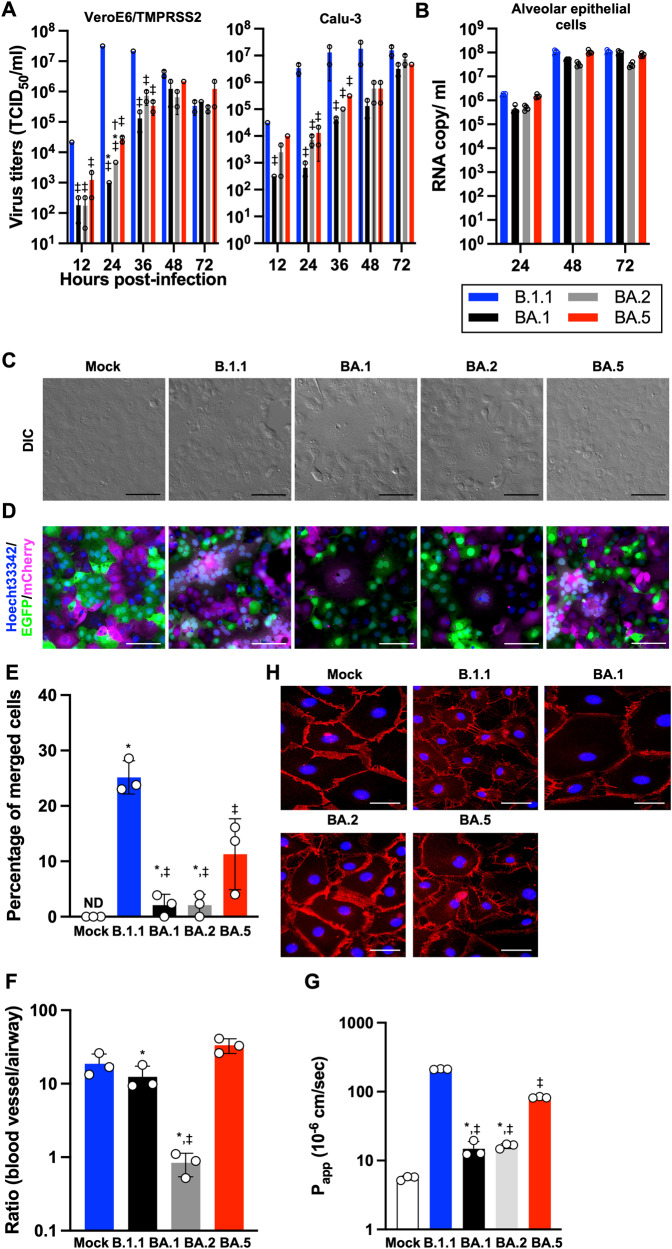
The unremitting emergence of severe acute respiratory syndrome coronavirus 2 (SARS-CoV-2) variants necessitates ongoing control measures. Given its rapid spread, the new Omicron subvariant BA.5 requires urgent characterization. Here, we comprehensively analyzed BA.5 with the other Omicron variants BA.1, BA.2, and ancestral B.1.1. Although in vitro growth kinetics of BA.5 was comparable among the Omicron subvariants, BA.5 was much more fusogenic than BA.1 and BA.2. Airway-on-a-chip analysis showed that, among Omicron subvariants, BA.5 had enhanced ability to disrupt the respiratory epithelial and endothelial barriers. Furthermore, in our hamster model, in vivo pathogenicity of BA.5 was slightly higher than that of the other Omicron variants and less than that of ancestral B.1.1. Notably, BA.5 gains efficient virus spread compared with BA.1 and BA.2, leading to prompt immune responses. Our findings suggest that BA.5 has low pathogenicity compared with the ancestral strain but enhanced virus spread /inflammation compared with earlier Omicron subvariants.


Conflict of interest statement

Y.Y. and T.N. are founders and shareholders of HiLung, Inc. J.K. is an employee of HiLung, Inc. Y.Y. is a co-inventor of a patent (PCT/JP2016/057254, “Method for inducing differentiation of alveolar epithelial cells”) related to this work. I.Y. reports speaker fees from Chugai Pharmaceutical Co, and AstraZeneca plt, outside the submitted work. The other authors declare no competing interests.

Figures

Fig. 1
Fig. 1. Virological features of Omicron subvariants in vitro.
A, B Growth kinetics of Omicron subvariants. The four clinical isolates of B.1.1, Omicron BA.1, BA.2, and BA.5 were inoculated into VeroE6/TMPRSS2, Calu-3 (A), and human alveolar epithelial (B) cells, the infectious titers in the supernatant from VeroE6/TMPRSS2 and Calu-3 cells were determined by a TCID50 assay and the copy number of the viral RNA in the supernatant from human alveolar epithelial cells was quantified by RT-qPCR. C Bright-field images of infected VeroE6/TMPRSS2 cells (m.o.i. = 0.01) at 32 h.p.i. D SARS-CoV-2 induced syncytial formation. EGFP- and mCherry-expressing VeroE6/TMPRSS2 cells were co-cultured at a 1:1 ratio and infected with B.1.1, BA.1, BA.2, and BA.5 isolates. Scale bars, 200 μm. Syncytial formation was monitored by immunofluorescent microscopy at 32 h.p.i. Nuclei were counter-staining with Hoechst 33342. Scale bars, 100 μm. The representative images are shown. E The percentage of nuclei in the syncytia was calculated and shown as a bar graph. ND: not detected. F Airway-on-a-chip analysis. Medium containing SARS-CoV-2 was injected into the airway channel, which was then cultured for 6 days. Viral RNA in the supernatant of both airway and blood vessel channels was quantified by RT-qPCR. The ratio of viral invasion toward blood vessel channels was calculated (blood vessel channel/airway channel) on 6 d.p.i., as shown by percentages. G FD4 permeability assay of uninfected and infected airway-on-a-chip at 6 d.p.i. Papp, apparent permeability coefficient. H Immunofluorescent staining for VE-cadherin (red) in HMVEC-L in the uninfected and infected airway-on-a-chip. Nuclei were counterstained with DAPI (blue). Scale bars, 10 μm. Assays were performed independently in duplicate (A) or triplicate (B, E, F, G). In G, statistically significant differences between B1.1 and other variants (P < 0.05), between BA.5 and other variants (*P < 0.05), and between BA.1 and other variants (P < 0.05) were determined by Tukey’s multiplicity correction. In E, the statistical significance of differences between B1.1 and other variants (P < 0.05), and between BA.5 and other variants (*P < 0.05) were determined by Tukey’s multiplicity correction. In F, using Tukey’s multiplicity correction test, the ratio (blood vessel channel/airway channel) of BA.5 was significantly higher than that of BA.1 and BA.2. Both the ratio of B.1.1 and BA.1 was also significantly higher than that of BA.2. In G, statistically significant differences between B1.1 and other variants (P < 0.05), and between BA.5 and other variants (*P < 0.05) were determined by Tukey’s multiplicity correction.
Fig. 2
Fig. 2. Time-course dynamics of Omicron subvariants in vivo.
Syrian hamsters were intranasally inoculated with saline (n = 6, uninfected control), B.1.1 (n = 6), BA.1 (n = 5), BA.2 (n = 6), and BA.5 (n = 6). Body weight (A), PenH (B), Rpef (C), SpO2 (D), and viral RNA load in the oral swab (E) were routinely measured as indicated in the graph. Data are the mean ± s.e.m. In A, the statistical significance of differences between BA.5 and other variants or saline across timepoints from 1 d.p.i. to 7 d.p.i. was determined by multiple regression (*P < 0.05). The family-wise error rates calculated using the Holm method are indicated in the figure. In BE, the statistical significance of differences between B.1.1 and other variants or saline was tested by Tukey’s multiplicity correction (P < 0.05). The statistical significance of differences between BA.5 and other variants or saline was tested by Tukey’s multiplicity correction (*P < 0.05).
Fig. 3
Fig. 3. Virological features of Omicron subvariants in vivo.
Syrian hamsters were intranasally inoculated with B.1.1 (n = 4), BA.1 (n = 4), BA.2 (n = 4), and BA.5 (n = 4). A Viral RNA quantification and titration. Viral RNA load (left, middle) in the lung hilum and periphery and viral titer (right) in the lung periphery were quantified. B IHC of the SARS-CoV-2 N protein in the lungs of infected hamsters. Representative IHC panels of the viral N proteins in the lower lobe of lungs of the infected hamsters. The raw data at 2 d.p.i. are shown in Supplementary Fig. 5A. Scale bars, 500 µm. In A, viral RNA copies and titers at each day were compared using Tukey’s multiplicity correction. As for viral RNA copies in the lung hilum area, BA.5 had significant higher copies than BA.1 at 2 d.p.i. Of viral RNA copies in the lung periphery area, BA.5 had significant higher copies than BA.1 at 2 d.p.i. B.1.1 had significantly higher copies than BA1, BA2, and BA.5 at 5 d.p.i. As for viral titers in the lung periphery area, B.1.1 had significantly higher titers than BA1, BA2, and BA.5 at 2 d.p.i. B.1.1 had significantly higher titers than BA.1 and BA.2, and BA.5 at 5 d.p.i.
Fig. 4
Fig. 4. Pathological features of Omicron subvariants.
Syrian hamsters were intranasally inoculated with B.1.1 (n = 4), BA.1 (n = 4), BA.2 (n = 4), and BA.5 (n = 4). A Histopathological scoring of lung lesions. B H&E staining of the lungs of infected hamsters. Uninfected lung alveolar space and bronchioles are also shown. Scale bars, 200 μm. C Summary of the percentage of the section represented by the inflammatory area with type II pneumocytes at 5 d.p.i. The raw data are shown in Supplementary Fig. 6A. In C, data are the mean ± s.e.m. and each dot indicates the result from an individual hamster. In A, the total score at each day was compared using Tukey’s multiplicity correction. At 2 d.p.i, B.1.1 had significantly higher score than BA1, BA2, and BA.5. At 5 d.p.i., B.1.1 had significantly higher score than BA.1 and BA.2, and BA.5 had significantly higher score than BA.1. In C, the statistical significance of differences (*P < 0.05) was determined by the analysis of variance using Tukey’s multiplicity correction.
Fig. 5
Fig. 5. Gene expression alteration of hamster lungs upon infection with Omicron subvariants.
A mRNA of the lung tissues obtained at day 2 post-infection was used to measure expression levels of inflammatory genes (Cxcl10, Il-6, Isg15, and Mx-1) with normalization using the housekeeping gene Rpl18. B Similarity of gene expression alteration upon infection with the Omicron subvariants and the ancestral B.1.1 lineage. Spearman’s correlation of the log 2-fold change (FC) value [infected versus uninfected hamsters] was calculated between pairs of variants. Results for 2 d.p.i. (left) and 5 d.p.i. (right) are shown. C Heatmap showing gene expression alteration caused by the respective variants at 2 d.p.i. The scaled fold change (FC) values for 438 genes that were differentially expressed between uninfected and infected hamsters and among the variants are shown. Genes were categorized into six clusters. Information on the clusters is summarized in Supplementary Data 1. D GO enrichment analysis for genes in the clusters. Of the significantly enriched GO terms, the top 3 terms are shown. The full list of GO terms is summarized in Supplementary Data 2. E Expression dynamics of genes in clusters 1 and 6 from 2 d.p.i. to 5 d.p.i. Gene expression levels were normalized as Z scores, and the mean values among replicates are shown. The black line indicates the mean dynamics. Genes associated with the GO terms “cell division” (for cluster 1) and “innate immune response” (for cluster 6) are colored. In A, each dot indicates the result from an individual hamster. The statistical significance of differences among Omicron subvariants was tested by Tukey’s multiplicity correction (*P < 0.05).

References

    1. WHO. "Classification of Omicron (B.1.1.529): SARS-CoV-2 Variant of Concern (November 26, 2021)” https://www.who.int/news/item/26-11-2021-classification-of-omicron-(b.1.... (2020).
    1. Tegally H, et al. Emergence of SARS-CoV-2 Omicron lineages BA.4 and BA.5 in South Africa. Nat. Med. 2022;28:1785–1790. doi: 10.1038/s41591-022-01911-2. - DOI - PMC - PubMed
    1. Kislaya, I. C. et al. SARS-CoV-2 BA.5 vaccine breakthrough risk and severity compared with BA.2: a case-case and cohort study using Electronic Health Records in Portugal. medRxiv10.1101/2022.07.25.22277996 (2022).
    1. Cao Y, et al. BA.2.12.1, BA.4 and BA.5 escape antibodies elicited by Omicron infection. Nature. 2022;608:593–602. doi: 10.1038/s41586-022-04980-y. - DOI - PMC - PubMed
    1. Hachmann NP, et al. Neutralization Escape by SARS-CoV-2 Omicron Subvariants BA.2.12.1, BA.4, and BA.5. N. Engl. J. Med. 2022;387:86–88. doi: 10.1056/NEJMc2206576. - DOI - PMC - PubMed

Publication types

Supplementary concepts