. 2023 Jul 24;6(1):771.
doi: 10.1038/s42003-023-05148-8.

Zfp296 knockout enhances chromatin accessibility and induces a unique state of pluripotency in embryonic stem cells

Affiliations

Zfp296 knockout enhances chromatin accessibility and induces a unique state of pluripotency in embryonic stem cells

Satsuki Miyazaki et al. Commun Biol. .

Abstract

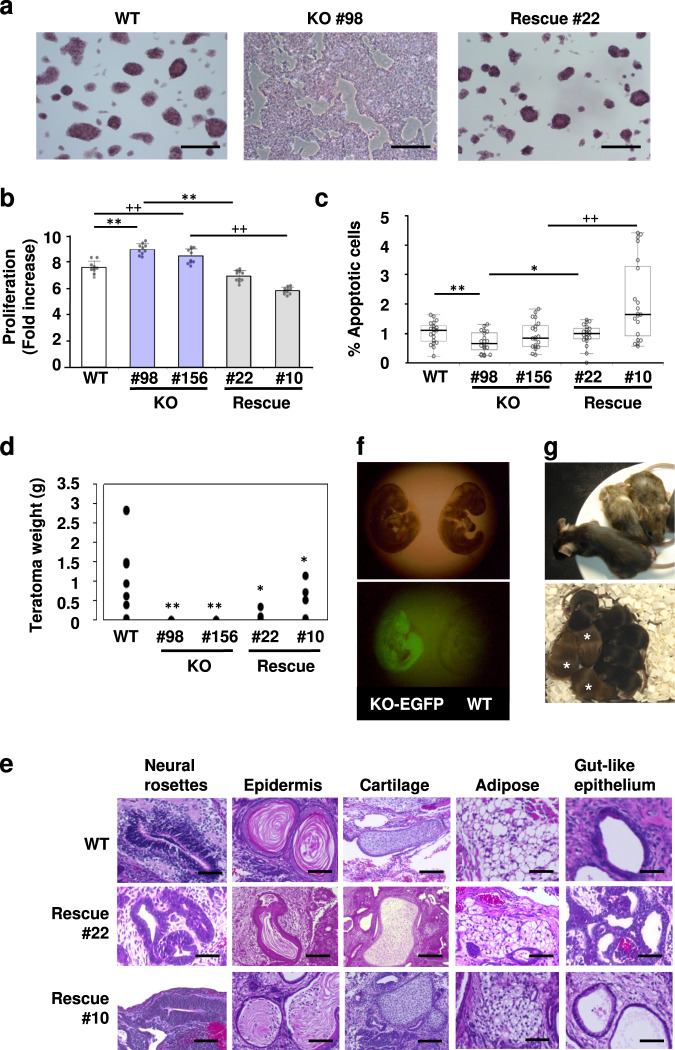
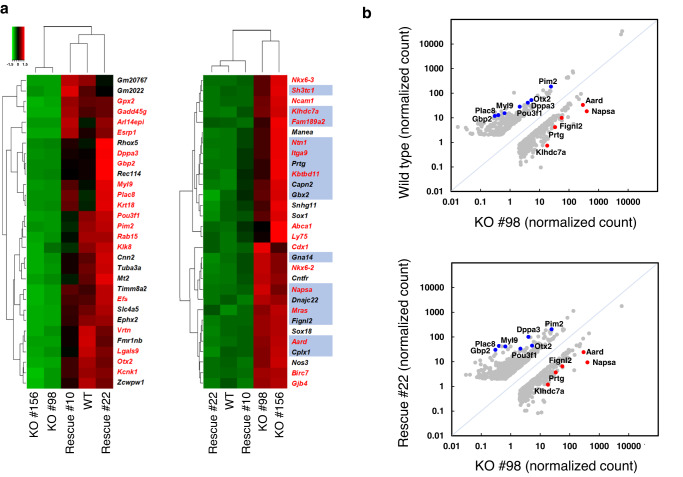
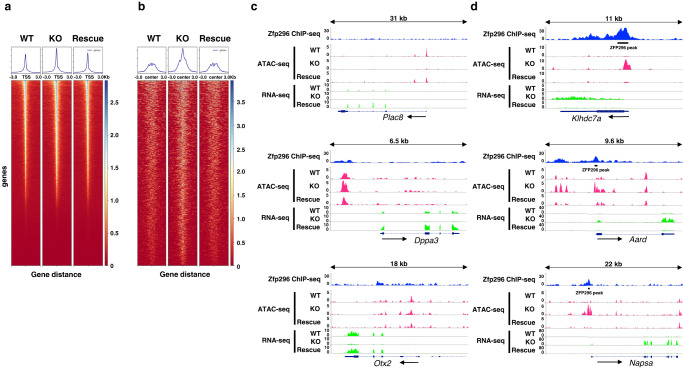
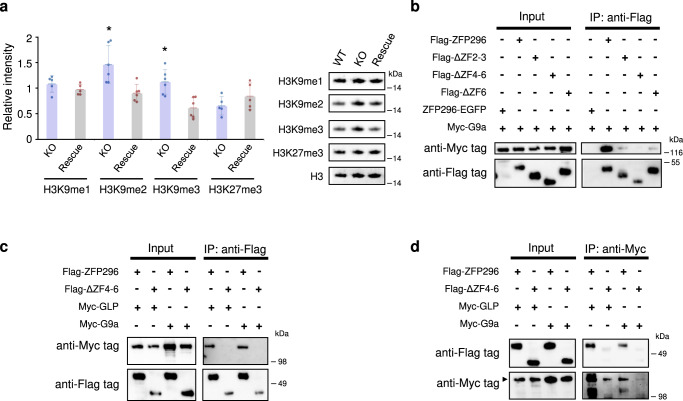
The Zfp296 gene encodes a zinc finger-type protein. Its expression is high in mouse embryonic stem cells (ESCs) but rapidly decreases following differentiation. Zfp296-knockout (KO) ESCs grew as flat colonies, which were reverted to rounded colonies by exogenous expression of Zfp296. KO ESCs could not form teratomas when transplanted into mice but could efficiently contribute to germline-competent chimeric mice following blastocyst injection. Transcriptome analysis revealed that Zfp296 deficiency up- and down-regulates a distinct group of genes, among which Dppa3, Otx2, and Pou3f1 were markedly downregulated. Chromatin immunoprecipitation sequencing demonstrated that ZFP296 binding is predominantly seen in the vicinity of the transcription start sites (TSSs) of a number of genes, and ZFP296 was suggested to negatively regulate transcription. Consistently, chromatin accessibility assay clearly showed that ZFP296 binding reduces the accessibility of the TSS regions of target genes. Zfp296-KO ESCs showed increased histone H3K9 di- and trimethylation. Co-immunoprecipitation analyses revealed interaction of ZFP296 with G9a and GLP. These results show that ZFP296 plays essential roles in maintaining the global epigenetic state of ESCs through multiple mechanisms including activation of Dppa3, attenuation of chromatin accessibility, and repression of H3K9 methylation, but that Zfp296-KO ESCs retain a unique state of pluripotency while lacking the teratoma-forming ability.


Conflict of interest statement

The authors declare no competing interests.

Figures

Fig. 1
Fig. 1. Effects of the presence or absence of Zfp296 expression on ESC colony morphology, growth, apoptosis, teratoma formation, and chimeric mouse formation.
a Colony morphology. Wild-type (WT), Zfp296−/− #98 (KO), and Zfp296−/−(CAG-Zfp296) #22 (Rescue) ESCs were cultured and stained for alkaline phosphatase. Scale bars, 300 μm. b Cell proliferation assay. Cell proliferation between 24 and 72 h of culture was measured using a cell counting kit. The proliferation rate of KO #98 and #156 ESCs was significantly higher than that of WT, Rescue #22, and #10 ESCs. Values are expressed as means ± SD (n = 10 each). Difference from KO #98 cells: **P < 0.01 by Student’s t-test. Difference from KO #156 cells: ++P < 0.01 by Student’s t-test. c Apoptosis assay. The percentage of cleaved caspase 3 (CCP3)-positive apoptotic cells was calculated for 20 areas selected at random (> 300 nuclei per area). The percentage of CCP3-positive cells in KO #98 cells was significantly lower than that in WT or Rescue #22 cells. Values are expressed as means ± SD. Difference from KO ESCs: *P < 0.05, **P < 0.01, ++P < 0.01 by Student’s t-test. d Teratoma formation. WT, KO #98 and #156, and Rescue #22 and #10 ESCs (n = 8 each) were injected subcutaneously into immunodeficient or histocompatible mice. Four weeks later, these mice were sacrificed, and the tumors were weighed. Neither KO #98 nor #156 ESCs formed recognizable teratomas. Difference from WT cells: *P < 0.05, **P < 0.01 by Student’s t-test. e Histological analyses of the teratomas derived from WT, Rescue #22, and #10 ESCs. No histological differences were recognized among these teratomas. Scale bars, 50 μm. f, g Blastocyst injection. WT and KO-EGFP #26 ESCs, which are EGFP-expressing Zfp296-deficient cells derived from KO #98 cells, were injected into C57BL/6 J blastocysts, which were then transferred into the uteri of pseudopregnant female mice. Broad contribution of KO-EGFP cells to the resulting fetus was confirmed at day 10 p.c. by EGFP fluorescence (left fetus) (f, lower panel). Chimeric mice were born (g, upper panel). When male chimeras were mated to C57BL/6 J females, the progeny included mice with agouti coat color (g, lower panel; marked by asterisk), indicating germline transmission of KO-EGFP ESCs. Genotyping of these agouti progeny showed that they harbor either of the targeted alleles of Zfp296.
Fig. 2
Fig. 2. Effects of Zfp296 deficiency and overexpression on the transcriptome of ESCs.
a Heatmap showing Z-score normalized transcript levels of the genes differentially expressed among WT, KO #98 and #156, and Rescue #22 and #10 ESCs. Red and green colors represent up- and down-regulation, respectively. The left and right panels show the top 30 genes most highly down- and up-regulated upon Zfp296 KO, respectively (KO vs. WT ESCs, P < 0.05). Genes with normalized read counts less than 8 in all the ESCs and noncoding genes were omitted. Dendrograms show hierarchical clustering analysis of the five ESC lines and the 30 genes in each panel. ZFP296 binding peaks from ChIP-seq were found in the vicinity of 16 genes (highlighted in blue) out of the 30 genes upregulated upon Zfp296 KO. Genes highly induced and strongly repressed in EpiLCs are shown in red in the left and right panels, respectively. b Scatterplots of RNA-seq TMM normalized read counts of the genes that showed more than 3-fold (WT > KO #98 ESCs) or 2.5-fold (WT < KO #98 ESCs) difference (upper panel) and those that showed more than 3-fold difference (Rescue #22 vs. KO #98 ESCs; lower panel). Genes with normalized read counts less than 2 in all the ESCs were omitted. Blue and red dots represent some of the genes markedly down- and up-regulated in KO ESCs, respectively.
Fig. 3
Fig. 3. Reduced expression of Dppa3 in Zfp296-KO ESCs.
a Immunofuorescence analysis of DPPA3 expression in WT, Zfp296-KO #98, and Rescue #22 ESCs. Nuclei were counterstained with DAPI. Scale bars, 50 μm (upper panels), 25 μm (middle and lower panels). b Western blot analysis of DPPA3 expression in WT, Rescue #22, and KO #98 ESCs (upper panel). Signal intensity of each DPPA3 band was measured relative to that of the Lamin B1 band. The lower panel shows the DPPA3 levels expressed relative to those in WT ESCs and as means ± SD (n = 3). *P < 0.05 by Tukey’s test. c Analysis of the DNA methylation levels of the Dppa3 promoter. Genomic DNA was isolated from WT, KO #98 and #156, and Rescue #22 and #10 ESCs. The CpG islands in the upstream region of the Dppa3 gene were analyzed for cytosine methylation. Filled and open circles represent methylated and unmethylated CpGs, respectively. The percentage of methylated CpG sites is shown under each panel. d Analysis of 5mC and 5hmC levels by dot blot assay. Control 5mC and 5hmC DNA and genomic DNA from WT, KO #98 and #156, and Rescue #22 and #10 ESCs were denatured. Two-fold serially diluted DNAs were spotted onto membranes. Antibody against 5mC (left panel) or 5hmC (right panel) was utilized for detection.
Fig. 4
Fig. 4. Analysis of ZFP296 binding sites by ZFP296 ChIP-seq.
a Pie chart showing the distribution of ZFP296 ChIP-seq peaks across genomic regions. b Plot showing the distribution of ChIP-seq peaks relative to known TSS. c Gene ontology (GO) biological processes enriched in the genes located near ZFP296-binding loci. d Most abundant DNA sequence motifs identified in ZFP296 ChIP-seq peaks. Consensus DNA binding motifs were computationally identified in the retrieved sequences of the ZFP296 binding peaks. e Localization of ZFP296 to heterochromatin. KO #98 and Zfp296−/−(CAG-Flag-Zfp296) cells (Rescue) were stained with anti-Flag-tag antibody followed by Alexa Fluor-labeled second antibody. Cells were counterstained with DAPI and observed by confocal fluorescence microscopy. Scale bars, 2 μm.
Fig. 5
Fig. 5. Analysis of chromatin accessibility around TSS and ZFP296 binding sites.
a Heatmaps and line plots showing average ATAC-seq signal centered on TSS. Each row corresponds to an individual gene. b Heatmaps and line plots showing average ATAC-seq signal centered on ZFP296 binding peaks located within 3 kb from TSS. Each row corresponds to an individual binding site. Heatmaps and line plots were made using deepTools. c, d Genome browser tracks of counts per million (CPM) mapped reads of ZFP296 ChIP-seq and ATAC- and RNA-seq (WT, KO #98, and Rescue #22) across three genes each that showed a marked decrease and increase in expression after Zfp296 KO.
Fig. 6
Fig. 6. Effects of ZFP296 binding on the chromatin accessibility.
a, b Upset plots showing overlap of ATAC-seq peaks among WT, KO #98, and Rescue #22 ESCs. The ATAC-seq peaks non-overlapping and overlapping with ZFP296 binding peaks were analyzed separately. c, d Scatter plots showing comparison of ATAC-seq normalized read counts within each merged ATAC-seq peak between KO–WT (left panels), KO–Rescue (middle panels), and Rescue-WT (right panels). The merged peaks non-overlapping (c) and overlapping (d) with ZFP296 binding peaks were analyzed separately. Peaks near the genes that showed significant difference in expression (P < 0.05) were marked as follows: Red dots represent the peaks near the genes whose normalized read counts of RNA-seq were no less than 6 and more than 3-fold higher in ESCs on the X-axis than on the Y-axis for each panel; Blue dots represent the peaks near the genes whose normalized read counts of RNA-seq were no less than 6 and more than 3-fold higher in ESCs on the Y-axis than on the X-axis for each panel. Gene names were put on the red dots in the left and middle panels (d).
Fig. 7
Fig. 7. H3K9 hypermethylation in Zfp296-KO ESCs and binding of ZFP296 to G9a/GLP.
a Histone H3K9 methylation in the presence or absence of Zfp296 expression. Western blot analysis was performed for H3K9me1/2/3 and H3K27me3 using nuclear extracts from WT, KO #98, and Rescue #22 ESCs. The density of each band relative to that with anti-histone H3 antibody was measured. The level of each histone modification was expressed relative to that in WT ESCs. Data represent means ± SD of five (H3K9me1 and H3K27me3) or six (H3K9me2/3) independent experiments. *P < 0.05 vs. Rescue cells by Student’s t-test. Some of these western blot analyses are shown in the right panel. b Coimmunoprecipitation analysis of the interaction between ZFP296 and G9a (see Methods). Flag-ZFP296, its deletion mutants, or ZFP296-EGFP were coexpressed with Myc-G9a in 293 T cells. Nuclear extracts were immunoprecipitated with anti-Flag-tag antibody, followed by SDS-PAGE and western blotting. The membrane was treated with anti-Myc-tag antibody followed by anti-Flag-tag antibody treatment. c, d Coimmunoprecipitation analysis of the interaction between ZFP296 or its deletion mutant ΔZF4-6 and GLP or G9a. Nuclear extracts were immunoprecipitated with anti-Flag-tag or anti-Myc-tag antibody, followed by SDS-PAGE and western blotting. The membrane was treated with anti-Myc-tag antibody followed by anti-Flag-tag antibody treatment. Immunoprecipitation of Myc-G9a with anti-Myc-tag antibody appeared inefficient compared with that of Myc-GLP.

References

    1. Mitsui K, et al. The homeoprotein nanog is required for maintenance of pluripotency in mouse epiblast and ES cells. Cell. 2003;113:631–642. doi: 10.1016/S0092-8674(03)00393-3. - DOI - PubMed
    1. Yoshimura T, et al. Gene expression pattern of Cue110: A member of the uncharacterized UPF0224 gene family preferentially expressed in germ cells. Gene Expr. Patterns. 2007;8:27–35. doi: 10.1016/j.modgep.2007.08.003. - DOI - PubMed
    1. Tashiro F, et al. Maternal-effect gene Ces5/Ooep/Moep19/Floped is essential for oocyte cytoplasmic lattice formation and embryonic development at the maternal-zygotic stage transition. Genes Cells. 2010;15:813–828. doi: 10.1111/j.1365-2443.2010.01420.x. - DOI - PubMed
    1. Miyazaki T, et al. Functional analysis of Tcl1 using Tcl1-deficient mouse embryonic stem cells. PLoS One. 2013;8:e71645. doi: 10.1371/journal.pone.0071645. - DOI - PMC - PubMed
    1. Takahashi K, Yamanaka S. Induction of pluripotent stem cells from mouse embryonic and adult fibroblast cultures by defined factors. Cell. 2006;126:663–676. doi: 10.1016/j.cell.2006.07.024. - DOI - PubMed

Publication types